Hi everyone, This is my homework post for week 5. I have learned new things from the excellent lecture given by Respected sir @stream4u.
SuperTrend Indicator.
Indicator is a tool that is used to analyze the market direction. It also helps to take sell or buy position. In cryptocurrency trading, trader can enter the market by setting up buy trade and exit the market by selling the asset. Hence indicators can be very helpful for traders. SuperTrend Indicator is one of these built-in indicators and can be used by traders. This Indicator shows two lines, one is red and it is used as resistance level and is used for sell trades. Other is green line and it is used as support and is useful for buy trade. We will discuss in detail about SuperTrend Indicator.
.png)
How to setup SuperTrend Indicator.
This Indicator is available at www.tradingview.com. Open this website and click on any chart you want to open. When chart is open, there is an option of Indicators, click on it and it will give a list of indicators. Click on Library option and search by typing "SuperTrend". Now click on supertrend and the indicator will be applied to the chart. In this way, user can setup this Indicator in the chart.
Now I will explain it with the help of pictures given below. Follow these steps and indicator will be applied to the chart.
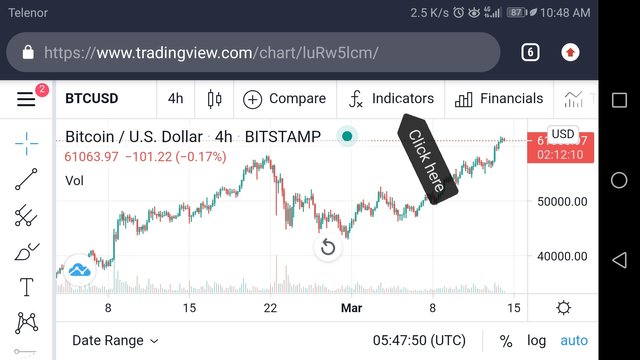
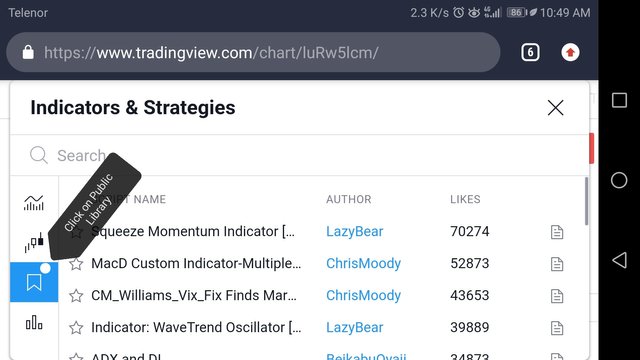
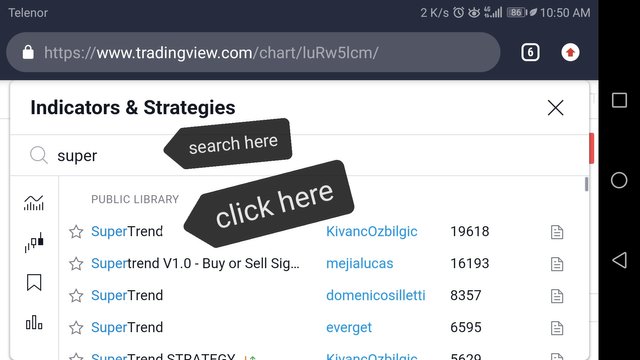
In this way, SuperTrend Indicator will be applied to the chart.
Settings of SuperTrend Indicator.
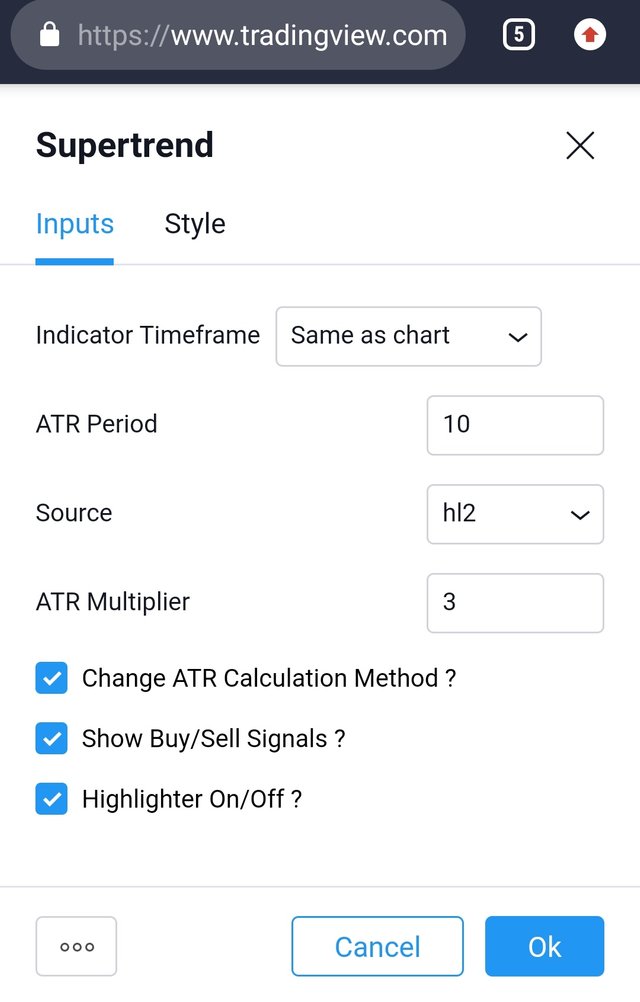
When you double click on the line of SuperTrend Indicator, then the settings will appear as below screenshot. It has mainly two options. First is ATR period and the second option is ATR multiplier. These can be changed but its default values are as given in the picture. ATR period value is 10 and ATR multiplier is 3.
How to trade with SuperTrend Indicator.
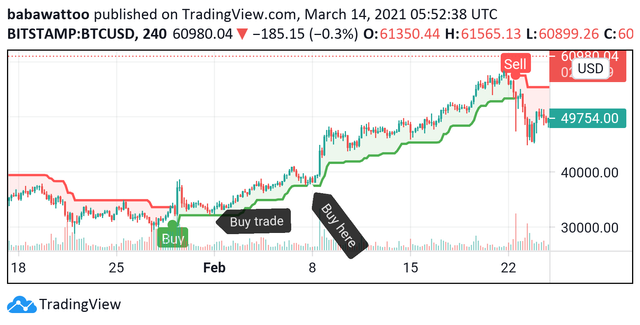
Now we will discuss the method of trading with the help of this indicator. This indicator can be used with any timeframe. For short term trades, small timeframes like 5 min, 15 mins, 30 mins or hourly timeframe can be ised. For long term trades, daily timeframe can be helpful. This Indicator shows the trend of the market. When the market trend is bullish, it shows green line below the candlesticks in the chart. As I told earlier that green line works as support, whenever market touches this green line, a trader can setup a buy trade. This has been shown in the below given picture.
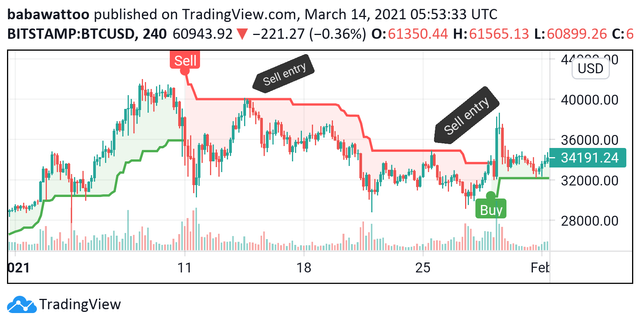
As I mentioned that in cryptocurrency market, a user can enter market by setting up buy trade and then can exit market by selling the asset. It means selling is used for closing the trade. So, when a trader should enter sell trade, this Indicator also helps traders in this regard. When market is in ready to go short, a red line appears on the chart and it is used as resistance line. When the market touches resistance line, the sell trade can be taken and a trader can exit the market at this level. This has been explained in the below picture.
False Indications.
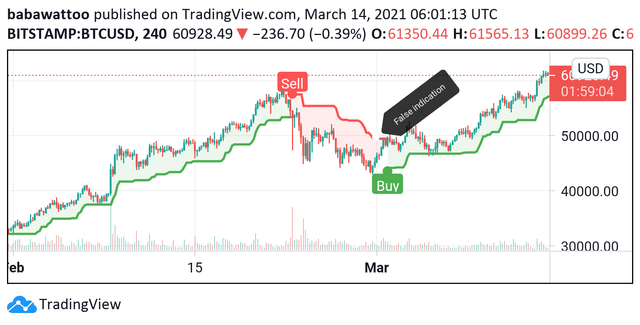
There is no Indicator that can be said to be 100% accurate. Likewise this Indicator also shows some false Indications. The trader has to use this indicator very carefully. Also it can be used alongwith other indicators. I have given some examples of false indications by this indicator. A trader cannot rely on any trader fully, but these indicators can be used as a help for analyzing the market.
Stoploss.
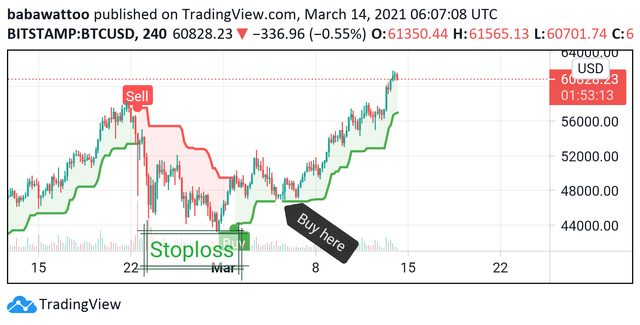
Stoploss is very important in trading as it saves traders from huge loss. So a trade without stoploss is not a wise decision. But this indicator does not help in setting stoploss. A trader has to decide where to put stoploss to the trade. As we discussed in previous lectures, support and resistance can be used to setting stoploss of the trade.
Conclusion.
To conclude, it can be said that SuperTrend Indicator is one of the best indicators available in the market. It can be very helpful for traders in analyzing the market.
Special mentions.
@steemcurator01
@steemcurator02
@stream4u
Thanks.
Hi @babawattoo
Thank you for joining Steemit Crypto Academy and participated in the Homework Task 5.
Your Homework task 5 verification has been done by @Stream4u.
Thank You.
@stream4u
Crypto Professors : Steemit Crypto Academy
Downvoting a post can decrease pending rewards and make it less visible. Common reasons:
Submit
Thanks sir for appreciation
Downvoting a post can decrease pending rewards and make it less visible. Common reasons:
Submit