Hi everyone, I am new to this platform called crypto academy and I am going to submit my first homework post for Professor @stream4u. I attended the lecture and I learned all new things to me. I also read previous lecture to understand it fully.
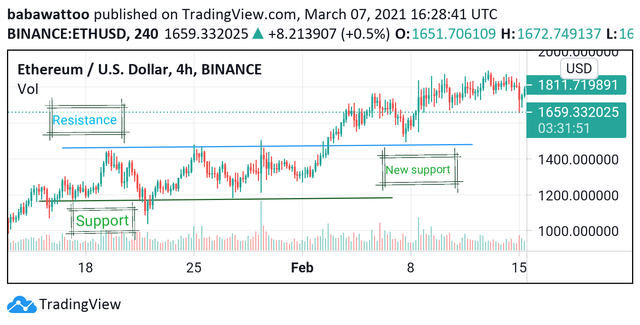
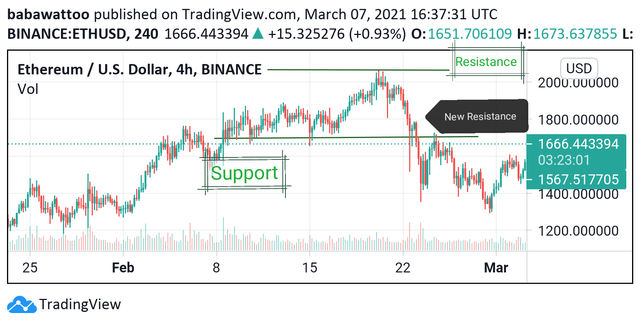
Support become resistance and resistance become support.
Support and Resistance are very important in trading. Specially in crypto trading, it plays a vital role in setting buy trade and exiting the trade. These levels are very important in entering and exiting the market.
A support level is a point where a trader can take buy trade and at resistance level, trader can exit the market.

In uptrend markets, resistance level can be broken and if market keeps on moving upward for next few days, it is called that resistance has become support.

When the market moves downwards and a support level is broken and the market keeps on moving downwards, this broken support level becomes new resistance. It is clear from this discussion that a support can become resistance and a resistance can become support.
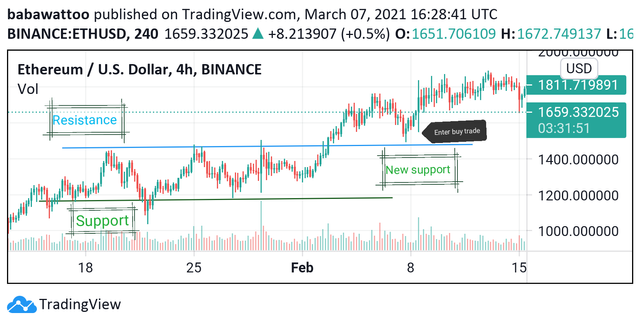
When and where to set buy trade.
First of all a trader should draw support and resistance lines correctly. Now to set a buy trade, support level is the point to enter the market. If a market is moving within a support and resistance level, a trader can set buy trade at support line. In case when market breaks resistance and this resistance becomes new support, trader will have to wait for the market to come to this support level with patience and then enter a buy trade when market tests this new support level. In this case, the previous support level will be the stoploss for a buy trade. If the analysis go wrong and market moves downward, stoploss can save trader from huge loss.

What is Technical Indicator.
Technical indicator is a tool that helps in analyzing the market movement. It indicates certain movements where a trader can enter or exit the trade. There are many technical indicators available in the market. As I am newbie, I have not used any indicator before. But while exploring different incicators, I find Zig Zag indicator and it is very interesting. It moves in a pattern and indicates pauses in the market where the market can go against the trend for a while. It can be helpful for traders to enter and exit the market.
.png)
A technical indicator is basically developed keeping in view some mathematical calculations. Its basic motive is to facilitate the traders and analyze the market properly. So every indicator is not 100% correct, but it is only an indication. Trader has to be careful while trading and should enter the market keeping in view different aspects of the market.
What is Trading View.
Trading View is a website. I have explore this website for the first time and I have seen that there are too many indicators and other tools available on this website. Other websites do not provide such tools for trading purposes. A user can also set watchlist of its favorite coins. Another point, i noticed that it provides prices of different exchanges of an asset that are different from each other. Some exchanges have different prices than others and Trading View platform provide all of them at one place. There are many users with different ideas and all of them are sharing these ideas for traders. So a trader can take advantage of these ideas and find some good trade accordingly.
It has been a very good experience for me to explore this platform and I suggest all my readers to explore this platform.
200 Moving Average.
It is quite an amazing indicator. Moving Average can be set at different values. It can be 30, 50, 100 or 200. Every value shows different results. 200 moving average is an average of previous 200 candlesticks. It is in the form of a line. If user has selected 1 day time frame, then it presents average of previous 200 days candlesticks and it helps in analyzing the movement of market.
Now in upward trending market, 200 moving average curve will be to the upside and in most of the cases, candlesticks will be formed above the line of moving average. Whenever market goes downward and the candlesticks on the chart move near to the moving average, it is possible that it can touch moving average line. On this point, if market forms any rejection patterns, then market will move back upwards. If it touches moving average line and intersect the line successfully and after that remains under that line, it is possible that market can go short for long time.

Ina downtrend market, moving average line curve remains to downward and candlesticks are formed below this line. When market moves against the trend and moves upward, it can touch this moving average line and then go back downwards. It is also possible that it can break the line and move upward for few days. It can be an indication of trend reversal and market can remain in upward trend for some time.
.png)
In this way, 200 moving average can help the traders to enter and exit the market. In short time frames, it can be very useful for intraday trading or short term trading.
I have tried my best to explain everything and submitting my homework to respected Professor @stream4u.
Special mentions,
@steemcurator01
@steemcurator02
@stream4u
Hi @babawattoo
Thank you for joining Steemit Crypto Academy and participated in the Homework Task 4.
Your Homework task 4 verification has been done by @Stream4u.
Thank You.
@stream4u
Crypto Professors : Steemit Crypto Academy
Downvoting a post can decrease pending rewards and make it less visible. Common reasons:
Submit