Basic EMA Strategy + Trend Line Break
introductory
Hello everyone, I trust you are doing well. I welcome you all once again to an amazing week of the crypto Academy. What I will be discussing with you today, is about the Basic EMA stretegy combined with the Trend line break. I. E I will be showing you the basic steps and guidelines one need to know before carrying out the "EMA + Trend Line Break" trading strategy. Keep up, its about to get interesting!!

Question 1.) - Define and Explain in detail in your own words, what is the Strategy of the EMA + Breakout of the Trend line?
Before diving in to the explanation of EMA + Trend Line breakout, it'd be better to split the two words first for better explaination, so comes first, What is EMA?
EMA also known as Exponential Moving Average is a technical indicator that displays a line on the chart and it uses a numerical recipe to streamline the value activity. It shows the market price throughout a specific timeframe. The EMA procedure puts more weight on the new cost. This implies it's more dependable because it responds quickly to the most recent changes in price information.
The exponential moving average as well attempts to lessen the confusion and commotion of regular price activity. Second, the moving average smoothes the cost and uncovers the pattern. The moving average is likewise more dependable and precise in calculating future changes in the market cost.
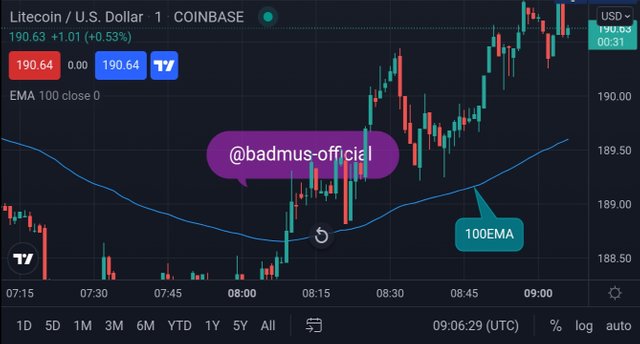
Example of a 100 Exponential Moving Average indicator image below
Now to the next which is trend line break
Trend Line Break are the lines drawn at the end point above or beneath the price trend ,that is ,where the market discontiue a trend before picking another direction. They are utilized to give signs concerning the quick pattern and show when a pattern has changed. They can likewise be utilized as help and opposition and shows a sell or entry point in a trend.
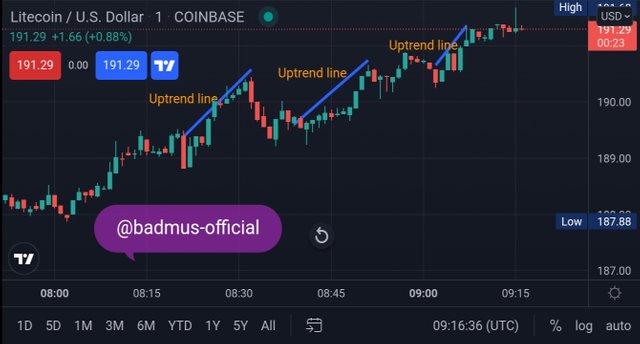
Example of a uptrend line break is as shown below
Now what we will be discusing next is the combination of Ema and trend line break strategy
So now that we've know what the EMA and Trend Link break is , we move to the strategy explanation ,that is , how is this method of trading utilized in a trade.
The EMA + Trend line break strategy is simply the combination of break lines on trend and as well as the EMA indicator and we utilize this method by adding the indicator and composing a break line in our chart , which we then set a proper limit of days limit on out EMA to carry out the trend and know the positioning of the current market direction.
Example of EMA + Trend line break strategy is as seen below ;
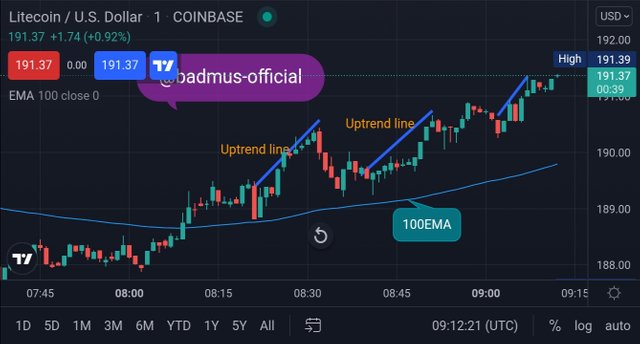
Just as seen that am making use of 100EMA on my chart and as well i broke these line when the candle stick comes to an end of the price ,then took another positioning.

Question 2) - Explain in detail the role of the 100-period EMA in the EMA + Trendline Breakout Strategy
What we should understand fully is that , a moving average just like its definition that is average data of a particular trend, so in this case of EMA that is exponential moving average where in our case we are making use of length 100 so as to clearly depict to us the market movement clearly.
You know , like i said that we can use this indicator to predict future market movement , so making use of 100 EMA will make it known to us what the trend has been doing in the past days average , then we implement it in our break line so as to know our sell or buy point in the trade.
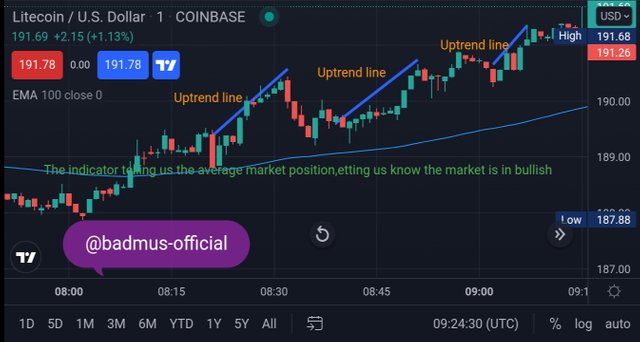
Just as seen in the chart above that the EMA indicator is showing to us the market direction as seen that the indicator is pointing to bullish direction ,you know the average indicator depect infromation that has happended in the past and traders make use of that to predict what might happen next, that is , with the help of the 100 EMA indicator with the break line point , we get to predict future market movment and make our buy/sell positioning in the market.

Question 3) - Explain in detail the role of the "Trend Line" in the EMA + Breakout Strategy Trendline Breakout?
Trend lines are the lines drawn at a point above or below on a chart, so as to eaily fugure out the market direction , that is the line drawn to know what the market price has been doing or what the market might do next.
Trading with trend line are as important as well as using the indicator, as this gets to bring confirmation of the indictaor you are using, which led you to able to confirm the direction of what the indication is giving.just as we know that making use of only indicator in a trade is really not advisible as they tends to show false signals sometimes but with trend lines you get to know the real direction of the market movement .
Just as we know there are bullish trend also know as well uptrend, and as well as bearish trend which we know as downtrend.
So drawing a trend line give confrmation to our indicator and give safety to our trading.
Example shown belown;
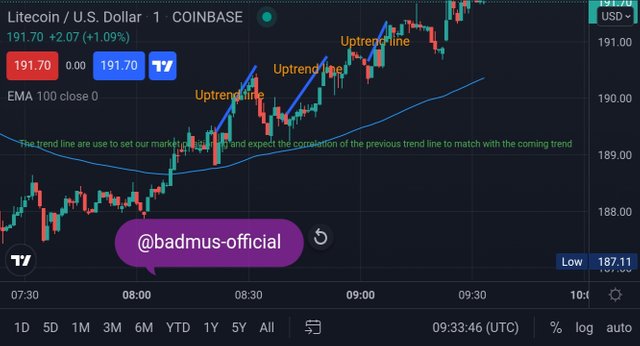
The image showing the direction of trend line, along the EMA indicator on the "EMA + trend breaking", just as we saw that these trend gives confirmation to which signal of the EMA is correct, and with this gives confimation of entry for traders, which i think is one of the important role trend line gives in the EMa + break strategy and as well the trend line let's traders figure out which trend position will occur next.

Question 4. ) - Explain the step by step of what needs to be taken into account to execute the EMA + Trendline Breakout strategy correctly.
In other to execute trade correctly using the EMA + Trendline Breakout strategy I will be explaining in 3 steps that would help in carring out a proper trade with this strategy.
Step1: Set up your EMA to 100, although traders can choose which best way to execute his trade depending on what one found Convenience with or used, to but here I will give trading strategy using 100 EMA, using this makes it easier for traders to able to quickly signal there buy or sell entry, as the indicator shows the market movemement in average phase direction, so setting our EMA in 100 will give detail of the direction in a sense where by if the price is above the 100 EMA, that shows a signal for buy and as well if reverse is the case, that is if the price is below the 100 EMA that is a signal for selling.
Example shown below;

Our buy entry is as shown from the image above when the price is above the 100EMA
Example2 shown below;
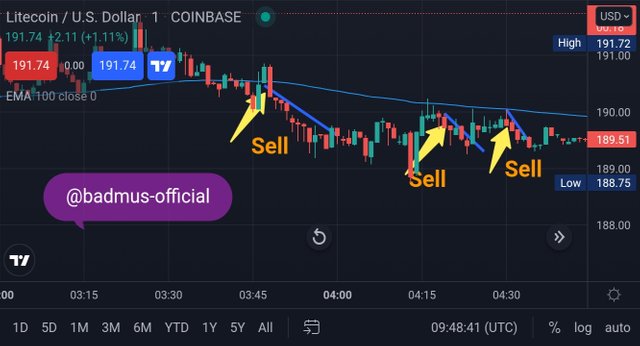
Example 2 shows our exit, that is when the price is below the 100 EMA, which correspond to when the market is already showing bearish and that should be the point we look for sales.
Step2: Understand the market movement. One interesting part of this strategy is that, it's in form of a cycle movement, and this make it more suitable as one can easily draw out a cycle and make a decision on that to predict what likely the market might do next.
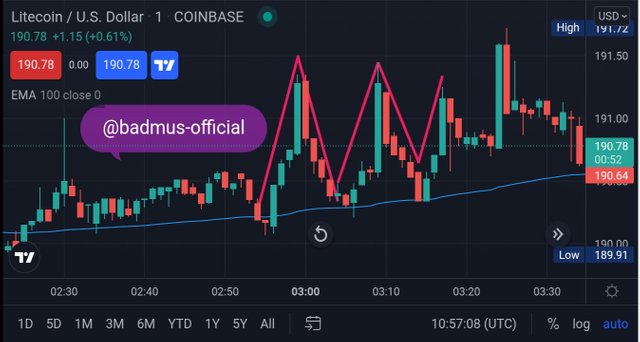
Just as seen from the image above that, the market structure showing bullish trend and the structure keep maintaining the cycle. Note that when the price is in bullish and the distance in between the bullish trends are becoming smaller to the previous trend.
Example2

Example2 showing our market structure in bearish trend, as we can see when the price is in bearish the downtrend keep on getting bigger than the previous.
Step 3: Tracing trend lines : As this is the last step on how to correctly use the EMA with breaking, so far we've discuss the two steps below and have been interesting so far, we are going to wrap our steps with the trend line retracement and this is achieved in a way such that, we basically find a bearish position when our market is in bullish trend, that is when the indicator is above then we pin point the bearish line we draw to the next as to know when to make trade at high cost.
For example
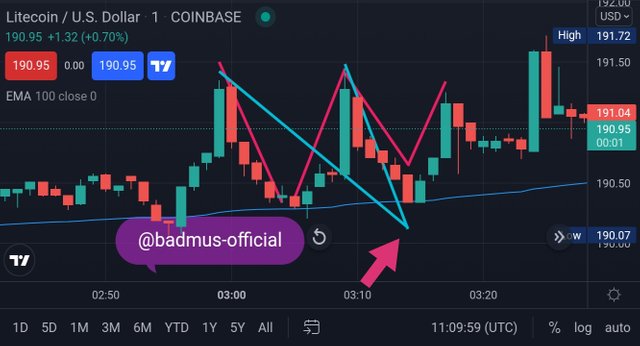
From the picture above, we can see that the market is in bullish Trend which we then tends to draw the retracement line as to know when to trade more, which gives a little certainty that the market Is still in a good positioning considering the retracement line.
Example2
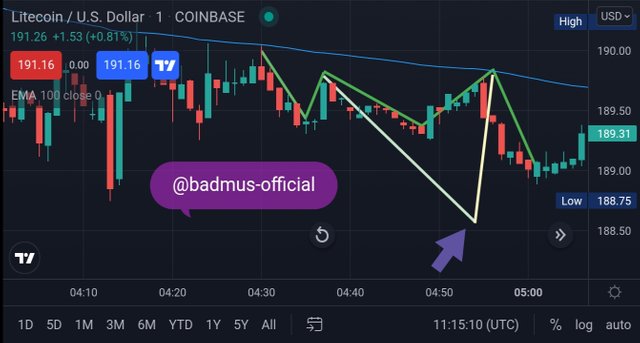
Example showing when the market is in bearish with the retracement of the line co-joining the previous uptrend, traders can now easily use this line to figure when to totally sell and exit the market so as not to end up on the bad side of the trade.

Question 5.) - What are the trade entry and exit criteria for the EMA + Trend Line Break strategy?
Entry Criteria: The first thing we should consider when making an entry into the market with the EMA + Break line strategy is to make sure the market price is moving above the 100 EMA, I e the trend is in bullish direction, then
We draw our trend line and wait for the market direction to take another turn then after we've successfully execute the two criteria mention then we make our entry placing a buy order in the market as soon as the breakout candlestick close on the trend.
For example :
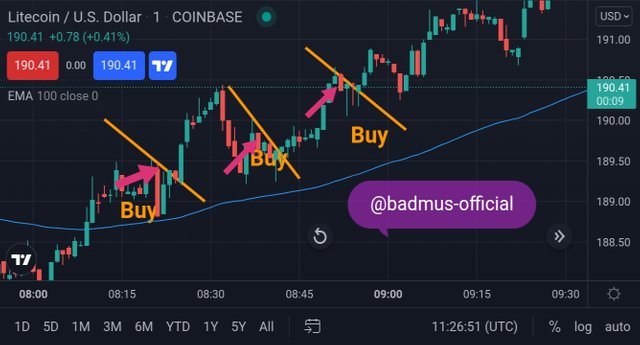
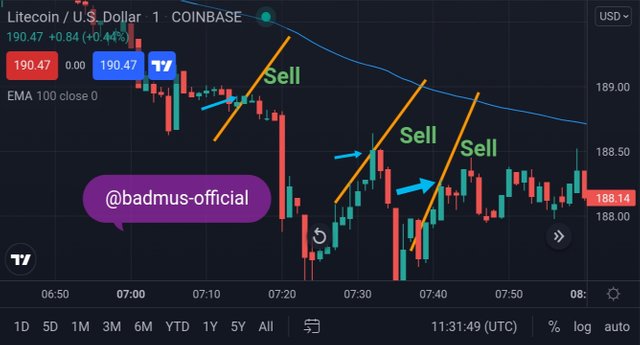
Exit Criteria: This is just opposite of what we've discussed earlier, First we ensure that The price is moving below the 100 EMA I. E when the market is in bearish, then secondly we draw a trend line awaiting for the market to pick another direction afterwards we exit the market the moment the breakout candle stick close on the trend.
For Example
Question 1) - Make 2 entries (One Bullish and one Bearish) in any pair of "Cryptocurrencies" using the "EMA Strategy + Trend Line Break" (Use a Demo account, to be able to make your entry in real time at any timeframe of your choice, preferably low temporalities).
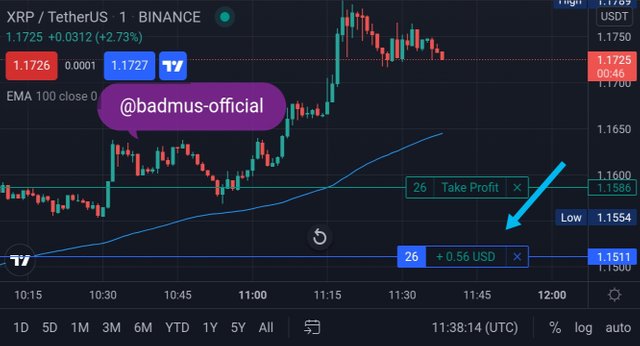
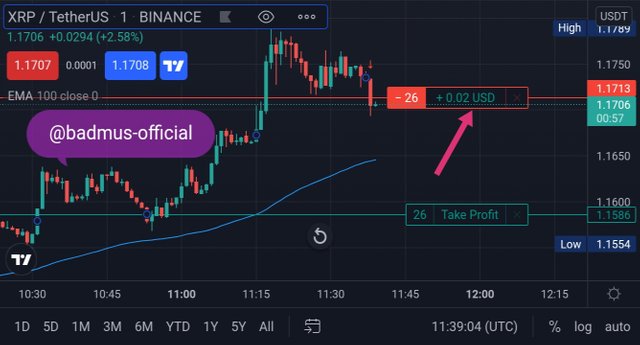
For this task I will be showing how I made my entry point to buy and as well my exit point to sell with the bullish and bearish trend. The trading platform I will be making olhse of is the trading view with the paper trading account and as well using the currency XRP/usdt for my bullish and bearish trend approach.
Bullish Trend Entry: Just as shown in the picture below, we can see that the market is showing bullish I. E the price movement is above the 100EMA indicator, and I as well drew a trend line mark my entry point and you can see that I made my entry when the breakout candle stick closes. Then I took a position to buy 26 unit of the XRP when the market was at $1. 1586, which I then wait for the market movement to determine how long am going to keep taking profit before I made my decision to exit.
Bearish Trend Entry: We all know that bearish trend is when we exit the market in other not to loss our overall investment, so as well as In the bearish trend shown below , I exit the market when the price is below the 100 EMA indicator, then thus made me locate the trend line and as well marked the trendline and easily locate the breakout candle stick that closes the trend which was the position where I choose to sell and exit the market.

It's always interesting to learn something new in this amazing platform, mostly especially trading system - just like the last class we study on Harmonic strategy and here on is something related as Well, And this is opening beginners idea to great ideal of trading methods and strategies that can easily be implemented to carry out a successful trade. I myself have started feeling like a pro already learning several topic on trading methods, Thanks to prof @lenonmc21, this is a very well detailed topic, which have already started ventured into carrying my trade with.
Thank you for following up, I hope I see you next time!!
Cc:
@lenonmc21