![Steemit Crypto Academy [Beginners' Level] (2).png](https://steemitimages.com/640x0/https://cdn.steemitimages.com/DQmXV2d3RePD2FHs5ynq7qeEipsebihGc9DSDWjTk2T3ZKF/Steemit%20Crypto%20Academy%20[Beginners'%20Level]%20(2).png)
Hello Crypto enthusiasts, welcome to the 3rd week of crypto Academy beginners course.
On today's topic, I will be discussing with you on the topic "Perfect Entry” Strategy using Stochastic Oscillator + 200 Simple Moving Average", the course tutored by professor @lenonmc21 where you get to add to your knowledge on Basic Trading Strategy. READ ON!!

1. State in your own words what you understand about the Perfect Entry Strategy (Place at least 2 examples on crypto assets)?

Perfect entries are not hard to understand because they are very simple. If a trader understands the price point where the market has a high chance of reversing despite the trend of the market, he/she will find it easy to make perfect trade entries.
We know, understanding the price direction at a specific period of your time is not enough in trading. The mere knowledge of trend direction alone is risky because it doesn’t determine the successful execution of a trade, so the knowledge of trade entry point/price is needed for a trader to be able to make perfect and accurate entries.
The perfect entry strategy can be achieved with the help of an indicator called stochastic indicator combined with the value action on the chart and the moving average. This can help detect a perfect trade opportunity or entry point.
Three unique components form the perfect entry strategy, and they are;
- The price action is evident by market structure and price harmony at a particular period.
- The 200 moving average indicator helps in filtering the market trend simultaneously with the market structure.
- The stochastic indicator: This shows when the asset is overbought or oversold at a particular period. Helps traders to know when to expect a reversal in the market.
Steps for closing Perfect Entry Strategy
The perfect entry strategy criteria have three components as mentioned above, these criteria are further explained in these steps below.
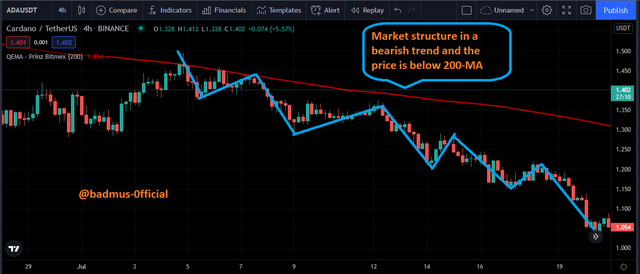
Determining Market Trend: When checking the market for good trade entry strategy/opportunities, the trader has to understand the major trend or bias, and the 200 moving average (200-MA) usually comes into play when doing this. See the screenshot below.
Screenshot from Trading view
The image above is ADA/USDT chart in a 4H timeframe. We used a 200 moving average to determine the trend, noting that when the price is trading above moving average, the market is in a bullish trend and when the price is below moving average, the trend is bearish. In this strategy, trend determination is not based only on 200 MA, the strategy also employed price action inform of market structure and price harmony to determine the market trend. In that case, we can be certain of the current bias as established by both MA and market structure.
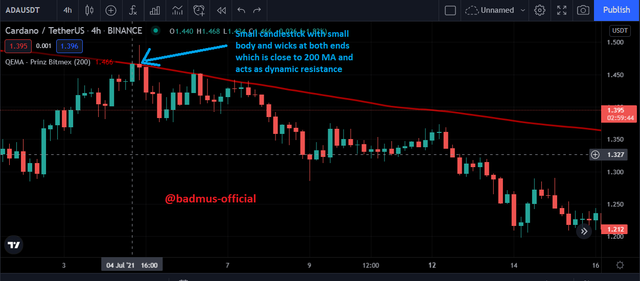
Japanese Candlestick Confluence with 200 MA: After we are done determining the market trend with 200-MA and market structure/trend, the next thing to do is to identify the trigger candle. This trigger candle tells us how valid the perfect entry strategy is. It is a small candlestick with a small body and with wicks or shadows at its top and its bottom. To find this candle, we observe the candlestick that forms every time price approaches the Moving average line. See the image below.
Screenshot from Trading view
The chart above shows the trigger candle at the 200-MA which acts as a dynamic resistance. The market trend then reversed to a bearish trend after that.
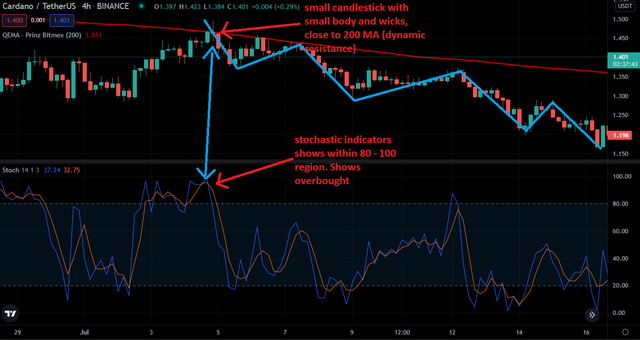
Stochastic Oscillator Signal: This is the step to complete a perfect entry strategy. The signal from this Stochastic Oscillator Signal tool must be similar to that of steps 1 and 2 to get a perfect entry. Using the stochastic oscillator, when the price is in the range 80-100, it means the asset is overbought, but when it is in the range 0-20 it means the asset is oversold. The Stochastic Oscillator works with the price action, 200 MA, and the trigger candle to give a perfect entry point. See the image below.
Screenshot from Trading view

2. Explain in your own words what candlestick pattern we should expect to execute a market entry using the Perfect Entry Strategy.

Candlesticks are very important when determining a perfect entry strategy. After checking price action and studying the 200 MA, we should also lookout for the perfect candlestick called the Trigger candle which is a small candle with body and wicks at both ends.
The Trigger candle with a small body and wicks at both ends approaches the 200 Moving average, and shows rejection, meaning that the price has no intention of going up or down at that point and as such reverse to continue in the direction of the dominant trend usually the opposite.

3. Explain the trading entry and exit criteria for buy and sell positions in any cryptocurrency of your choice (Share your own screenshots

Trading Entry and Exit Criteria for Buy Position.
- To have a perfect entry we must first determine that the conditions 1, 2, and 3 explained above is met and fulfilled.
- If any of the steps 1 to 3 discussed above are not met, we then discard and wait for all conditions to be met.
- For buy position, we must see the clear market trending upward and then diligently find the conditions and make sure they are all met.
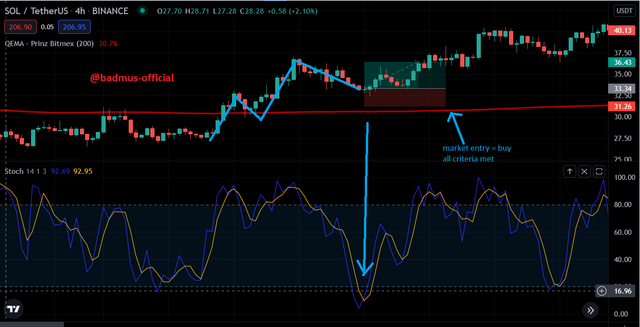
- The stop loss order must be placed just below the small candle and we must take profit immediately stochastic oscillator enter the overbought region, starting from 80 levels.
Screenshot from Trading view
In the chart above, the trend is bullish as the price keeps making higher highs and higher low, and also, the 200MA confirm the current trend. Then the price approaches 200 MA as seen in the image. At this point, the stochastic oscillator was also below 20 level which shows that the asset is oversold. Spotting this, a buy order was placed after the close of the small candle, and a stop-loss order was placed below it and we exit the market when the price approaches 80 stochastic regions.
Trading Entry and Exit Criteria for Sell Position.
- To take a sell position, we must first check all the conditions. If the conditions are all intact then we can now make our entry.
For a sell order, the entry must be at the close of the small candle which is the triggercandle.
The stop loss must be placed immediately above the trigger candle and the exit will be when the stochastic indicator is approaching level 20 which is the oversold region
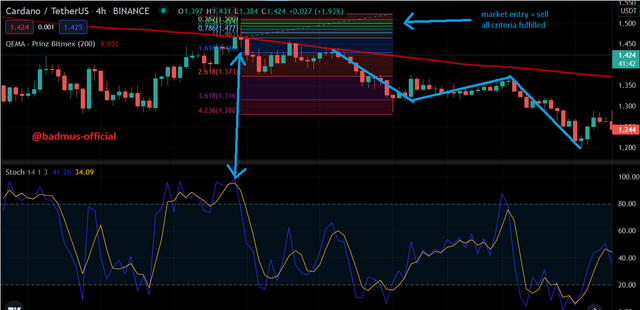
Screenshot from Trading view
From the chart above, we observe that the price keeps creating lower highs and lower lows, and the price is also trading below the 200 MA, which means that the trend is bearish. We then wait for the price to approach the 200 MA as shown in the screenshot. Then, at the approach of 200 MA by price, the stochastic oscillator also gives the signal for sell as it is seen entering the overbought region.Then we make a sell entry at the close of the trigger candle and we placed the stop-loss slightly above the trigger candle. Profit was taken when the stochastic line entered the oversold at 20 stochastic levels.

1. Trade 2 demo account trades using the “Perfect Entry” strategy for both a “Bullish” and “Bearish” scenario. Please use a shorter period of time to execute your entries. Important you must run your entries in a demo account to be properly evaluated.
Buy Position
I will be showing how I made an entry with the strategy for buying position using the EMA 100 combined with stochastic indicator. image below
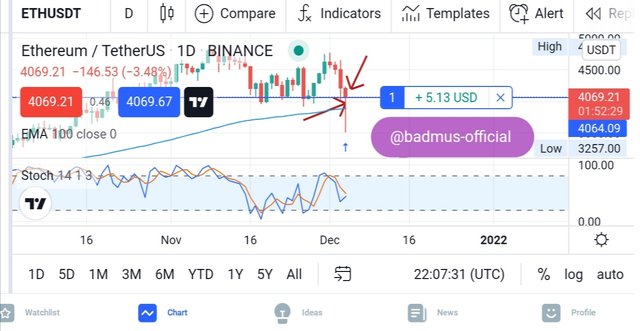
From the image above, you could see how I made my entry to purchase a unit of the ETH as at when the indicator was moving below the market price which thus shows that the market is in bullish and as well the stochastic indicator blue line was moving across the orange, this position is considered best for buy entry position.
Proof of my Trade - Long

Sell Position
I will be showing how I made an entry with the strategy for selling position using the EMA 100 combined with stochastic indicator. image below
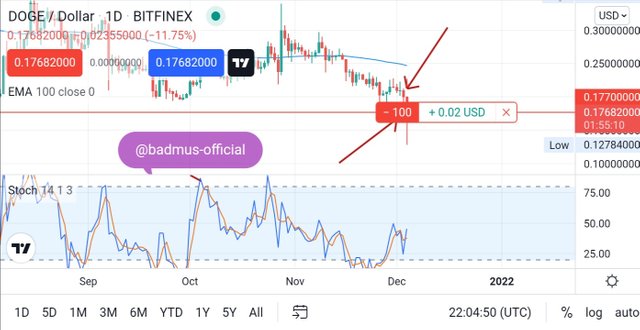
From the image above, you could see how I made my exit to sell a 100 unit of the DOGE coin as at when the EMA indicator was moving above the market price which thus shows that the market is in bearish and as well the stochastic indicator orange line was moving across the blue line, this position is considered best for sell position for exit.
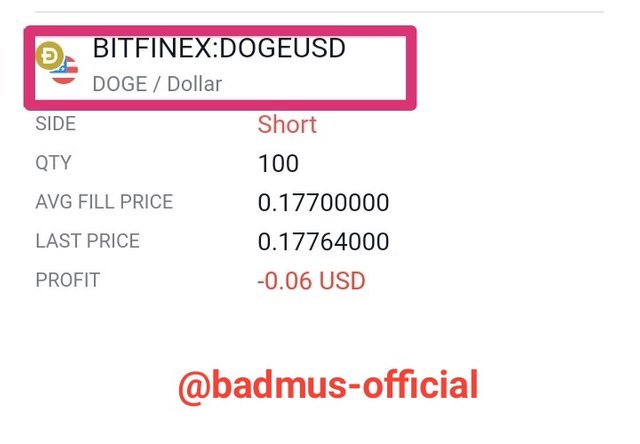
Proof Of My Trade - Short


Here comes the end of the Perfect entry strategy class as I have been able to add to my knowledge on indicators and as well knowing the best position to make entry and make exit into the market.
The stochastic indicators helps in detecting the phase at which the market is currently and as well the Moving average indicator can be utilized so as to make confirmation or predict what position the market will take next.
Thank you all for following through!!, Special regards professor @lenonmc21