
Introduction
To construct a trend following indicator, moving averages smooth the price data. They do not anticipate price direction, but rather describe it, however they lag due to the fact that they are based on prior prices. Moving averages, despite this, aid in smoothing market activity and filtering out noise.
Bollinger Bands, MACD, and the McClellan Oscillator are all built on top of them. Simple Moving Averages (SMA) and Exponential Moving Averages (EMA) are the two most prevalent types of moving averages (EMA). These moving averages can be used to determine the trend's direction as well as establish potential levels of support and resistance
Define in your own words what are simple moving averages and exponential moving averages.
Simple moving Averages
It is a technical indicator that is calculated by dividing a range of values, usually closing prices, by the number of time periods. The simple moving average is frequently used to depict the price trend of a security. If the simple moving average, for example, is trending upwards, it means the price is rising. If a security's price trend is dropping, the opposite is true.
Exponential Moving Average
The most recent data points are given more weight and relevance in an exponential moving average (EMA). The exponential moving average (also known as the exponentially weighted moving average) is a type of moving average that is used to calculate the average of a series of data points.
Explain how simple and exponential moving averages are calculated
Calculation of SMA
It is calculated by summing an asset's price over several time periods and then dividing the total by the number of time periods. The SMA is essentially the average price over a specific time period, with each period's price given equal weighting.
Formula
SMA = sum of all the price of an asset / number of time periods
For example if the price of an asset KLX|PRM for the last 5days is 20.54, 21.78,22.22,24.56,25.97, the calculation for SMA will be;
[20.54+21.78+22.22+24.56+25.97]/5
SMA=115.08/5
SMA=23.016
SMA for asset KLX|PRM is 23.016
Calculation for EMA
The recent market price is added to the previous EMA to calculate the exponential moving average.
For example, EMA = [(price today x weighted average derived from SMA) + (EMA derived from yesterday.)]
We may use this to calculate EMA.
Briefly describe at least 2 ways to use them in our trading operations.
USES
• Recognize the zones of support and resistance. Traders can also use SMA and EMA to determine support and resistance zones. As a result, they may be able to better position themselves for a profitable deal as a result of this.
• Recognize market prejudice. They can also be used to determine an asset's overall market bias over a period of time.
• Determine an asset's trend. When the SMA (Simple Moving Average) and EMA (Exponential Moving Average) meet on a chart, it is known as the Golden Rule, and it might indicate a trend change. Traders frequently combine these two signs to determine the end of a bullish or bearish asset trend.
• A trend line is combined with a moving average. Confluence occurs when the moving average crosses the trend line where the candlesticks meet. In essence, they serve as a point of convergence with a trendline.
What is the difference between simple moving averages and exponential moving averages (Explain in Detail)
| SMA | EMA |
|---|---|
| The SMA (simple moving average) is the average price of an asset over a given time period. | In order to better represent new market data, the exponential moving average (EMA) gives more weight to the most recent prices. |
| Simple moving averages are easy to calculate. It's the same as arithmetic on a standard basis. We can create a simple moving average by adding the closing prices of an asset and dividing them by their numbers. | Exponentiation is a complicated concept. It isn't the same as a moving average. Some traders believe that the simple average is still the most widely used indicator. However, the combination of the two, particularly the golden cross, which denotes a trend reversal or continuation, is quite powerful |
Define and explain in your own words what "Fibonacci Retracements" are and what their gold ratios are?
Fibonacci Retracements
They are horizontal lines that show potential areas of support and resistance. Fibonacci numbers are used to create them. A percentage is assigned to each level. The retracement percentage shows how much of a previous move has been retraced. The Fibonacci retracement levels are 23.6%, 38.2%, 61.8 %, and 78.6 %.
The Fibonacci sequence can be found all across the world. As a result, many traders believe these figures are also relevant in the financial markets.
The indicator is of importance since it can be drawn between any two major price points, such as a high and a low. The indicator will then generate levels between those two positions.
There are no formulas for Fibonacci retracement levels. The user selects two points when these indicators are applied to a chart. The lines are drawn at percentages of that move once those two points have been chosen.
The origin of the Fibonacci numbers are interesting. They depend on a Golden Ratio, a mathematical formula which starts with zero and one in other to start a number sequence. Then add the two previous numbers together to form the following number string:
• 0,1,1,2,3,5,8,13,21,34,55,89,144...............
The number string above forms the source of all Fibonacci retracement levels. When you Divide one number by the next number it provides 0.618, or 61.8%, The result of dividing an integer by the second number to its right is 0.382, or 38.2%. Except for 50 percent (which isn't a legitimate Fibonacci number), all of the ratios are based on a mathematical formula employing this number string
Having stated that, fibonacci retracement has a golden ratio. The golden ratio is 0.618, which is calculated by multiplying one fibonacci number by the next. That is, 34/55.
Importance
• Fibonacci retracements can be used to set price goals, place entry orders, and determine stop-loss levels.
• Fibonacci levels can also be found in various methods in technical analysis. Gartley patterns and Elliott Wave theory, for example, both use them frequently. Reversals are more likely to occur at Fibonacci levels after a major price movement up or down, according to this form of technical analysis.
• Fibonacci retracement levels are non-moving prices. Because of the consistency of pricing levels, they can be identified quickly and clearly.
Practice (Only Use your own images)
It shows step by step how to add a "Simple and Exponential Moving Average" to the graph (Only your own screenshots - Nothing taken from the Web).
- i visited tradeview
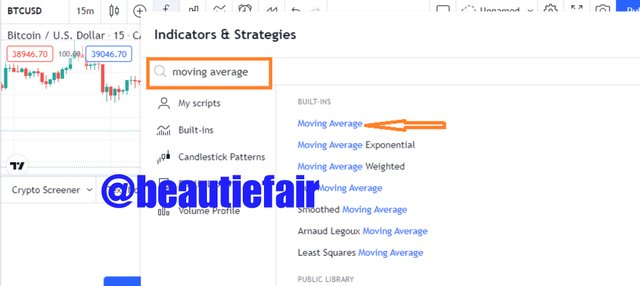
- on the home page i clicked on chart

- i clicked on indicator

- A page popped up where i inserted moving average, and then i clicked on it so that simple moving average can be added to the chart.
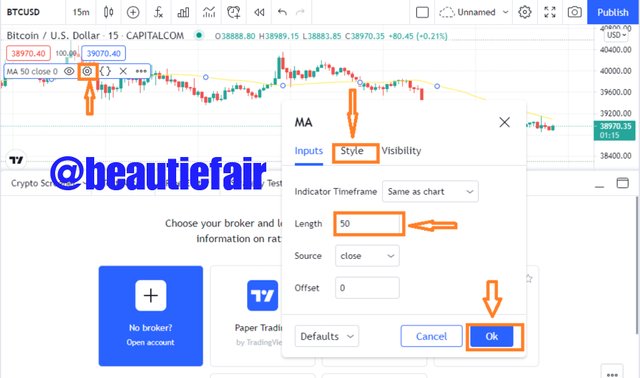
- i went back to the chart,clicked on settings to add 50-days Simple moving average since it comes with a default of 9-days. I also clicked on style to change colour of the chart line. Then i clicked Ok.
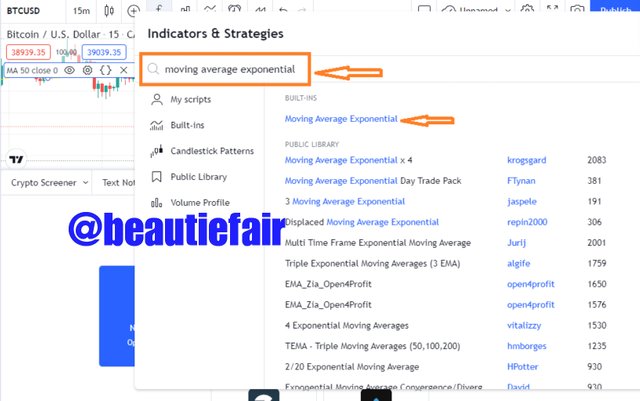
To add Exponential moving Average,
- from the homepage as described above, after clicking on chart, click on indicator and search for Moving average Exponential, and click on it.
- There will be SMA and EMA on the chart, to set the EMA to 200 i will click on setting on the EMA Chart, and add 200,then click OK. I click on style to change line colour.
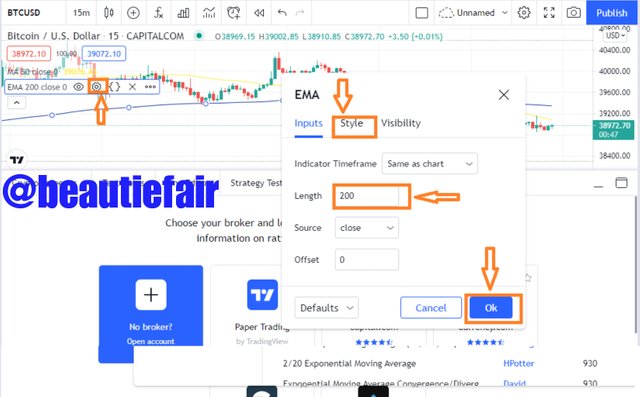
- Both indicators are seen in the chart below.

Use "Fibonacci Retracements" to chart a bullish and bearish move (Own screenshots only - Nothing taken from the web).
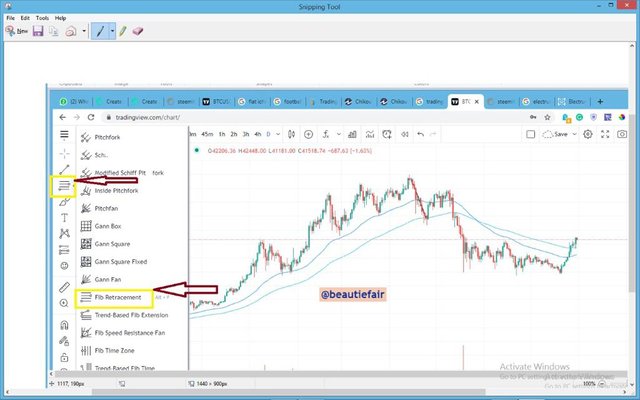
- i clicked on fib retracement in other to add Fibonacci Retracement,as seen below.
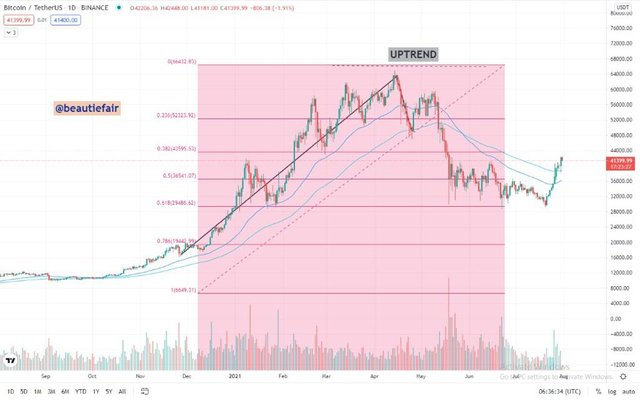
- For an uptrend,i will draw a slope from the swing low to a swing high for the move i want to get retracement for.
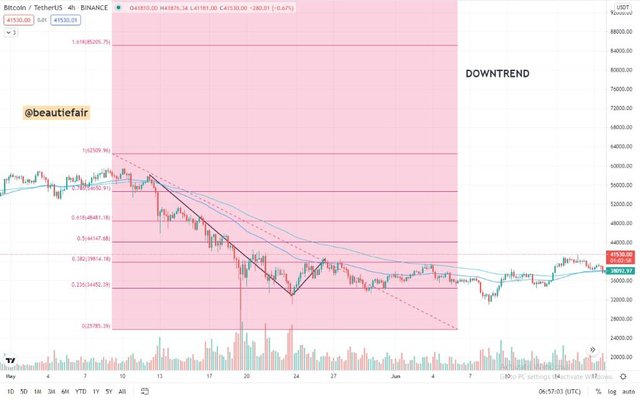
- for a downtrend, i will draw the slope from the swing high to the swing low for the move i want retracement for.
Conclusion
Each trader must determine which Moving Averages are most appropriate for his or her technique. Exponential Moving Averages are popular among shorter-term traders because they want to be notified as soon as the price moves in the opposite direction.
Longer-term investors like to use Simple Moving Averages since they aren't in a hurry to respond and prefer to be less active in their transactions. It's all a matter of personal preference.
cc;
@lenonmc21