Introduction
Resistance and Support areas in a price chart are characterized by the reaction of market participants (buyers and sellers) around those areas (prices). This is evident as the market tends to respect the laws of supply and demand, to maintain a balanced market.
Traditionally, resistance and support areas are identified as horizontal areas that price reacts to (either bounce or reject), correlating with the market sentiment.
But the movement of price in a price chart is represented in a waveform, creating swing points (significantly higher or lower) depending on the type of move (upward or downward), this creates a type of resistance and support level that follows price movement diagonally called dynamic support and resistance levels and its represented with trendlines, moving averages, etc.
Dynamic support and resistance areas indicate areas that price reacts to as it moves in a specified direction, showing momentum and potential areas price might respect.
The dynamic resistance and support tool I will be explaining is the exponential moving averages EMA
Exponential moving averages
The EMA is a type moving average indicator that is measured from the most recent price movement data within a specified interval. This tool helps crypto traders to easily identify entry and exit points in the market.
Dynamic Resistance using EMA
The EMA dynamic resistance is associated with the downward movement of price, indicating areas that price reacts to (reject) before continuing downward, this is evident as the EMA follows the movement of price closely.
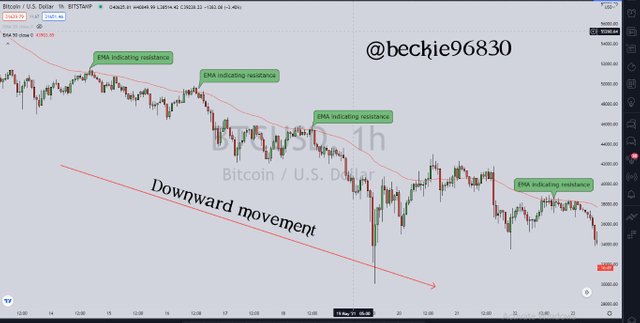
The Bitcoin chart (BTC/USD) above shows how the EMA acts as a dynamic resistance by following the movement of price downwards closely.
Dynamic Support using EMA
The EMA dynamic support is associated with the upward movement of price, indicating areas that price reacts to (bounce) before continuing upwards, this is evident as the EMA follows the price movement closely.
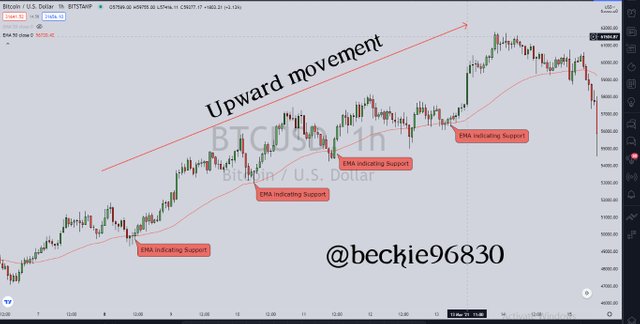
The Bitcoin chart (BTC/USD) above shows how the EMA acts as dynamic support by following the movement of price upwards closely.

Question 2
Make a combination of Two different EMAs other than 50 and 100 and show them on Crypto charts as Support and Resistance
Source
The combination of 2 EMAs helps investors identify stronger levels of support and resistance, this is done by combining EMAs with different periods respectively.
Price respecting the 2 EMA levels indicates that the level is strong, thus confirming a potential trade setup when the technicals align.
for this demonstration, I will be combining 2 EMAs with 20 and 50 periods respectively.
20 and 50 EMA as Dynamic Resistance
The combination of the 20 and 50 periods EMAs as a dynamic resistance indicates stronger levels of resistance in a downtrend movement if the 2 EMAs were tested and respected.
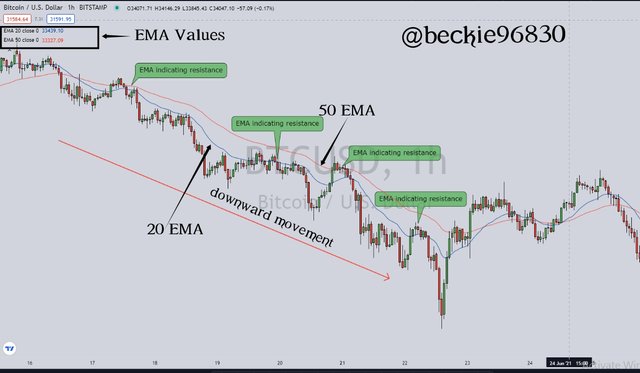
The above image highlights areas where both the 20 and the 50 periods EMAs were respected showing dynamic resistance following price closely.
20 and 50 EMA as Dynamic Support
The combination of the 20 and 50 periods EMAs as dynamic support indicates stronger levels of support in an uptrend movement if the 2 EMAs were tested and respected.
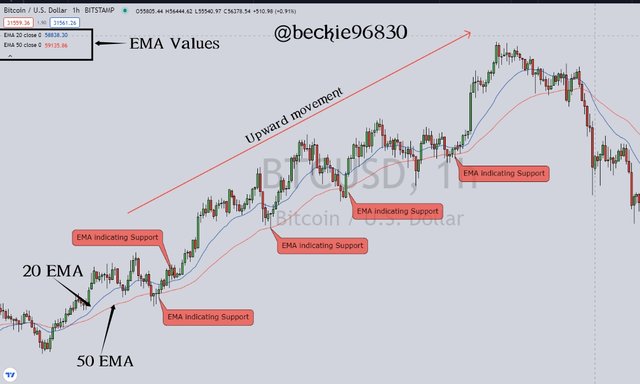
The above image highlights areas where both the 20 and the 50 periods EMAs were respected showing the dynamic support following price movement closely.

Question 3
Explain Trade Entry and Exit Criteria for both Buy and Sell Positions using dynamic support and resistance on any Crypto Asset using any time frame of your choice
Source
It is important to note that using the EMA as dynamic support and resistance tool for entry and exit of trades can only work in a trending market condition. A sideways market condition using the EMA tool will show intertwined EMA indicating that price is fluctuating within a zone.
Trade Entry Criteria
Entry Criteria for a Buy position
Using the EMA to enter a buy position requires that some conditions have to be satisfied, they include:
a) First is to add the 20 and 50 EMA.
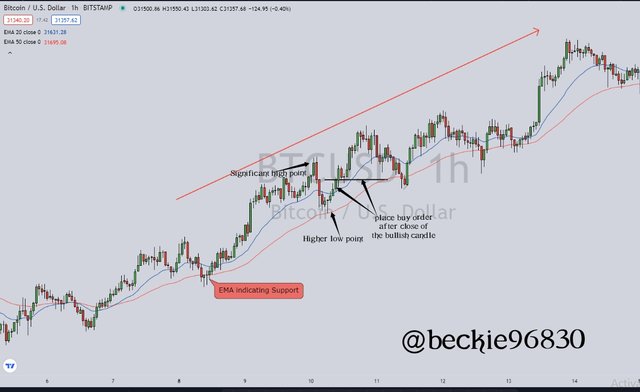
b) observe the market structure, if the price has formed a significant high point and higher low and the price should be above the 20 and 50 EMAs.
c) wait for the price to touch the 20 or 50 EMA, to verify if the dynamic support will hold price.
d) If the price reacts to the dynamic support and bounces from it by forming bullish candles, wait for a close of at least two bullish candles above the 20 and 50 EMA.
e) After the close of the bullish candles, above the 20 and 50 EMA, execute on the next candles.
Entry criteria for a sell position
Using the EMA to enter a sell position requires that some conditions have to be satisfied, they include:
a) First is to add the 20 and 50 EMA.
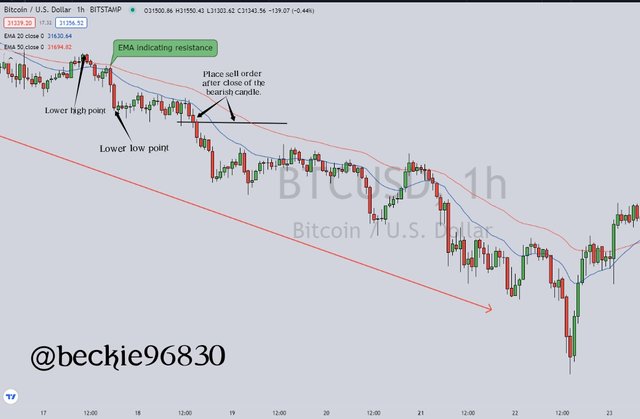
b) observe the market structure, if the price has formed a significant Lower high and lower low and the price should be below the 20 and 50 EMAs.
c) wait for the price to touch the 20 or 50 EMA, to verify if the dynamic resistance will hold the price.
d) If the price reacts to the dynamic resistance and rejects it by forming bearish candles, wait for a close of at least two bearish candles below the 20 and 50 EMA.
d) After the close of the bearish candles, below the 20 and 50 EMA, execute on the next candles.
Trade Exit Criteria
A trade can be exited in profit or loss. It's recommended to set both take profit and Stoploss prices.
Exit Criteria for a buy position
Exiting buy position in profit
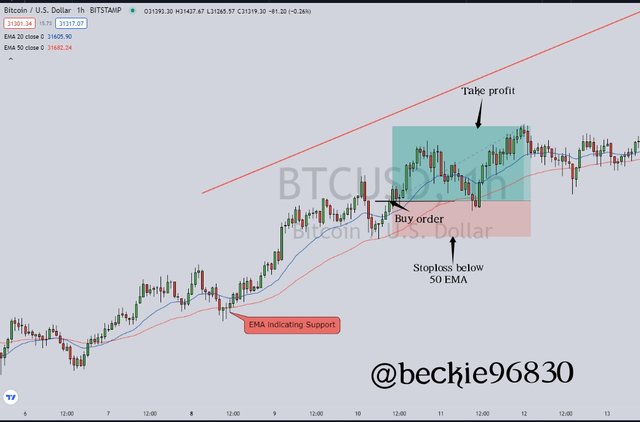
The overall goal of trading is to make a profit, this can be achieved by setting a take profit target price. The take profit price should be above the market price and the EMA, in line with the previous market structure point.
The least risk to reward should be 1:1, thus if an investor risks $100, they aim to make at least $100 in gain. Once the take profit price is triggered, the trade closes and adds the profit to the asset balance.
Exiting buy position in loss
A Stoploss price should be set below the market price and 50 EMA, this prevents further loss in situations the trade setup goes in the opposite direction. This serves as a safety net to an investor's account.
The Maximum risk to reward should be 1:1, this prevent an investors from losing more that planned profit target. A negative Risk to reward is bad for account growth.
Exit Criteria for a sell position
Exiting sell position in profit
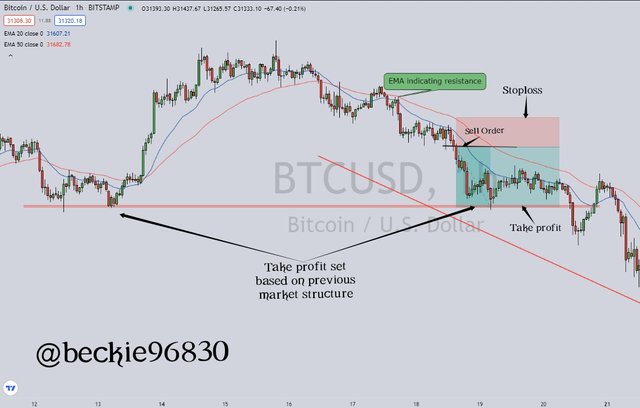
The take-profit price should be below the market price and the EMA, in line with the previous market structure point.
The least risk to reward should be 1:1, thus if an investor risks $100, they aim to make at least $100 in gain. Once the take profit price is triggered, the trade closes and adds the profit to the asset balance.
Exiting sell position in loss
A Stoploss price should be set above the market price and 50 EMA, this prevents further loss in situations the trade setup goes in the opposite direction. This serves as a safety net to an investor's account.
The Maximum risk to reward should be 1:1, this prevent an investors from losing more than the planned profit target. A negative Risk to reward is bad for account growth.

Question 4
Place 2 demo trades on crypto assets using Dynamic Support and Resistance strategy. You can use a lower timeframe for these demo trades
2 Demo Trades Using EMA
Trades were execute on Metatrader4 mobile app:
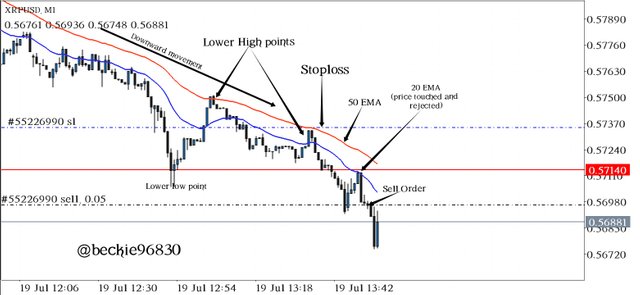
Trade 1 - XRPUSD 1 minute Chart
On the chart below, the price touched the 20 EMA and rejected it with the formation of multiple bearish candles.
I executed the sell order after the price moved away from the 20 period EMA. Stoploss price was set above the 50 period EMA in a ratio of 1:2.
please note: the take profit price is below and can not be viewed because it is a 1minute chart.
Trade 2 - BTCUSD 1 minute Chart
On the chart below, the price touched both 20 and 50 EMA and rejected it with the formation of multiple bearish candles.
I executed the sell order after the price moved away from the 20 period EMA. Stoploss price was set above the 50 period EMA in a ratio of 1:3.
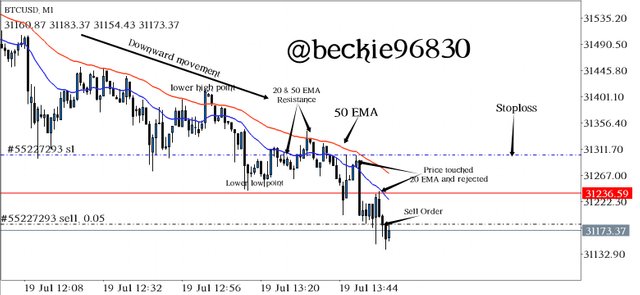
please note: the take profit price is below and can not be viewed because it is a 1minute chart.

Conclusion
The concept of dynamic support and resistance using exponential moving averages is an essential strategy in trading, it provides multiple trading opportunities indicating entry and exit points.
The entry and exit criteria of the EMA strategy should be carefully observed in line with the market structure to avoid fakeout, resulting in loss of funds.
The 20 and 50 EMA are used for shorter period trading like scalping and Intra-day, unlike the 50 and 100 EMA used by professor @cryptokraze. This tool can be used across all timeframes depending on the trading system and the type of trader.
In general, the dynamic support and resistance strategy using EMA is a good trading system with low risk (when used on Lower timeframes).
Thank you professor @cryptokraze for this opportunity to learn about this system.
Nice Explanation from you. I really learn a lot from this your Homework post. Thanks for sharing us.
#affable #india
Downvoting a post can decrease pending rewards and make it less visible. Common reasons:
Submit
Thank you for reading @lavanyalakshman
Downvoting a post can decrease pending rewards and make it less visible. Common reasons:
Submit
You are too fast to submit these home works 😅
Downvoting a post can decrease pending rewards and make it less visible. Common reasons:
Submit
Dear @beckie96830
Thank you for participating in Steemit Crypto Academy Season 03 and making efforts to complete the homework task. You got 9.5/10 Grade Points according to the following Scale;
Key Notes:
*.You have shown good understanding of the strategy by making precise charts for different elements of the strategy.
We appreciate your efforts in Crypto academy and look forward for your next homework tasks.
Regards
@cryptokraze
Downvoting a post can decrease pending rewards and make it less visible. Common reasons:
Submit
Thank you professor @cryptokraze
Downvoting a post can decrease pending rewards and make it less visible. Common reasons:
Submit