Question 1
In your own words explain the vortex indicator and how it is calculated
Vortex Indicator
The Vortex Indicator is a trend indicator used in technical analysis by investors to spot changes in the trends of market price movement. Vortex was introduced in 2010 by Etienne Botes and Douglas Slepman, who developed the indicator based on the True Range concept created by J. Welles Wilder. The indicator was initially used mostly in the analysis and trading of stock markets, but in recent years, investors within the crypto ecosystem have adopted the indicator for analysis and trading.
The vortex indicator is comprised of two lines, the +VI and the -VI.
The +VI, which indicates the presence of buyers in a market, and is characterized by the up movement of price, and the -VI which indicates the presence of sellers in a market, and is characterized by the downward movement of price. The vortex indicator generates trade signals when the +VI and the -VI lines cross each other.
Ideally, when the +VI line ** crosses** the -VI line, it generates a Buy trade signal for investors that use the vortex indicator. In contrast to this, when the -VI line crosses the +VI line, it generates a Sell trade signal for the investors that use the indicators.
How the Vortex line are plotted
The +VI line and -VI line are plotted in direct proportion to the period highs and lows created from price movements. The +VI is plotted from the difference of the current period high and the previous period low, which gives a positive value that pushes the +VI line upward.
The -VI line is plotted from the difference of the current period low and the previous period high, which gives a negative value that pushes the -VI line downward.
The strength of the trend is represented by the indicator with a widening space between the +VI line and the -VI, similar to other line trend indicators like the CCI and RSI.
How Vortex Indicator is calculated
The calculation of the vortex indicator movement is dependent on the trend, and the period used. The computation is done using the True Range concept, where the difference between the current highs, lows, and the previous close determine the vortex line that moves.
The period set on the indicator is the number sample size to be considered in the calculation, usually dependent on the timeframe used. A daily timeframe that the vortex indicator has a period of 30, calculates the True range using a 30 days sample size. Similarly, a 30 minutes timeframe that has a vortex indicator with a period of 30, calculates the True range using a 30 sample size calculated 30 minutes candles.
Investors can twerk the period settings of the indicator to suit their trading strategy and system. The vortex indicator works well in trending markets but requires additional experience to use it in a range-bound market.
The Vortex indicator should be combined with price action and other technical indicators to reduce the false generation of signals

Question 2
Is the vortex indicator reliable? Explain
Vortex indicator reliability
No weighted technical indicator should be relied on as the sole source of trading signals. This is because technical indicators are plotted after periodic price closings, this factors in a lag constraint and fluctuation. These factors are represented in the indicator's movement.
Also the unpredictable nature of the market that results from external factors like fundamental analysis that influence price movement can generate false readings on indicators.
The vortex indicator is a good technical indicator, no doubt, but it should be used with other indicators to filter false signals. This can be done by combining 2 to 3 price movement indicators like price action, RSI, MACD, Divergence, etc. to develop a rounded confluence-based sentiment about the direction of price movement.

Question 3
How is the vortex indicator added to a chart and what are the recommended parameters
Adding Vortex indicators to a chart
To add the vortex indicator to a price chart, use any free price chart software like MetaTrader 4, MetaTrader 5, Tradingview, Ctrader, to access the indicator. In my case, I will demonstrate the process using the tradingview platform.
First visit Tradingview's official Website and click on Charts
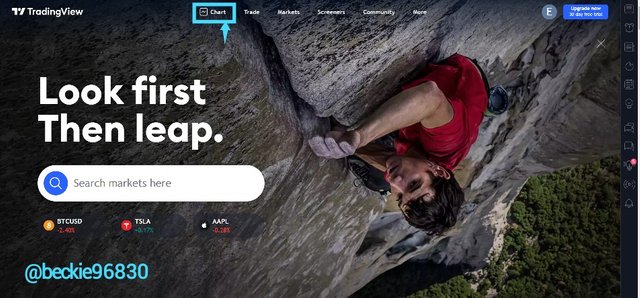
The chart section will be displayed. On the top menu tabs, Click on Indicators
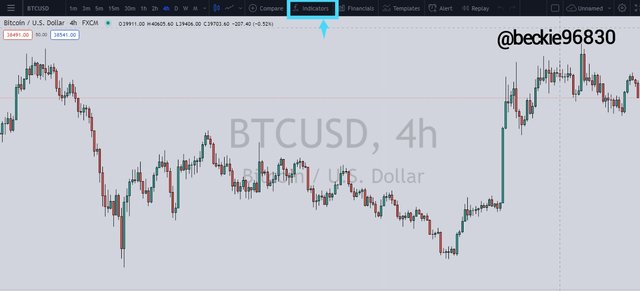
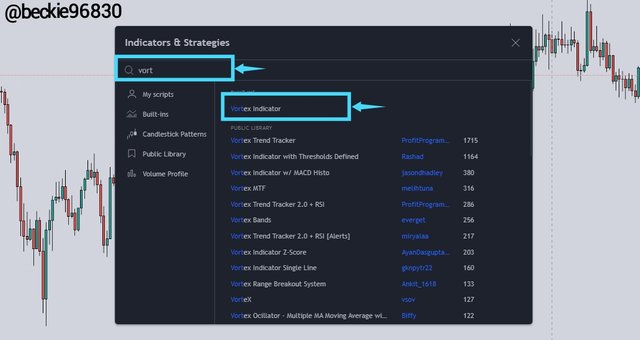
The indicator menu will be displayed. Search for the vortex indicator using any related keyword like vortex indicator, vortex, vort, etc.
Click on the search result vortex indicators to add the indicator to the charts.
The indicator will be added to the price chart with the default settings of period 14 and color scheme of red for -VI and blue +VI
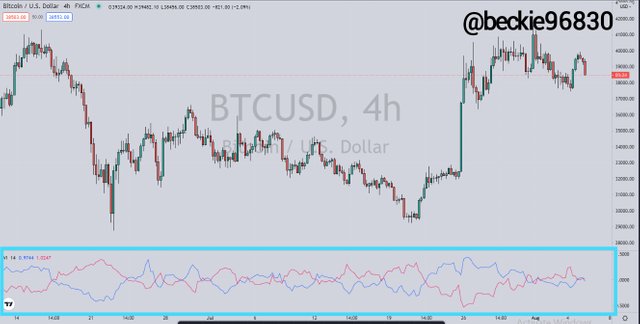
Default Settings
To view the recommended indicator settings, move to the bottom section of the screen where the indicator is seen, hover over the indicator value and Click on the Settings Icon

The indicator settings menu will be displayed, showing the inputs tab, style tab, and visibility tab.
Input Tab
On the input tab the period of the indicator can be changed, this is represented with the length option. The recommended length is 14 i.e the True Range calculation will be done using 14 sample sizes.
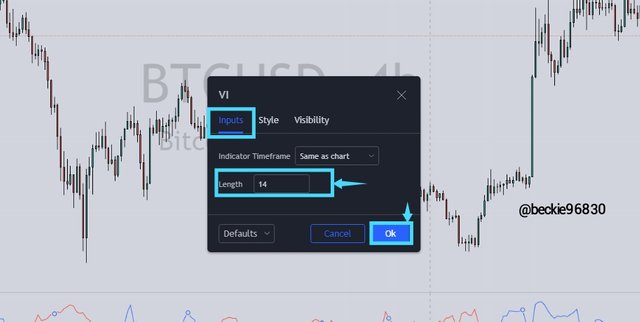
Changing the indicator period is advised, in other to get optimal results using the indicator depending on your trading system.
Style Tab
On the Style Tab the color scheme of the indicator can be changed. This depends on the investor's color choice. The recommended color scheme is Blue for the +VI, and Red for the -VI.
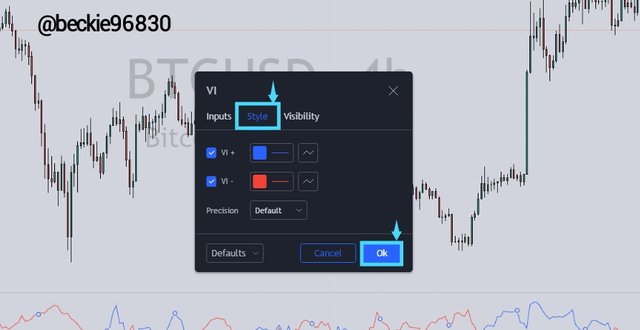
Visibility Tab
On the Visibility Tab, the various timeframe the indicators should appear on can be set. The recommended setting checked time-frames.
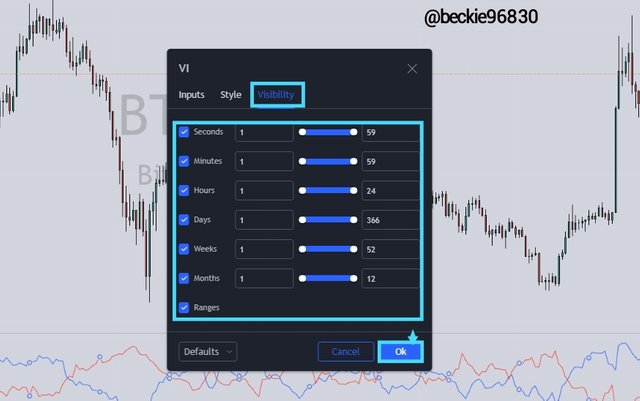

Question 4
Explain in your own words the concept of vortex indicator divergence with examples.
Vortex Divergence
The term divergence in trading is a form of confluence used between price action and trend indicators that indicates a directional bias when there is a contrast indication in the movement of price represented on a price chart and the indicator used.
There are two forms of vortex indicator divergence. They include:
Bullish Vortex Divergence
This type of divergence occurs when the price movement indicates a declining movement, but the indicator shows an upward movement. This often signifies potential trend change that price movement might follow.
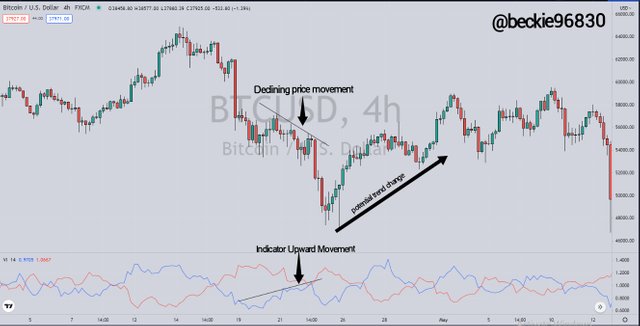
Bearish Vortex Divergence
The bearish divergence occurs when the price movement indicates a bullish move, but the vortex trend indicator shows a downward movement. Similarly, it signifies a potential trend change that price might respect.
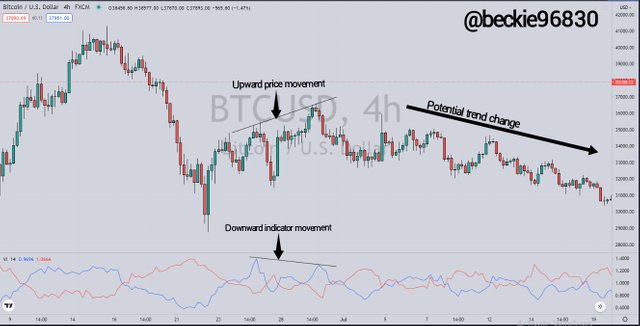
The divergence strategy is considered a good price reversal signal, with price movement following the divergence created by the indicators.
Regardless of these observed facts, the investors should always use price action in confluence with the divergence signal to improve their trading experience.

Question 5
Use the signals of VI to buy and sell any two cryptocurrencies.
Buy Signal using Vortex Indicator
For this trade demonstration, I used tradingview's paper trading account.

Asset 1 -EOS/USD 3 Minute Chart using Divergence
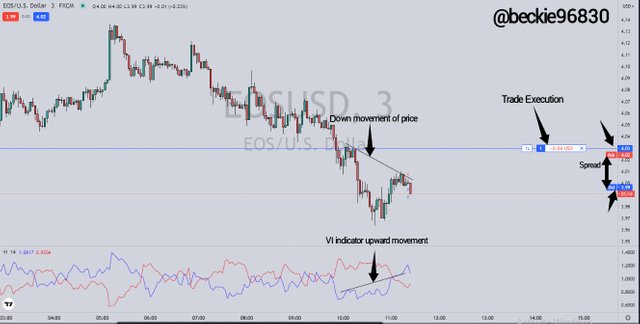
In the chart above, price the movement of price was bearish, but the vortex indicator shows a bullish divergence. As explained by professor @asaj, the bullish divergence should be considered a buy signal.
The reason for the huge gap between price action and trade Execution is because of the spread between the ask and bid price.
I executed a trade order on based on this indicator generated signal.

Sell Signal using Vortex Indicator
For this trade demonstration, I used tradingview's paper trading account.
Asset 2- ETH/USD Hourly chart using -VI line cross
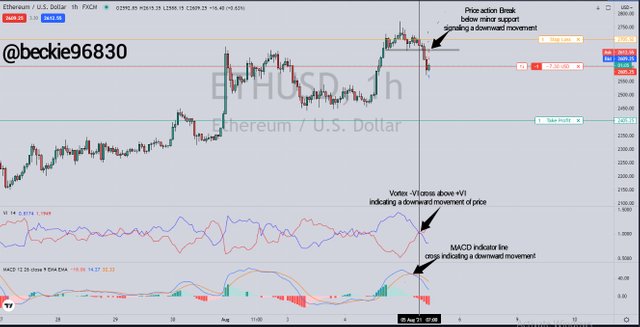
In the above, the vortex indicator generated a bearish signal with the cross of -VI line above the +VI. To build more confluence, I used price action and added the MACD indicator. As seen above, price action hinted at a price move with price breaking and closing below a support level. The MACD Indicator added an extra layer of confluence to the trading sentiment.
Ongoing Trades

The above image shows the open demo positions on EOSUSD and ETHUSD.

Conclusion
Vortex indicator is a good technical indicator that shows the change in the movement of price with the +VI and -VI line, each representing buyers and sellers interaction in a market respectively, generating buy and sell signals with the cross above each other.
In general, technical indicators should be used with other indicators like RSI, MACD Moving averages for optimal trading experience.
Thank you professor @asaj for this insightful lesson.
Superb performance @beckie96830!
Thanks for performing the above task in the sixth week of Steemit Crypto Academy Season 3. The time and effort put into this work is appreciated. Hence, you have scored 8 out of 10. Here are the details:
Remarks
You have demonstrated a clear understanding of the topic and have completed the tasks. Thanks for sharing your work with us.
Downvoting a post can decrease pending rewards and make it less visible. Common reasons:
Submit
Thank you professor @asaj
Downvoting a post can decrease pending rewards and make it less visible. Common reasons:
Submit