
Theory (No Images)
Question 1
Define in your own words what is the Stochastic Oscillator?
Stochastic oscillator
Stochastic oscillator is a trend momentum indicator used in technical analysis, which is comprised of two moving average lines (the %K line and the %D line), that calculates the volatility rate in the movement of price of traded assets within a period, through comparison of the current closing price with the range of price period used. The indicator was developed by George Lane, who was a financial analyst in the 1950s.
The Stochastic Oscillator generates trade signals in the form of overbought and oversold conditions scaled on a range of numbers between 0 - 100. The Overbought condition indicates that bullish movement of price has been overextended and a possible reversal can occur, similarly the Oversold condition indicates that the bearish movement of price has been overextended and a possible bullish reversal can occur.
The responsiveness of this indicator to price comparison between the closing price and a range of price depends on the period length set. Different types of investors can choose different period length settings to suit their trading systems to generate viable trade signals.

Question 2
Explain and define all components of the stochastic oscillator (% k line,% D line + overbought and oversold limits).
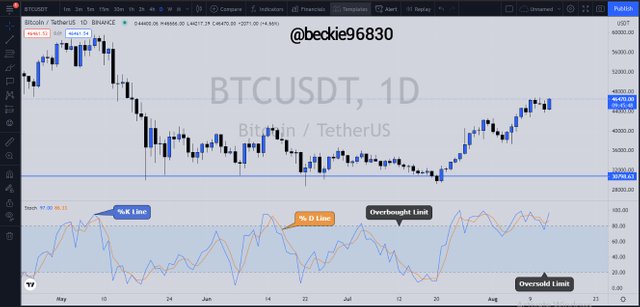
The %K Line
The %K line is one of the lines that form the Stochastic Oscillator, %K line is the faster line of the indicator that generates a trade signal through its cross of the slower line %D. The %K line measure the momentum of price movement by comparing the current closing price to the lowest low of the period length selected, and also the highest high price to the lowest low price of the period.
i.e:
%K Line = [(Current close - lowest low price); (Highest high price - Lowest low price)]
The highest high price, lowest low price is selected within a period length set on the indicator.
%D Line
The %D line is other line that forms the complete stochastic Oscillator. The %D is considered the slower line that incorporates the calculation of the %K line to derive its value. %D line generates trades signals through its crossing above or below the %K line. The derived value of %D is:
%D = 3 Day Simple moving average of %K
Overbought Limit
The overbought limit of the stochastic oscillator is the upper bound line that has indicates that the momentum of price upwards has been overextended. The upper bound line starts from the scale bound of 80 -100. When price is trading above this bound line, a bearish reversal is anticipated.
Oversold Limit
The oversold limit is the lower bound of the Stochastic oscillator, which indicates that the downward movement of price is overextended. The oversold limit is from 0-20 on the scale bound values. Similarly, when price trades with the lower bound, a bullish reversal is anticipated.

Question 3
Briefly describe at least 2 ways to use the Stochastic Oscillator in a trade.
The stochastic oscillator can be used in some of the following ways:
1- Generating trade signals
The stochastic oscillator lines (%K and %D) are used by investors to generate trade signals. This occurs when the %K crosses above the slower %D line, it is considered a bullish trade signal. Likewise, when the %D line crosses above the faster %K line it is considered a bearish trade signal.
2- Spotting Trend Reversal
The overbought and oversold bounds of the stochastic oscillator are used by investors to spot potential trend reversal in a traded market. A bullish trend reversal can occur when price is trading within the oversold limit bound which is between 0-20 on the stochastic oscillator scale bound. Similarly, a bearish trend reversal can occur when price is trading above the overbought limit bound which is between 80-100 on the stochastic oscillator scale bound.

Question 4
Define in your own words what is Parabolic Sar?
Parabolic Stop and Reverse
The parabolic SAR is a near-complete indicator used by investors in technical analysis that indicates the directional bias of a market, the entry and exit points, and the possible change in direction of price movement within a given timeframe. The Parabolic SAR was developed by J. Welles Wilder Jr. Who also created other technical indicators like ADX, and RSI.
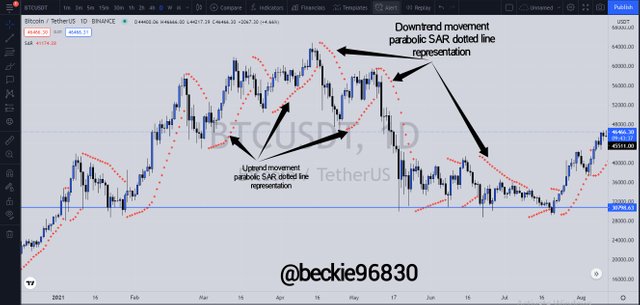
The parabolic SAR is represented on a price chart as dotted lines that appears above or below price candles. The Parabolic SAR represent trending market condition as such: when the dotted lines appear above the price movement, it indicates that the sellers are in control of the market, similarly, when the dotted lines appear below price movements, it indicates that buyers are in control of market price movement.
The parabolic SAR also indicates trend reversal through discontinuation of the dotted lines in one direction and continuation in the other direction. For instance, A bullish trend reversal can be represented by the discontinuation of the parabolic SAR dotted lines above price movement and continuation below price movements.
The parabolic SAR is similar to the moving average lines but it reacts quicker to price movement data, this makes the parabolic SAR represent random fluctuations in price movement. The Parabolic SAR should be used with other technical indicators to further refine the generated trade signals.

Question 5
Explain in detail what the price must do for the Parabolic Sar to change from bullish to bearish direction and vice versa.
Bullish Reversal PSAR
As explained earlier, the Parabolic SAR represents price movement with a dotted line on a price. For a bullish trend reversal (downtrend to uptrend), The dotted line will first appear above price movement indicating that sellers are in control of price, the dotted line must appear below price, to indicate the trend reversal in price movement, i.e Buyers are in control of price movement.
Bearish Reversal PSAR
For a bearish trend reversal (i.e bullish to bearish), the Parabolic SAR dotted line with first appear below price movement, indicating that buyers are in control of market price, For a reversal, the parabolic dotted lines must appear above price movement, which indicates the bearish trend reversal, i.e sellers are in control of price movement.

Question 6
Briefly describe at least 2 ways to use Parabolic Sar in a trade?
1- Trend Reversal
The parabolic SAR indicates early trend reversal through the placement of the dotted lines above or below the price movement candles in a price chart. This helps investors spot early reversal when the first dot appears.
2- Trend identification
The parabolic SAR indicates the direction of the market with the dotted line placed either above or below the price of an asset. This helps investors clearly identify the current side in control of price.
3- Entry and Exit points in trades
The parabolic SAR also indicates the entry and exit points of a given trade. The first sign of reversal is considered a trade exit indication. For example, an investor in a buy trade will exit the buy position once the parabolic SAR dotted line moves from below price to appear above the price of the asset. This shows that the sellers are taking control of the market.

Practice (Only Use your own images)
Question 1
show a step by step on how to add the Stochastic Oscillator to the chart (Indicating the% k Line and the% D Line, the overbought and oversold zone.
Adding Stochastic Oscillator
To add the stochastic oscillator, visit any price chart platform that supports the use of indicators. In my case, I will demonstrate with tradingview.
First, visit tradingview's official website and click on chart

The chart section will be displayed, Next Click on Indicators and search for the stochastic oscillator using any related keywords like Stochastic, stoc, etc.
Click on the indicator name in the search result to add it to the chart and close the search menu
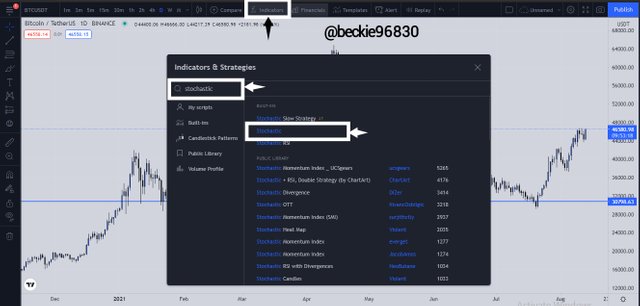
The indicator will be added to the chart.
The stochastic oscillator as described is comprised of 2 moving average lines, %K line and %D line.
It also has a bound scale limit, which is between 0-100, that shows overbought which is the limit between 80-100 and oversold which is the limit between 0-20 market conditions.

Question 2
Show step by step how to add Parabolic Sar to the chart and how it looks in an uptrend and in a downtrend.
Adding Parabolic SAR
On the chart section of tradingview.com click on indicators and search for parabolic SAR using relevant keywords like parabolic, parabolic SAR etc.
Click on the Indicator name to add the indicator to the chart and close the search menu
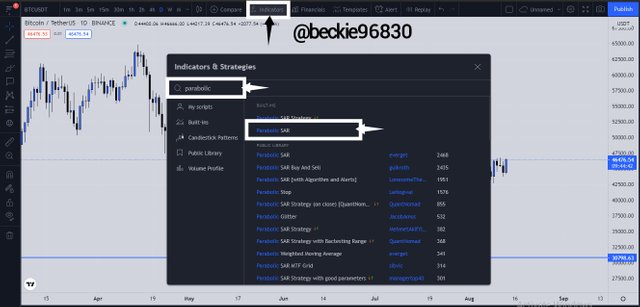
The parabolic SAR dotted lines will be added to the chart, representing uptrend movements and downtrend movements by appearing below and above price movements respectively.

Question 3
Add the two indicators (Stochastic Oscillator + Parabolic Sar) and simulate a trade in the same trading view, on how a trade would be taken.
Buy Trade situation
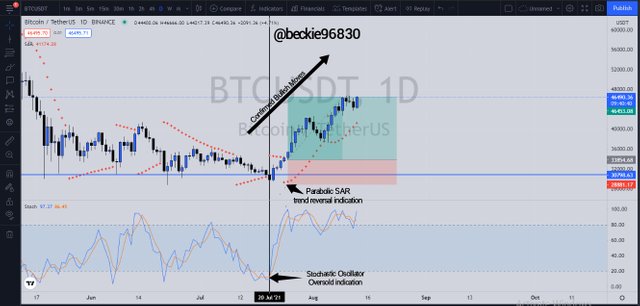
From the chart simulation above, the Stochastic Oscillator indicated that the price was in an oversold condition, blow the oversold limit line. The %K line crossed above the %D Line indicating a change in direction of the trend.
The parabolic SAR indicated the presence of buyers when the first dotted line appeared below price movement.
Lastly, price action also revealed that buyers are in control, with the formation of a bullish engulfing candle at an area of support. The trend change was confirmed.
Sell Trade Situation
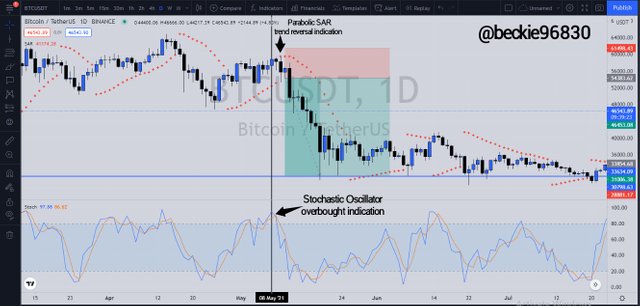
In the chart simulation above, the stochastic oscillator indicated that the price was trading in an overbought condition, above the overbought limit line. The cross of the %D Line above the % K line indicated a possible change in trend direction.
The parabolic SAR indicated the presence of sellers when the first dotted line appeared above price movement.
Price action also confirmed the presence of sellers with the formation of bearish reversal candlestick patterns at the top of an uptrend.

Conclusion
The stochastic oscillator is an easy, simple price momentum tracking indicator, that also generates trade signals. It works well when combined with other indicators to optimize the quality of the trade setup.
Similarly, the parabolic SAR indicator is a good and easy-to-use indicator that shows the direction of the market, generates trade signals, and shows possible entry and exit areas of a given trade.
Combining the stochastic oscillator and the parabolic SAR forms a simple mechanical trading system that works just fine in trending market conditions. Both indicators shoulder be used with price action to optimize trade setups.
Thank you professor @lenonmc21 for this insightful lesson.