
Question 1
Graphically, explain the difference between Weak and Strong Levels. (Screenshots required) Explain what happens in the market for these differences to occur.
Strong levels of Resistance and Support
A strong level of resistance and support is a price level that strong opposite directional pressure is encountered, causing rapid rejection in price movement within those levels. The opposite directional pressure can be in form of accumulated buy or sell pending order set at the levels of Resistance and support, which generates liquidity, resulting in rapid movement of price.
Ideally, the reaction of price movement along these areas is characterized by multiple rejections (bounce) of that level before the continuation of price movement in either direction. This makes the strong levels of support and resistance reliable. Although, price can either reject or break through a level of previous resistance or support.
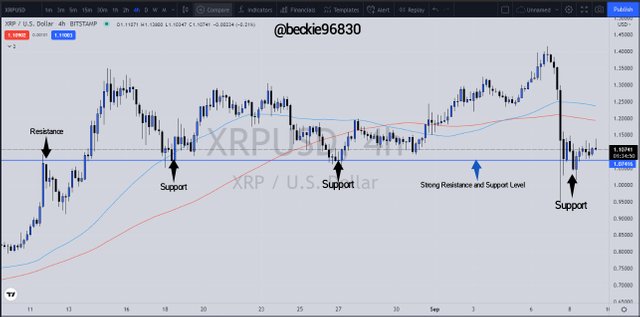
The above XRP/USD chart describes graphically, a strong level of resistance and support. The level previously held price as a resistance, but price broke above. The price level held price movement as support multiple times indicates that the presence of opposite directional pressure.
Weak Levels of Resistance and support
Weak levels of support and resistance is a price that the less opposite directional pressure is encountered, resulting in fewer rejections around these levels. Similarly, the weak opposite directional pressure can result from accumulated pending orders set around the weak support and resistance levels, which in most cases is lesser than the already established market momentum. This results in price breaking through the weak levels of support and resistance.
A weak level is resistance and support can sustain market pressure 1 to 2 times, before price breaks through the level.
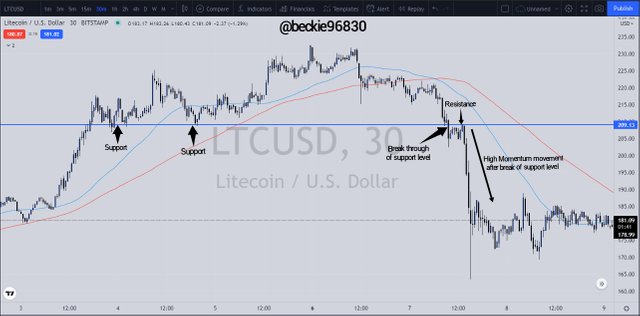
The LTC/USD chart above describes graphically, a weak resistance and support level. The level held as support twice, but price broke through the level with high momentum indicating a weak opposite directional pressure.

Question 2
Explain what a Gap is. (Required Screenshots) What happens in the market to cause It.
Gaps
A gap is a jump in price movement, characterized by a blank space between two candles in a price chart. Gaps occur as a result of sudden rapid movement of price, often caused by execution of large trade orders in the market or a release of high-impact economic data that immediately stir reactions between market participants (buyers and sellers).
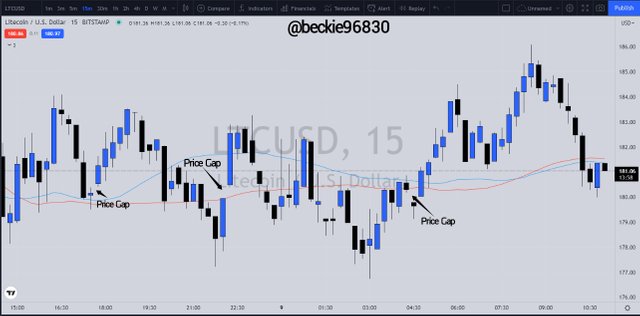
The above LTC/USD chart graphically describes how gap movements are represented in a price chart.
Gap moves are sometimes corrected immediately, or in some cases takes time to correct. As explained in the lesson, a gap represents a strong level is support and resistance.

Question 3
Explain the types of Gap (Screenshots required, it is not allowed to use the same images of the class).
Types of Gaps
There are three types of Gaps, and they're explained thus:
1- Breakaway Gaps
Breakaway Gaps are gaps that occur around swing points (resistance and support), which cause a change in market structure. This change of directional movement of price starts a new trend. Breakaway gaps break above or below a resistance or support level.
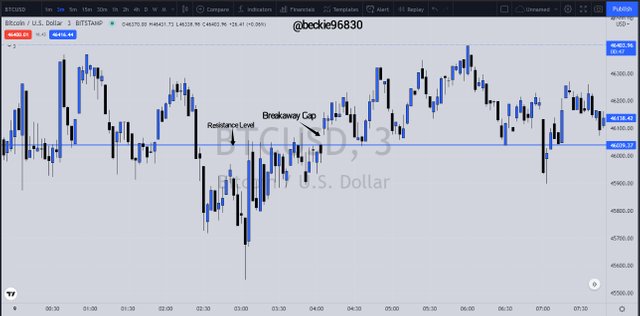
The chart image above describes the formations of a breakaway gap around a resistance level. Price broke the resistance level with a gap, changing the directional movement of price.
2- Runaway Gap
A runaway gap is a type of gap that occurs within a trend, signaling a continuation of the current trend. Runaway gaps occur as a result of high volume trade execution in the market, where investors execute large trade orders, causing rapid movement of price.
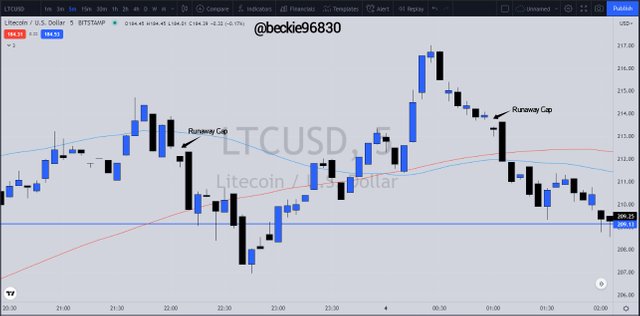
The chart image above describes the formation of runaway gaps. Price movement was bearish, and the gaps formed in line with the continuation of the bearish moves.
3- Exhaustion Gaps
An Exhaustion gap is a type of gap that occurs towards the end of a trend, causing an extended movement of price. The extended move indicates the exhaustion of in-control market participants, which signals a potential shift in market direction.
As explained in the lesson, the psychology behind trading exhaustion gaps is trading in the opposite direction, in anticipation of a change in market sentiment.
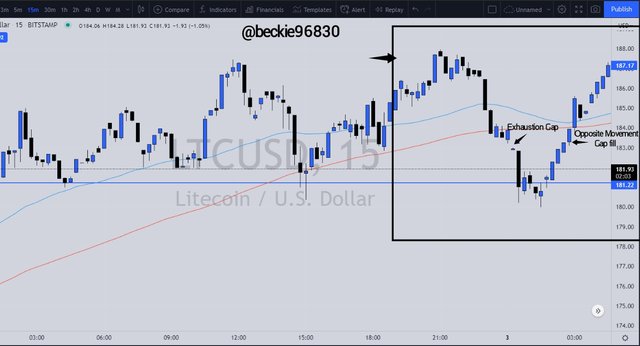
The above chart image describes the formation of exhaustion gaps and how price reverts and moves in the opposite direction, to fill the gap and continue the opposite direction movement.

Question 4
Through a Demo account, perform the (buy/sell) through Strong Supports and resistances. Explain the procedure (Required Screenshots).
Buy Trade - XRPUSD
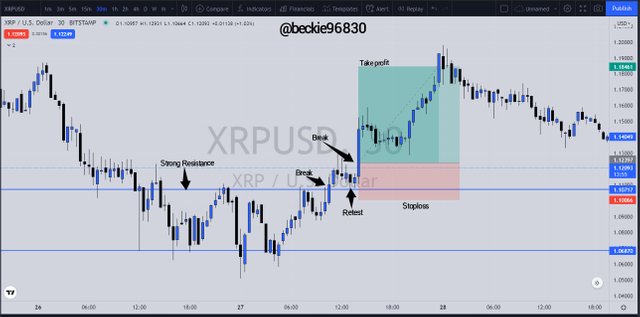
In the XRP/USD chart above, a strong resistance level was established, with the price rejecting the strong resistance level multiple times. Price broke the resistance and retested the resistance level now turned support.
Using the BRB strategy, on the break of the new swing high, a buy position can be executed. The Risk to reward ratio should be set at a minimum of 1:1 to protect the investor's account from a negative risk to reward ratio.

Question 5
Through a Demo account, perform the (buy/sell) through Gaps levels. Explain the procedure (Required Screenshots).
Buy Trade - BTCUSD (Runaway Gap)
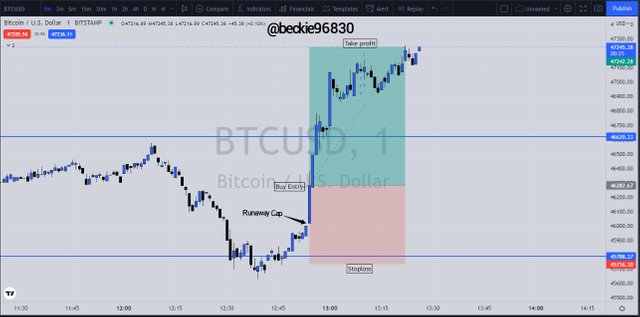
In the BTC/USD chart above, a Runaway Gap was seen in line with the current trend movement, a buy trade order was executed after the close of the second gap candle. The runaway gap was confirmed because of its formation near the start of the trend and also forming a continuation pattern in the already established bullish trend.

Conclusion
Resistance and support level are important elements in trading because it depicts the interaction between buyers and sellers in a traded market. The reliability of a resistance or support level depends on the strong or Weak reaction of price around the level.
In general, price tends to react multiple times around a strong level of resistance or support, while price reacts few times around a weak level of resistance or support before continuing its intended move.
The concept of gaps highlights the rapid movement of price that results in the jump of certain price levels. This occurs as a result of high volume trading activity done within the market by investors. Gaps can represent levels of resistance or support and can be used in making viable trading decisions.
Thank you professor @allbert for this insightful lesson.
You've got a free upvote from witness fuli.
Peace & Love!
Downvoting a post can decrease pending rewards and make it less visible. Common reasons:
Submit