
Question 1 (a)
Explain Leading and Lagging indicators in detail. Also, give examples of each of them.
Leading Indicators
The term Leading indicator refers to a category of price indicator which through its calculations predicts possible price movements (continuations or reversals) before the actual move start, this enables traders and investors to anticipate the potential more, while also preparing to capitalize on the move. Leading indicators predict possible price movement through the generation of signals based on the selected market observation sample size (indicator period).
Leading indicator basically forecast the overall condition of the market in line with interactions between demand and supply, buyers and sellers, and historical price points (resistance and support zones). These market condition forecasts are expressed in terms of balanced market conditions, overbought conditions (extreme bullish), and oversold conditions (extreme bearish).
Although leading indicators predict price movements, there is a huge tendency of price violating the generated signals, this is because of the unpredictable nature of the market, as other external factors contribute (fundamentals, government policies, etc) to the overall market perception.
Examples of Leading Indicators
- 1- Stochastic oscillators
- 2- Relative Strength Index
- 3- On-balance volume (OBV)
- 4- Average Directional Index (ADX)
Lagging Indicators
The term Lagging indicator refers to price movement indicators that show the current market condition, in line with the anticipated move from the leading indicators. Ideally, lagging indicators generate trade signals through following price movement closely indicating various price points and overall market sentiment.
Signals generated from lagging indicators are generally considered slow signals compared to leading indicator signals, because it lags behind price, allowing price formation to reveal its possible move. Lagging indicators through its calculations try to smoothen price representation because a majority of its calculation is based on averages of price within a specified period.
Although lagging indicators follow price movements, there is a huge tendency of price violating the indicator generated signals, this results from the unpredictable nature of the market, as other external factors contribute (fundamentals, government policies, etc) to the overall market perception. Lagging indicators work best for long-term investing when combined with other technical indicators.
Examples of Lagging Indicators
- 1- Moving Averages
- 2- Parabolic SAR
- 3- Ichimoku clouds
- 4 - Bollinger Bands
Question 1 (b)
With relevant screenshots from your chart, give a technical explanation of the market reaction on any of the examples given in question 1a. Do this for both leading and lagging indicators.
1- Leading Indicators
Average Directional Index
The Average Directional Index Indicator is a technical indicator developed by J. Welles Wilder, Jr. that determines if the price movement of an asset is trending, and also the strength of the trend is within a specified time. The indicator is comprised of 3 lines, the ADX line, and the Directional Movement Indicator (DMI) which is comprised of two lines, Positive Directional indicator (DI+), and the Negative Directional Indicator (DI-).
The DI+ and DI- predict the direction of a trend through a cross above each other. When the DI+ crosses above DI-, this indicates that the current trend is upward movement, and when the DI- crosses above the DI+, this indicates that the current trend is downward movement. The DMI lines are characterized by their fast reaction to price movement.
Consider the chart illustration below:
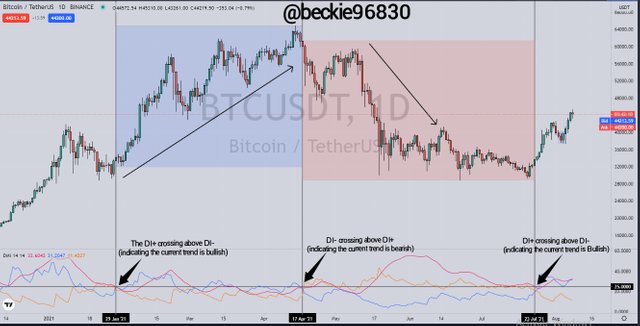
The BTC/USDT chart image above shows how the DMI lines indicate the current trend established by price movement, through the various crossing of DI+ and DI- above and below each other.
2- Lagging Indicator
Parabolic SAR
The parabolic SAR is represented on a price chart as dotted lines that appears above or below price candles. The Parabolic SAR represent trending market condition as such: when the dotted lines appear above the price movement, it indicates that the sellers are in control of the market, similarly, when the dotted lines appear below price movements, it indicates that buyers are in control of market price movement.
The parabolic SAR also indicates trend reversal through discontinuation of the dotted lines in one direction and continuation in the other direction. For instance, A bullish trend reversal can be represented by the discontinuation of the parabolic SAR dotted lines above price movement and continuation below price movements.
The parabolic SAR dotted lines will be added to the chart, representing uptrend movements and downtrend movements by appearing below and above price movements respectively.
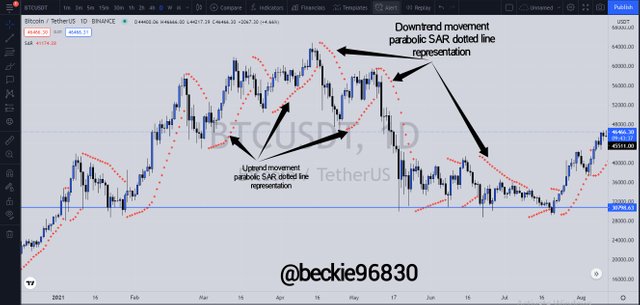

Question 2 (a)
What are the factors to consider when using an indicator?
Using Indicators
To effectively use indicators, there are factors to be considered, these factors include:
1- Knowing the Indicator Type
It is important to know the type of indicator to use in various price development points, this helps the trader understand the benefits and useful measures of the indicator. Each indicator has a unique way of representing price data. For instance, Oscillation based indicators predict how far the current has moved in relation to previous market data, while trend-based indicators predict price trend movement. A proper understanding of these indicator types will improve the trader's speculative instincts in anticipation of various market moves.
2- Trading System
To effectively use indicators, the trader is required to understand the trading system they use, which may be short-term trading (scalping), medium-term trading (intraday), and long-term trading (swinging). This helps the trader incorporate the ideal indicators that suit their trading systems, and also tweaking each indicator setting to obtain maximum trading experience while using the indicators.
3- Trading Confluence
A synergy between indicator readings (signals) and price action is required to maintain a good trading habit. Indicator-generated signals as based on estimations and calculations, this limits the generated signals to be false or distorted sometimes. Finding confluence between indicator readings and price movement increases the probability of a trade setup because multiple factors is hinting at a determined direction (trade bias). For instance, a trader using the SMA strategy will first identify a cross of the SMAs, the wait for price formation in the newly identify direction. These two confirmations create a string trade Confluence.
4- Market Perception
A trader's perception of the market is another important factor to consider when choosing to use indicators. A clear understanding of market trends, bullish structure, bearish structure, sideways market structure, etc is all instrumental to the efficient functioning of the indicator. For instance, in a trending market, a trend-based indicator is used for easy trend identification, while in the absence of a trend, the trader and uses a momentum-based indicator to capitalize on the visible directional bias.
Question 2 (b)
Explain confluence in cryptocurrency trading. Pick a cryptocurrency pair of your choice and analyze the crypto pair using a confluence of any technical indicator and other technical analysis tools. (Screenshot of your chart is required ).
Confluence Trading
The term confluence refers to a combination of various technical analysis tools in developing a trade sentiment. Confluence can result from combining price action (movement) with multiple indicators to establish a trading bias, or a combination of technical analysis and fundamental analysis to gain a retail and Marco economic view of the traded market.
Ideally, having multiple confluences increases the probability of a trade setup moving in the intending direction. But, regardless of how much confluence a setup can give, the market can still move in the opposing direction, given other external factors contributing to the development of price.
Let's consider a practical application of confluence in cryptocurrency trading:
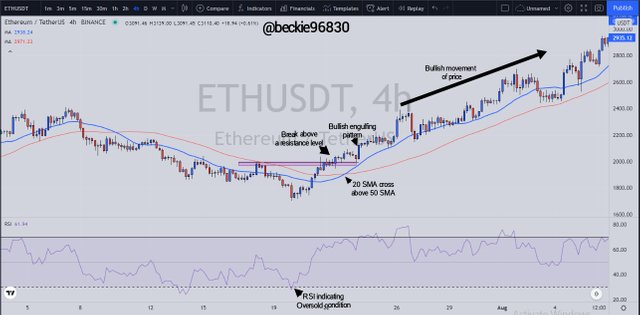
From the ETHUSDT above chart, RSI first indicated that price was in an oversold condition, which hinted at a possible bullish reversal. The break of market structure (breaking above resistance) resulted in the overall shift of market sentiment from bearish to bullish, this signaled that buyers took control of the market from the sellers. Also, the formation of a bullish engulfing pattern after the break above a resistance indicated the presence of buyers in the market. Lastly, the cross of the 20 SMA above the 50 SMA also signaled the presence of buyers in the market.
The above combination of RSI, SMA, candlestick pattern and price action all hinted at the bullish movement of price with each indicator revealing price development at different times.

Question 3 (a)
Explain how you can filter false signals from an indicator
Indicator Signals
Indicator-generated signals can be filtered to avoid fakeouts by plainly observing price reaction around areas the signal was generated, and also combining different types of indicators with price action to form confluence-based trading. These approaches can filter distorted signals generated, thus increasing the probability of the trade setup moving in the anticipated direction.
Consider the chart illustration below:
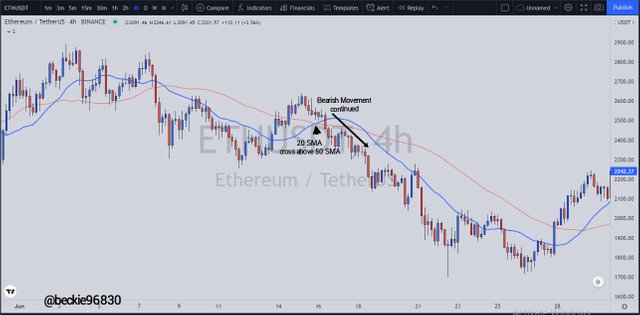
From the ETHUSDT chart above, the moving average indicators signaled a bullish signal with the cross of the 20 SMA line above the 50 SMA, which indicates the presence of more buyers than sellers at that interval. But as observed, price continued with the bearish move, which implies that the bearish pressure was higher than the bullish pressure. This short-term false Bullish signal can result in loss of capital as indicator-based traders will try to capitalize on the new bullish cycle. The above ETHUSDT Fakeout could be avoided if the price action is monitored around the SMA cross area.
Question 3 (b)
Explain your understanding of divergences and how they can help in making a good trading decision
Divergence
Divergence is a phenomenon that occurs when there is a significant difference between price movement and the generated indicator signal. Divergence in most cases signals early trend reversal before price movement will follow, as some indicators are quick to predict future price movements, this helps traders to prepare for a possible trade set in line with further development of price.
Divergence occurs in two types a bullish divergence and bearish divergence. In a bullish divergence, the indicator reading typical signals a bullish move, which price action is still bearish, while in a bearish divergence the indicator readings signal a bearish move while the price is still bullish, but over time, in some cases, price movement tends to align with the diverged indicator reading.
Question 3 (c)
Using relevant screenshots and an indicator of your choice explain bullish and bearish divergences on any cryptocurrency pair.
For this illustration, I chose the Williams %R indicator.
1- Bullish Divergence
A bullish divergence occurs when the Williams %R indicator line signals a bullish move, where the current indicator high is higher than the previous, while the movement of price is bearish. This divergence often precedes a bullish trend reversal since the Williams %R indicator shows the momentum of buyers against the sellers in a market.
High-risk-based traders take advantage of the divergence in anticipation of a trend reversal, while conservative traders wait for the bullish movement of price to start.
Consider the chart illustration below:
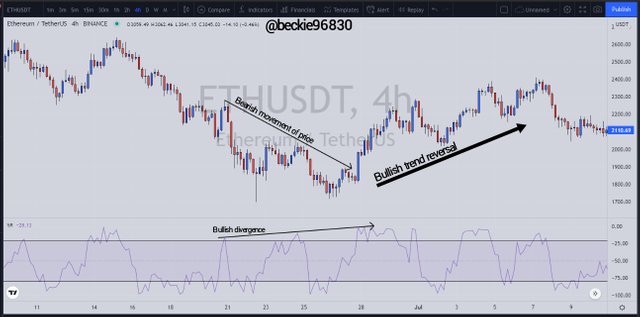
Observing the ETHUSDT chart above, a bullish divergence was formed, where the Williams %R indicator line printed a sequence of higher highs, while the movement of price formed a sequence of lower highs. As observed, the bullish divergence was followed by a bullish movement of price, which validates the early trend reversal signal of the bullish divergence.
2- Bearish Divergence
A bearish divergence occurs when the Williams %R indicator line signals a bearish move, where the current indicator lime high is lower than the previous, while the movement of price is bullish. The divergence is followed by a bearish trend reversal since the Williams %R indicator indicates the moment of sellers against the buyers in a market.
High-risk-based traders take advantage of the divergence in anticipation of a trend reversal, while conservative traders wait for the bearish movement of price to start.
Consider the chart below:
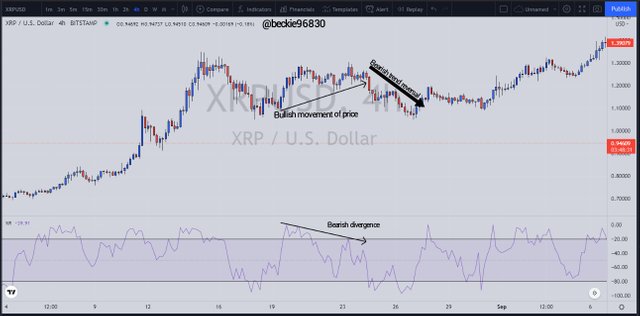
Observing the XRPUSD chart above, the bearish divergence was formed, where the Williams %R indicator line formed a sequence of lower highs, while price formed a sequence of higher highs. A short-term bearish move of price preceded the bearish divergence. Indicating a short-term bearish trend reversal.

Conclusion
indicators (both leading and lagging) are an important element of technical analysis. It provides vital information about price movement, which is calculated from previous market data. Through its calculation, trade signals are generated, which the investor can choose to ignore or capitalize on, depending on other contributing factors.
Technical indicators work best when it is combined with other indicators and technical analysis tools, this brings confluence base quality trade setups and improved trading experience.
Thank you professor @reminiscence01 for this educative and insightful lesson
Hello @beckie96830, I’m glad you participated in the 4th week Season 4 of the Beginner’s class at the Steemit Crypto Academy. Your grades in this task are as follows:
Recommendation / Feedback:
Thank you for participating in this homework task.
Downvoting a post can decrease pending rewards and make it less visible. Common reasons:
Submit