
Question 1
What is Aroon Indicator in your own words? What are Aroon-Up and Aroon-Down? (Show them on Chart).
Aroon Indicator
The Aroon Indicator is a trend-based technical indicator that is comprised of two lines called the Aroon-up and the Aroon-down. Ideally, the Aroon indicator is used to identify the current trend, possible trend changes, and the momentum of the trend movement. The indicator was developed by Tushar Chande, in 1995.
The Aroon indicator is represented on a price chart with the two lines (Aroon up and Aroon down) moving within the bound of 0 to 100, where the strength of the trend is high when the Aroon indicator line is close to 100, and the strength of the trend is low when the Aroon indicator line is closer to 0.
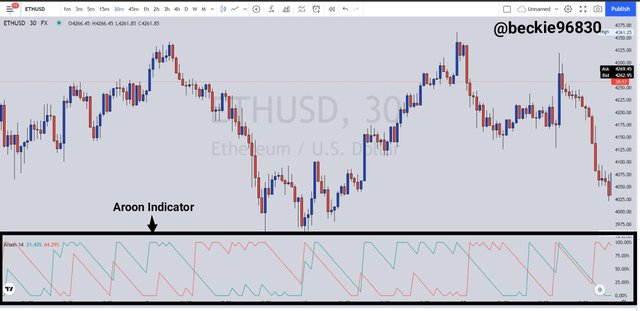
Aroon indicator works by measuring and comparing the time difference between successive highs and lows in trending markets, such that in an uptrend, the Aroon indicator measures the time difference between successive highs, as new highs are formed in an uptrend market condition, with the Aroon-up line above the Aroon-down line. Similarly, in a downtrend, the Aroon indicator measures the time difference between successive lows, as new lows are formed in a downtrend market condition, with the Aroon-down line above the Aroon-up line.
The Aroon indicator has a default period of 25, which implies that the indicators measure the differences of price relative to high and lows within the last 25 periods to generate the data required to plot the indicator values. This default period was preferred by Tushar Chande who developed the mathematical expression for the indicator. But the best setting depends on the trading system used and the type of asset traded. A short-term trader will use shorter indicator periods, while a long-term trader will use higher indicator settings.
The best setting can be determined through backtesting of the indicator strategy, and also to determine the Aroon indicator behavior when combined with other technical indicators like the Relative Strength Index (RSI).
Aroon-up Indicator Line
The Aroon-up line is one of the two mainline that make up the Aroon indicator. It is associated with the uptrend movement of price, as each successive high movement of price draws the Aroon-up closer to the top bound of the indicator value (100). Ideally, the Aroon-up line confirms the bullish Movement of price by crossing and staying above the Aroon-down line.
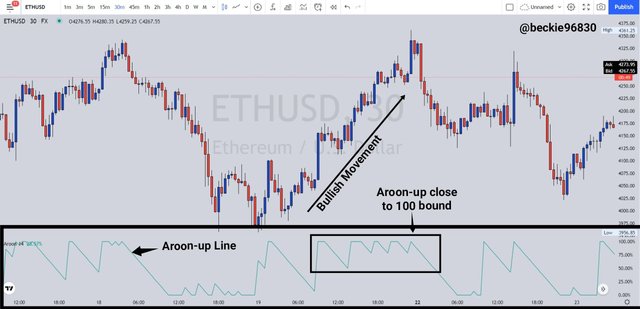
The above chart shows the Aroon-up line, and how it represents the presence of an uptrend with its movement close to the 70 - 100 bound of the indicator. Typically, the crossover of the Aroon-up above the Aroon-down indicates the change in trend, from a downtrend to an uptrend, i.e from bearish to bullish.
Aroon-down Line
The Aroon-down line is the second mainline that make up the Aroon indicator. It is associated with the downtrend movement of price, as each successive low movement of price draws the Aroon-down closer to the top bound of the indicator value (100). Ideally, the Aroon-down line confirms the bearish Movement of price by crossing and staying above the Aroon-up line.
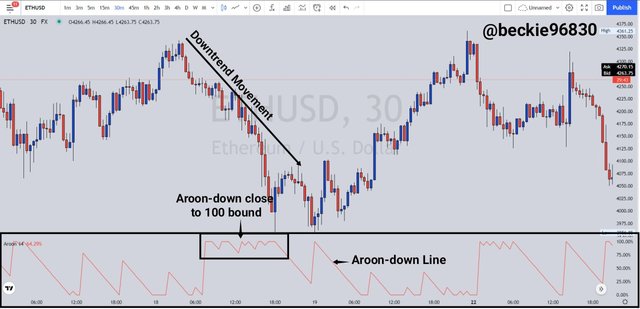
The above chart shows the Aroon-down line, and how it represents the presence of a downtrend with its movement close to the 70 - 100 bound of the indicator. Typically, the crossover of the Aroon-down above the Aroon-up indicates the change in trend from uptrend to a downtrend, i.e from bullish to bearish.

Question 2
How is Aroon-Up/Aroon-Down calculated? (Give an illustrative example).
The Aroon-up line and Aroon-down line has a mathematical expression that represents the concept of time relative to the difference in price, and the formula is as follows:
1- Aroon-up Line
The Aroon-up line is calculated thus:
Aroon-up = ((n - Periods Since the Recent 25 Period High) / n) × 100
Where n = period used
To illustrate how Aroon-up is calculated, consider the example below:
If the specified observation period is 25, and an ETHUSDT chart has the following price readings:
High Price: $3,600
Period since high price: 12
Using the above data, the Aroon-up value will be:
Aroon-up = ((25 - 12) / 25) × 100
Aroon-up = (13 / 25) × 100
Aroon-up = 0.52 × 100
Aroon-up = 52
With the above Aroon-up value of 52, it can be assumed that the asset price made a recent high or the bullish trend just started.
2- Aroon-down Line
The Aroon-down line is calculated thus:
Aroon-down = ((n - Periods Since the Recent 25 Period low) / n) × 100
Where n = period used
To illustrate how Aroon-up is calculated, consider the example below:
If the specified observation period is 25, and an ETHUSDT chart has the following price readings:
High Price: $3,250
Period since high price: 18
Using the above data, the Aroon-down value will be:
Aroon-down = ((25 - 10) / 25) × 100
Aroon-down = (15 / 25) × 100
Aroon-down = 0.60 × 100
Aroon-down = 60
With the above Aroon-down value of 60, it can be assumed that the asset price made a recent low or the bearish trend is fairly strong.

Question 3
Show the Steps involved in the Setting Up Aroon indicator on the chart and show different settings. (Screenshots required).
Adding Aroon indicator to Price Chart
To add an Aroon indicator to a chart, visit any trading platform that supports the use of indicators. For this demonstration, I will use the Tradingview platform.
First, visit Tradingview's official website and access the chart section of the platform.
Next, click on indicators (Fx) from the top menu.
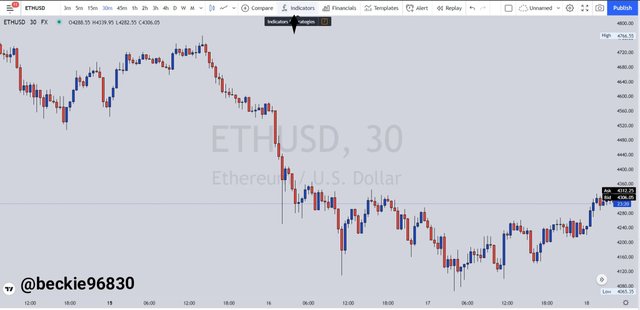
Next, search for the Aroon indicator using any related keywords like Aroon, Aroon indicator, Aro, etc.
Then click on Aroon from the search result to add the Aroon indicator to the price chart.
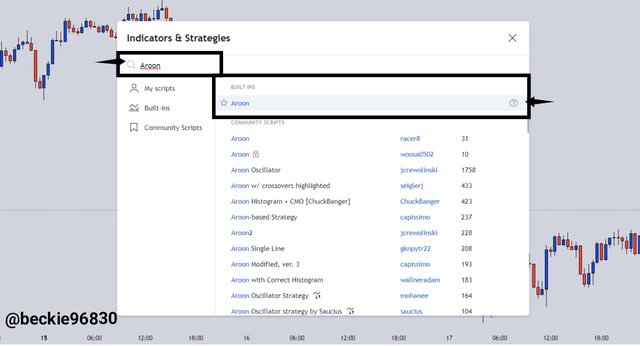
The indicator will be added to the price chart.
To modify the indicator settings to suit the preferred trading style, click on the setting icon on the top left corner of the indicator section.

On the Input tab, the indicator period can be configured to suit the trader's trading style and strategy. Ideally, a scalper will use lower indicator period settings, while a swing trader will use higher indicator period settings.
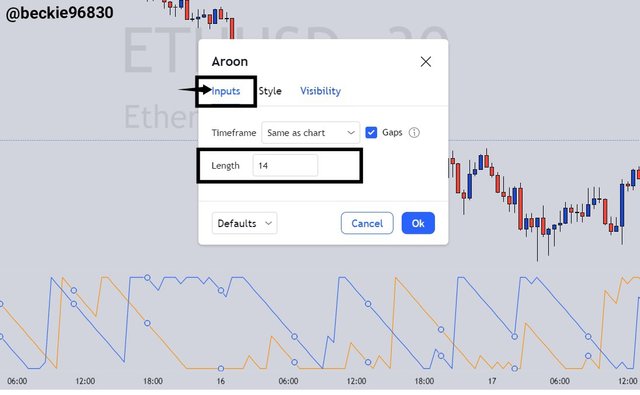
On the Style tab, the indicator appearance can be configured, such as the change of color and the precision level of the indicator movement.
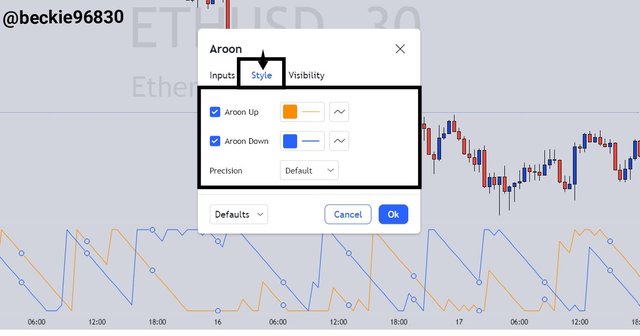
On the Visibility tab, the trader can choose the timeframe in which the indicator can be visible.
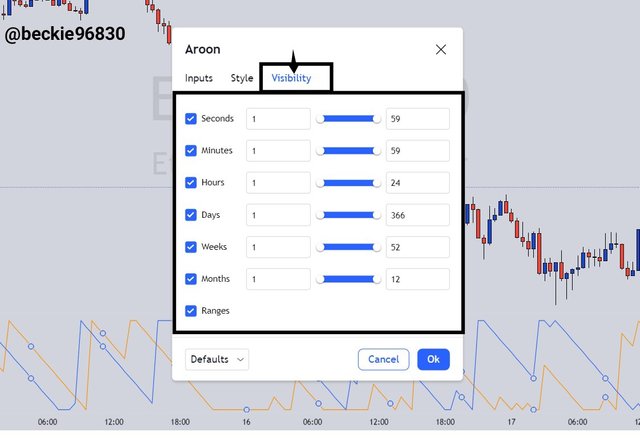

Question 4
What is your understanding of the Aroon Oscillator? How does it work? (Show it on the chart, kindly skip the steps involved in adding it).
Aroon Oscillator
Aroon Oscillator is a variant of the Aroon indicator which is comprised of a single line that oscillates between the range value of -100 to 100, with a midpoint at 0. The Aroon oscillator is derived by calculating the difference between the Aroon up line and the Aroon-down line. Ideally, the Aroon oscillator indicates the current trend, a possible change of trend, and also measures the momentum of the current trend.
The Aroon oscillator work by representing trend momentum with its movement, such that in an uptrend, the oscillator moves close to the upper limits of the bound market 100. Ideally, a move close to the 100 mark indicates the presence of a strong uptrend.
Similarly, in a downtrend, the oscillator moves close to the lower limits of the bound market -100. Ideally, a move close to the -100 mark indicates the presence of a strong downtrend.
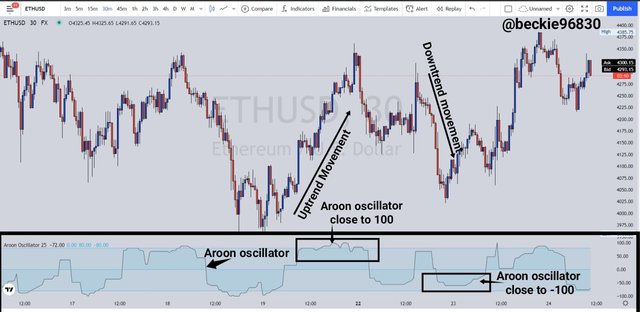
Typically, when the price of an asset makes new highs, the Aroon oscillator will be at 100, and when the price of an asset makes new lows, the Aroon oscillator will be at -100. The change of trend is identified by the Aroon oscillator with its cross above or below the midpoint 0.
A cross of the midpoint from below to top indicates the presence of price increase, which in turn forms the uptrend movement of price. While a cross from top to below indicates the presence of price decrease, which in turn forms the downtrend movement of price.
The best setting can be determined through backtesting of the indicator strategy, and also to determine the Aroon oscillator behavior when combined with other technical indicators like Relative Strength Index (RSI). But the best setting depends on the trading system used and the type of asset traded. A short-term trader will use shorter indicator periods, while a long-term trader will use higher indicator settings.

Question 5
Consider an Aroon Indicator with a single oscillating line, what does the measurement of the trend at +50 and -50 signify?
50 and -50 Aroon Oscillator Bound
As previously explained, the Aroon oscillator indicates the strength of the trend by either oscillating toward the (100) upper bound or the (-100) lower bound, with its midpoint at 0. A reading of the Aroon oscillator above the +50 bound indicates either the start of an uptrend that is fairly strong after a pullback or bearish movement, or that a recent high was formed within the last period. Similarly, a reading of the Aroon oscillator below the -50 bound indicates either the start of a downtrend that is fairly strong after a pullback or bullish movement or that a recent low was formed within the last period.

Question 6
Explain Aroon Indicator movement in Range Markets. (Screenshot required).
Aroon indicator Movement in Range Markets
A range market is defined with the absence of a trending price movement, where the price of an asset fluctuates within a defined resistance price and support price. The Aroon represents this type of market condition with the sideways movement of its line (Aroon-up and Aroon-down), such that there is no cross-over of the lime above or below each other.
In a ranging market, the Aroon indicator lines (Aroon-up and Aroon-down) imitate each other's movement because either side of the market participants (buyers or sellers) are in control of the price. The sideways movement represents the struggle for control of price. Consider the chart below:
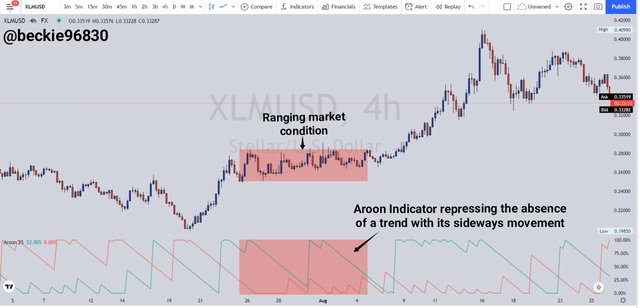
From the image above, the Aroon indicator represented the absence of a trend with its sideways movement, without the crossover of any of the Aroon indicator lines (Aroon-up and Aroon-down). The sideways movement of the indicator implies that no side of the market participants (buyer or sellers) is in control of price movement rather it signifies the struggle for control of price.

Question 7
Does Aroon Indicator give False and Late signals? Explain. Show false and late signals of the Aroon Indicator on the chart. Combine an indicator (other than RSI) with the Aroon indicator to filter late and false signals. (Screenshots required).
Aroon Indicator False Signals
It's a popular notion that no indicator is 100% efficient, this implies that the indicator can sometimes generate distorted or false signals as many other factors contribute to the development of the price of an asset. Based on how the Aroon indicator value is calculated, it is obvious that it only considers previous price data, this makes it a lagging indicator, which in some cases generates misleading signals.
The Aroon indicator signal is generated when the Aroon lines (Aroon-up and Aroon-down) cross above or below each other. A false signal implies that the cross of the Aroon line is in opposition to the actual movement of price. To illustrate this, consider the chart below:
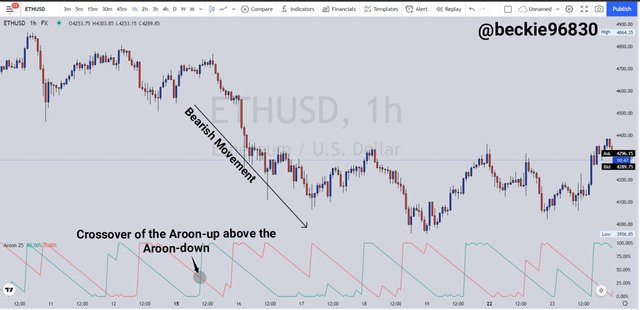
From the above chart, the Aroon-up line crossed above the Aroon-down line, which indicates a buy signal. But with further price development, the price made strong bearish movements just after the crossover.
Aroon Indicator Late Signals
The Aroon indicator is a lagging indicator because its calculated values are derived from previous price data, this implies that the Aroon indicator has the tendency of generating trade signals late, as price development comes first before the indicator values are computed. To illustrate this, consider the chart below:
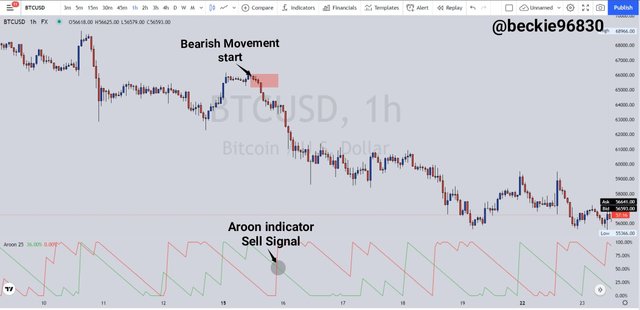
From the chart above, the bearish movement of price started ahead of the Aroon indicator sell signal. A significant downtrend move has occurred for about 6 hours (based on the hourly timeframe) before the Aroon-down line crossed above the Aroon-up line. As explained, this is a result of the lagging nature of the indicator.
To avoid false and late Aroon indicator signals, it's best to combine the indicator with other indicators like Moving averages, Ichimoku clouds, etc, to reduce the impact of latency and lagging price movement, and to hello filter out false indicator signals.
Combining Moving Averages and Aroon indicator
The Moving average indicator strategy is a very popular trading strategy that involves the cross of the moving average lines above or below each other indicating buying or selling signals. Combining the moving average with the Aroon indicator greatly reduces the effect of late signals and false generated signals. To illustrate this, consider the chart below:
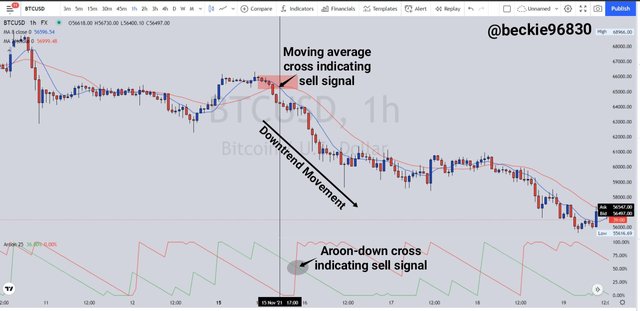
From the chart above, the Moving average lines indicated the sell signals ahead of the Aroon indicator. This moving average hint of possible price movement ahead of the Aroon indicator can greatly increase the profit percentage of the trade.

Question 8
Place at least one buy and sell trade using the Aroon Indicator with the help of the indicator combined in (7) above. Use a demo account with proper trade management. (Screenshots required).
1- Buy Trade ETHUSD (4H)
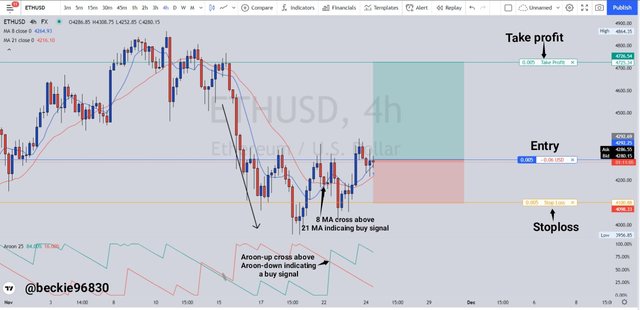
From the ETHUSD chart above, the Moving average indicator signaled a buying opportunity with the cross of the 8 MA line above the 21 MA line. This was also confirmed by the Aroon indicator with the crossing of the Aroon-up line above the Aroon-down line. Following the principles of price action, the resistance was broken after the price consolidated for a while with the small breakout bullish candle.
The buy trade position was excited at $4,292.25 with stoploss at $4,100.88 and take profit price at $4,726.54. The trade has a risk to reward of 1: 2 with the Stoploss placed at the precious lows, and the take profit targeting the previous highs.
2- Sell Trade BTCUSD (3 mins)
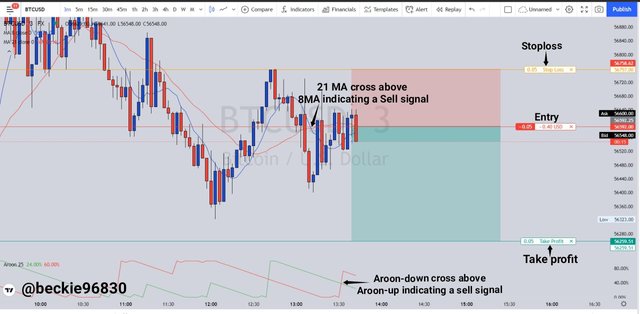
From the BTCUSD chart above, the Moving average indicator signaled a selling opportunity with the cross of the 21 MA line above the 8 MA line. This was also confirmed by the Aroon indicator with the crossing of the Aroon-down line above the Aroon-up line. Following the principles of price action, the resistance was respected after price consolidation. The support was broken and the price traded below the support to form new lows.
The sell trade position was executed at $56,592.25 with stoploss at $56,758.62 and take profit price at $56,259.51. The trade has a risk to reward of 1: 2 with the Stoploss placed at the precious lower high, and the take profit targeting the previous lows.
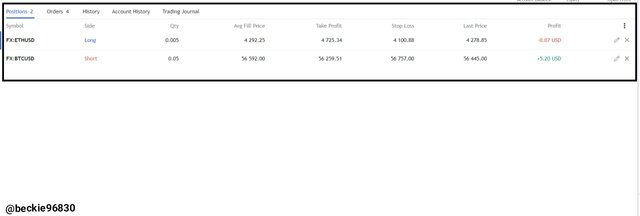
The trade orders were executed.

Question 9
State the Merits and Demerits of Aroon Indicator.
Merits of Aroon Indicator
The Aroon indicator has some merits which include some of the following:
1- Easy to understand
The graphical representation of the Aroon indicator is relatively easy to understand as it contains minimal lines and graphical representation meaning when compared to indicators like Ichimoku with multiple lines.
2- Trend Representation
The Aroon indicator helps invertors and traders identify the current trend and the probabilities of the current trend changing as well as the strength of the trend with the Aroon Lines (Aroon-up and Aroon-down) representations. This proves to be very helpful and effective.
3- Trade Signals
The Aroon indicator generates trade signals with the crossover of either the Aroon-up or the Aroon-down. This is very useful to investors and traders as buy or sell signals can be easily identified.
Demerits of Aroon Indicator
The Aroon indicator has some demerits which include some of the following:
1- Lagging Indicator
The Aroon indicator is classified as a lagging indicator because of how its values are computed. The values are derived from previous price data which has no direct correlation with the current price movement. This often results in late signals and false signals.
2- False Signals
Due to the lagging nature of the Aroon indicator, there is a probability of false signals to be generated, as other factors are influencing the development of price.
3- Late Signals
This is the other effect of lagging indicator, as it represents development late resulting in missing possible profitable trade position or late entry of trades.

Conclusion
The Aroon Indicator is a trend-based technical indicator that is comprised of two lines called the Aroon-up and the Aroon-down. Ideally, the Aroon indicator is used to identify the current trend, possible trend changes, and the momentum of the trend movement. While the Aroon Oscillator is a variant of the Aroon indicator which is comprised of a single line that oscillates between the range value of -100 to 100, with a midpoint at 0. The Aroon oscillator is derived by calculating the difference between the Aroon up line and the Aroon-down line.
To avoid false and late Aroon indicator signals, it's best to combine the indicator with other indicators like Moving averages, Ichimoku clouds, etc, to reduce the impact of latency and lagging price movement, and to hello filter out false indicator signals.
Thank you professor @fredquantum for this educative and insightful lesson.