Hello, welcome to Steemit Crypto Academy Season 5, Week 3.
It is another great chance to learn. Thanks to Prof @kouba01.


DISCUSS YOUR UNDERSTANDING OF THE USE OF THE ALLIGATOR INDICATOR AND SHOW HOW IT IS CALCULATED?

Hi! Welcome to yet another exciting, educating, and informative moment with me. In this section, I will be introducing us all to the concept of the Alligator indicator and how we can best use this technical analysis tool for personal and trade development.
Firstly, I will like to raise a question and that’s what is the Alligator Indicator and how did it come about?
So this question is one that I for a person is highly interested in, and for that reason, I will give my best in helping us all catch a simpler glimpse and understanding of it.
The Alligator Indicator was founded by a reputable trader known as Bill Williams in the year 1995. The Alligator Indicator is an Indicator that proffers you the opportunity to trade with the trend, which is the reason it is nicknamed a trend following Indicator. The Alligator Indicator proffers you as its user the opportunity to trade, by plotting 3 moving averages on the chart. The founder of the indicator (Bill Williams) called these 3 moving averages the balanced lines, and he gave each of these lines different names; Where he called the first balanced line The Jaw, the second balanced line the lips, and the third balanced line the teeth. These 3 balanced lines are identified by the colors they are coded with, the first balanced line known as “The Jaw” is identified by a blue line, the second line known as “The Teeth” is identified by a red line, while the third line known as “The Lips” is identified by a green line. The balanced line interacts amongst themselves and this helps to create insights into the market condition currently experienced i.e. It offers you the opportunity to create a meaningful insight based on your understanding of the state of the market and also helps you identify when there’s no trend in the market when a trend is forming and also help you understand the direction of the trend when a trend eventually exists in the market.
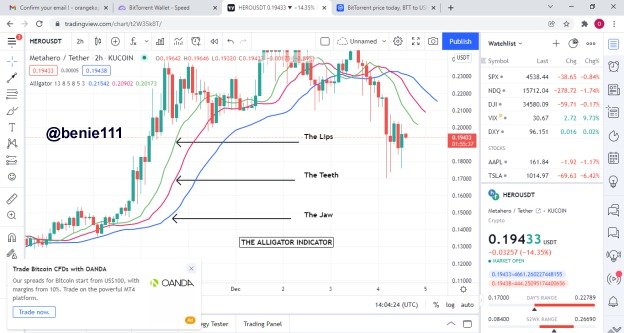
THE USE OF ALLIGATOR INDICATORS
As written in the section above, we can see that the Alligator Indicator is a fascinating technical analysis tool, which is used in creating insights into the financial market. The insights drawn from the use of the Alligator Indicator are as follows;
- The identification of trends/used to find the directions of trends, as well as in the case of determining entry and exit points or price levels. However, it doesn’t stop there as we can use this amazing tool
- It is also used to figure out when to stay clear of the market i.e. when there’s no trend in the market, and the market is currently in a halt phase or in a no trend phase, which usually is a range or consolidation.
- It is also used to determine and identify wave formations, such as impulsive and corrective wave movements to make better trade decisions.
HOW IS THE ALLIGATOR INDICATOR CALCULATED?
Remember from the section above, it is stated that the Alligator Indicator is made up of 3 moving averages, which was called the balanced line by the founder of this indicator (Bill Williams). Bill Williams went further by naming each of these balanced lines, he called the first balanced line “The Jaw”, the second balanced line “The lips, while the third balanced line he named the teeth.
Each of the above-mentioned balanced lines is a calculation of smoothed and simple moving average over 13, 8, and 5periods.
Now let’s look at how the Alligator Indicator is being calculated in real-time;
First, you need to look at the median price, this s because we will be needing the median price to calculate for each of the balanced lines which are calculated as
Median Price = (High + low) ÷ 2
Here, this indicates to us that, the median price is the combined high and low prices of the bar.
Now to calculate for the first balanced line;
- JAW = SMMA x (Median price 13,8)
this simply means that the Jaw will be smooth by 13 periods, and shifted forward 8. The SMMA here means the Smoothed moving average
Now to calculate for the second balanced line; - TEETH = SMMA x (Median Price 8,5)
This means that the teeth will be smoothed by 8 periods, and shifted forward 5 - LIPS = SMMA x (Median Price 5,3)
This means that the Lips are smoothed by 5 periods and shifted forwards by 3.

SHOW HOW TO ADD THE INDICATOR TO THE CHART, HOW TO CONFIGURE THE ALLIGATOR INDICATOR, AND IS ADVISABLE TO CHANGE ITS DEFAULT SETTINGS?

In this section, I will be guiding and helping us understand how the Alligator Indicator can be added to the chart, with www.tradingview.com as the case study. Below is the step by step approach to getting the Alligator Indicator added to our chart;
I.) Once we have visited our trading platform and we are currently on the chart interface (however for this writing, the case study is www.tradingview.com), click on the fx option shown in the screenshot below.
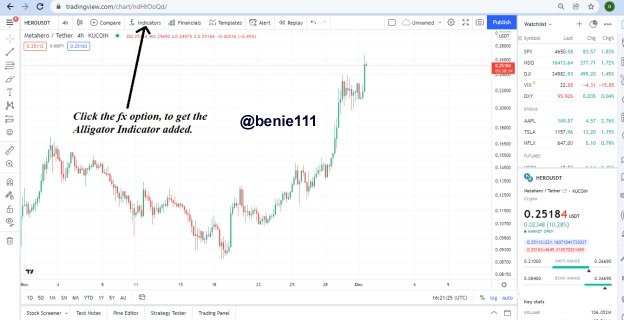
ii.) Once the fx option has been clicked, it takes us to an interface where we need to type in the name of the Indicator we want to search for... in the search bar, let’s type in the name of the indicator “Alligator”.
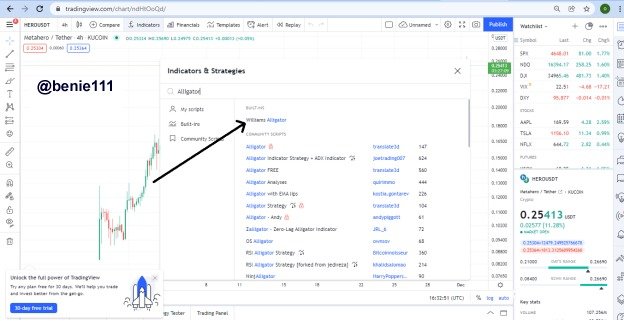
As we can see from the screenshots above, we typed in Alligator in the Search Bar and it brought different types of Alligator indicators. We are interested in the Williams Alligator, which can be seen in the Built-ins. So kindly follow the prompt from the screenshot to pick the Williams Indicator.
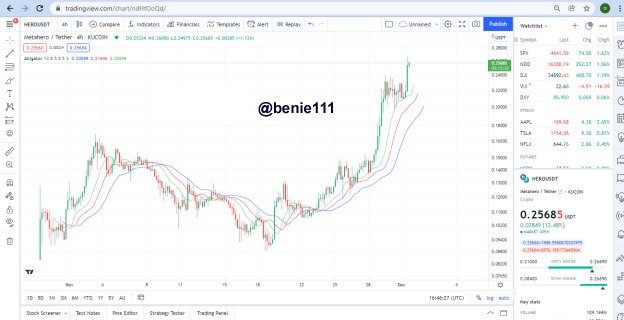
iii.) Once the Williams Alligator is clicked, we can find it added to our chart as shown in the screenshot below, and we can then proceed to use it to create insights from the market.
HOW TO CONFIGURE THE ALLIGATOR INDICATOR?
I will be walking us through the steps required to configure the Alligator Indicator. Kindly pay attention to the steps below, so you can catch a grasp of how to configure the Alligator Indicator in your chart.
- Once the Alligator Indicator has been added to your chart, click on the Alligator Indicator added, once this is done… the settings option pops up on your chart, just as it is illustrated in the screenshots below.
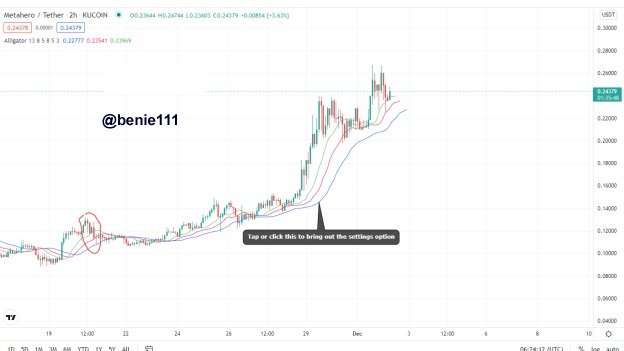
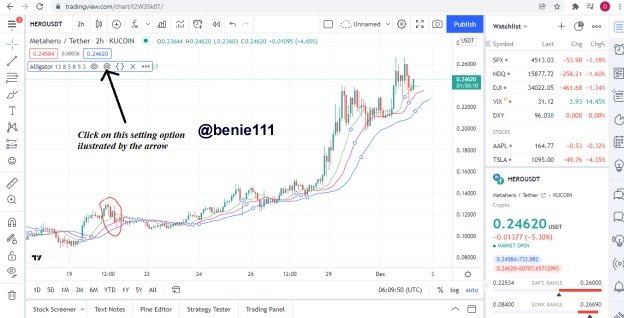
- Once the above-mentioned has been clicked, it brings out an interface where you can configure the Alligator Indicator to suit the purpose you need it for. We’ll be going through it in the screenshots below;
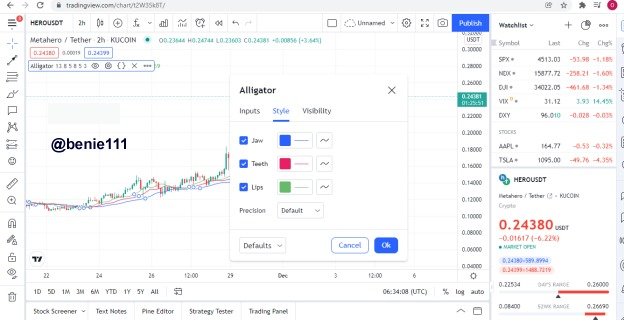
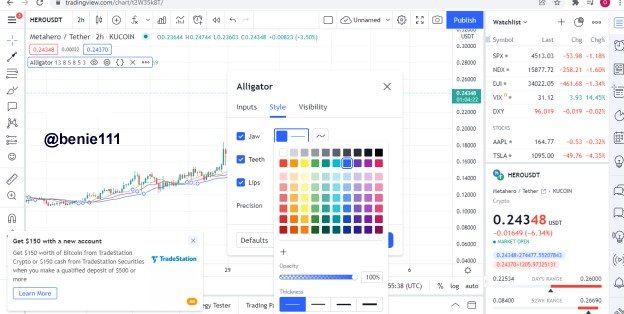
The style and color-coding fit in the purpose for each of the Balanced lines, so here we have the first balanced line “The Jaw” represented in color Blue as it should, the second balanced line “The Teeth” represented in color Red, while the third line “The Lips” represented in color Green. If you will agree with me, we are fine with the color-coding. However, if we aren’t cool with the colors, we can change them by tapping either of the colors and we can pick our most preferred color. A screenshot is shown below to illustrate this;
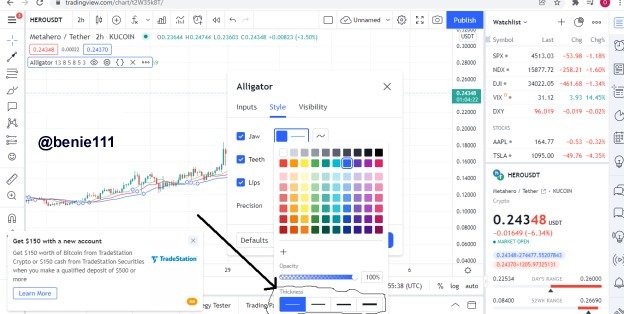
And also if you want the balanced lines to be more obvious or thicker, you can follow the prompt in the screenshots below;
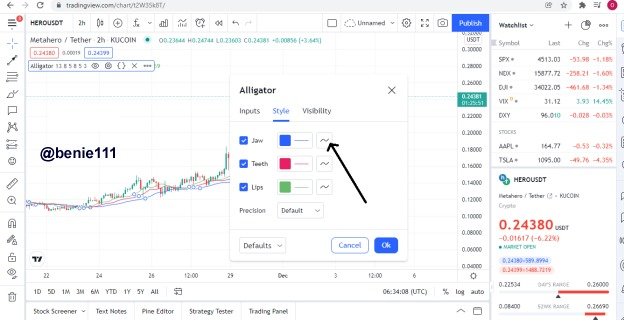
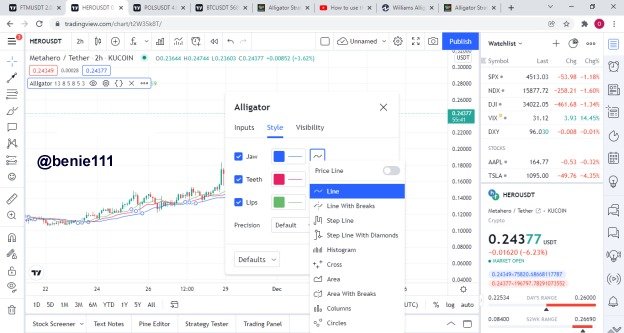
Also, if you don’t want the balanced lines to be represented in form of lines, so probably you have a different method that is your most preferred means of interpreting the Alligator Indicator aside being in form of a line, you can select and pick your most preferred by
Then you can pick your most preferred style in the screenshot below;
- An important aspect you need to pay rapt attention to is the Input section, always ensure it’s in the right figures as you desire, just because if this is altered or not in the most appropriate figures as you desire, it might affect the output. A screenshot is shared to explain this;
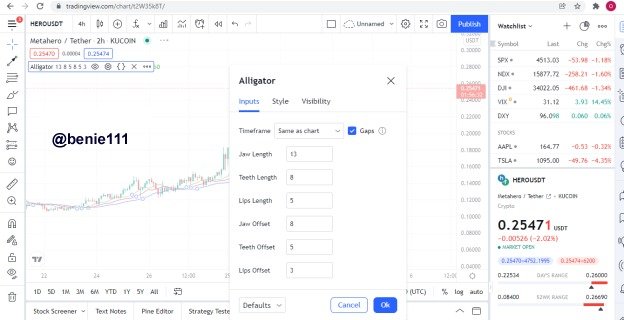
From the screenshots above, you want to ensure all the balanced lines figures are correct, to ensure that it gives you the desired outputs.
IS IT ADVISABLE TO CHANGE THE DEFAULT SETTINGS?
For me, I think it’s based on personal preference and the knowledge one has. I believe development is always welcomed, if anyone has been able to research more and feels there’s a way to get the best off the Alligator Indicator aside from the default settings, sure it’s advisable. Besides, development is a great approach to bettering what we do, so yes it’s a welcome development.
But for anyone who doesn’t have any reason whatsoever, should stick to the default settings.

HOW DO WE INTERPRET THIS INDICATOR FROM ITS 3 PHASES: THE PERIOD OF REST (OR SLEEP), AWAKENING, AND THE MEAL PHASE?

The Indicator is called “Alligator” because its formation looks like a mouth of an alligator. So this is the idea that birthed the concept and name “Alligator” and that’s the reason the three balanced lines that make up the alligator Indicator are named The Jaw, The Teeth, and the Lips. For this reason, the alligator is said to exist in 3 phases, which includes;
- The period of Rest, which is usually said to be asleep, and;
- The awakening period, which is usually said to be the moment the alligator indicator is awake and ready to devour the market.
- The meal phase, is the phase where the Alligator indicator is eating up the market
Now for a better understanding of these phases, I will be explaining each of these phases below;
- The period of Rest; this phase is usually a phase where the Alligator indicator is at rest, based on the fact that the market is in a range or consolidation. To identify this, you’ll figure out that each of the balanced lines is at close range with each other. When you see this on your chart, you know it is as a result of the fact that the market is currently experiencing a range or consolidating. So basically this implies the market is neither in an uptrend nor is it in a downtrend.
A screenshot is shown below to illustrate this;
.jpeg)
- The awakening period is referred to as the moment the Indicator rises or moves away from the rest phase i.e. Range or consolidation. The awakening phase or period is identified when the balanced line moves far away from each other, so, when a market is experiencing a trending market condition, the market is said to be awake through the use of the Alligator Indicator. To determine how strong the trend is, this will be based off, how wide the margins between each balanced line are.
A screenshot is shown below to illustrate this
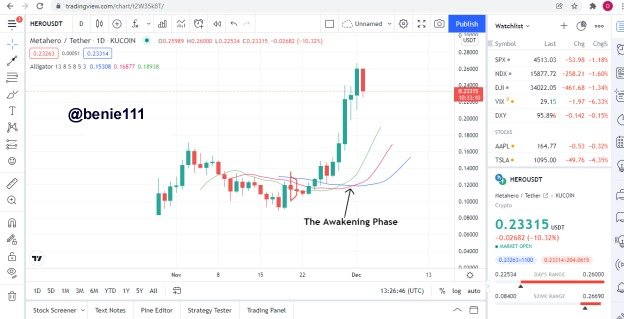
- The meal phase: the meal phase usually occurs after the alligator indicator is awakened, here if the Alligator will be very hungry, it’s usually determined by how long it has been sleeping, this is based on the logic that if it has been sleeping for long hours there’s a high chance it will be very hungry when it wakes. This is the case that makes the trend very strong, so when the trend moves with a strong conviction or impulsive move either upward or downward, it is said to be awakened and you see the moving averages very far from each other. So this usually follows suit with taking of profits after the price has trended for a while. So in this phase, you see the alligator indicator contrasting. this tells us that the alligator indicator is currently eating.
A screenshot is shown below to illustrate this is the moment a financial asset.

BASED ON THE LAYOUT OF ITS THREE MOVING AVERAGES THAT MAKE UP THE ALLIGATOR INDICATOR, HOW CAN ONE PREDICT WHETHER THE TREND WILL BE BULLISH OR BEARISH

I love this question personally. So based on the layout of the Alligator Indicator balanced line, one can predict whether the trend will be bullish or bearish through what is known as crossovers of the moving averages, now I guess you’re wondering how
Well, this is simple and all you need to do is to take note of three moving averages (Balanced line). Remember these lines are identified as the jaw, the teeth, and the lips; where the jaw is color-coded as blue, the teeth are color-coded as red, while the lips are color-coded as green.
Now with this being said; “How Can One Predict If the Trend Will Be Bullish Through the Alligator Indicator?”
The way to confirm this is by taking note of the crossover of balanced lines; so when the lips which are color-coded as green cross the other moving averages to move upward, we can predict a bullish signal, and also an important point to note is, this majorly happens just before the alligator awakens or while it’s awakening.
A screenshot is shown below;
.jpeg)
HOW CAN ONE PREDICT IF THE TREND WILL BE BEARISH THROUGH THE ALLIGATOR INDICATOR?
Same as the principle used in determining for Bullish trend, the same principle is applied in determining for a Bearish trend. So this principle is known as the crossover mechanics; when the lips (green color moving average) of the Alligator Indicator crosses the rest moving averages or balanced line (The Jaw and the teeth) to move from above to below, this indicates a bearish momentum coming into the market. Always remember that this usually takes place mostly after the Alligator has rested for a while.
A screenshot is shown below;
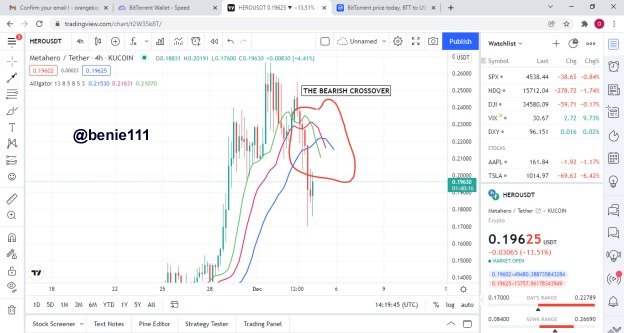

EXPLAIN HOW THE ALLIGATOR INDICATOR IS ALSO USED TO UNDERSTAND SELL / BUY SIGNALS, BY ANALYZING ITS DIFFERENT MOVEMENTS.

So remember it is essential to understand how the Alligator Indicator behaves, once this is understood that is a step ahead to understand the Indicator better. We, therefore, need to keep in mind that the Alligator Indicator moves in phases, which are the rest phase known as the sleeping phase, the awakening, and the meal phase.
So how can you use the Alligator Indicator to understand the Buy signals?
Remember that the sleeping phase comes with all the moving averages (The Jaw, the Teeth, The Lips) lying close to each other, then it follows suits with a formation of a trend which can be seen when the jaw and the teeth go through the same direction and lastly the lips join them and you can find them all moving in the same direction.
“So To Understand Buy Signals”
You want to watch the Indicator behavior or movement from the rest phase and watch the formation of a trend that exists as a result of that, also ensure the formation of trend is obvious i.e. the Jaw and the teeth move in the same direction, then lastly the lips follow through by crossing them from below to above. How strong this trend is determined by how far the moving averages are to themselves, and for a bullish one, the lips would be above the teeth and the jaw.
A screenshot is shown below;
.jpeg)
“To Understand Sell Signals”
It is the same based on the explanation above, but I will explain that here too. In understanding sell signals, you want to watch the behavior exhibited by the Alligator Indicator throughout its session. So here, it usually starts with resting, then it awakens and you can find the Jaw and the teeth moving in the same direction, then the lips cross them to move below. Now the three moving averages are moving in the same direction and this confirms a trend. For a strong bearish trend, you will find the jaw above, the lips below, and the teeth in between the jaw and the lips.
A screenshot is shown below;
.jpeg)

DO YOU SEE THE EFFECTIVENESS OF USING THE ALLIGATOR INDICATOR IN THE SCALPING TRADING STYLE?

Before I dive deep into answering this question. I will like to help us understand what the term scalping means.
Scalping is the term used for a trade style or method where the traders do not intend or do not trade or stay in the market for long hours, their time limit is usually in minutes and whatever the market gives them within that period they take it. So they basically open a sell or short order and take profit quickly or they open a buy order and take profit quickly.
So the questions say, do I see the effectiveness of using alligator Indicator in scalping trading style?
Yes, I see the effectiveness of using Alligator Indicator in scalping trading style, based on the trading models associated with Alligator Indicator.
So remember Alligator Indicator is built off 3 moving averages, and the trading style is using the crossovers mechanism to pick an entry
An example of the steps that needed to be taken:
- Switch to a smaller time frame, preferably from 15mins timeframe to anything lower
- After doing this, look for a quick scalp opportunity by using the crossovers to pick an entry
- Take the trade and take profit as soon as possible or the moment you notice an imminent change in trend, either through the alligator indicator or your candlestick knowledge.
A screenshot is shown below to illustrate this;
.jpeg)

IS IT NECESSARY TO ADD ANOTHER INDICATOR FOR THE INDICATOR TO WORK BETTER AS A FILTER AND HELP GET RID OF UNNECESSARY AND FALSE SIGNALS?

Yes, it is necessary to add another indicator to the chart, in other to get a better trading decision or bias. It is the best approach when using indicators to trade, always ensure you don’t use an indicator in isolation.
In doing this, we’ll be making use of another trend indicator to filter and help get rid of an unnecessary and f, and the indicator to be used in this case is known as the stochastic Oscillator.
Before getting started, let’s help ourselves with a brief introduction to understanding the stochastic oscillator.
WHAT IS THE STOCHASTIC OSCILLATOR?
The stochastic indicator just like the Alligator Indicator is made up of lines, however, the stochastic indicator is made up of 2 lines, unlike the Alligator Indicator that is made up of three lines. So the lines move within a range of 0 to 100, which is also categorized as overbought and oversold regions. So literally, when these 2 lines move within 20 to 0 range, they are referred to as being in the oversold region, while when they are within the 70 to100 range they are referred to as being in the overbought region, and hence a reversal is imminent the moment they are within either of these regions.
HOW CAN WE USE THE STOCHASTIC INDICATOR TO FILTER?
It is important to note that you don’t want to use an indicator in isolation, hence you want to use both indicators together and the moments these two indicators are in confluence, this will most likely give a higher probability trades.
A screenshot is shown below on how to use the stochastic Indicator to filter the Alligator Indicator,
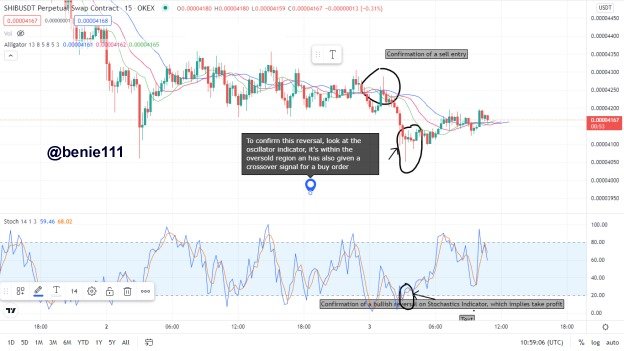
In the screenshot above, the pair used is SHIBUSDT on a 15mins timeframe. From the screenshot, you can see a sell trade opportunity for a quick scalp, and what follows suit after some minutes was a warning signal by the stochastic indicator. This warning signal is indicating to you that the sell trade is currently in an oversold region and a reversal is likely to take place.
With that warning coming, we can then see the red stochastic line crosses the blue stochastic line from below to above, and what follows suit was indeed a bullish reversal.
With this, we can conclude that indeed the stochastic indicator helped us filter what could have resulted in a reversal also the signal and could have led to loss on time, and with this, we quickly took profit on the trade.

LIST THE ADVANTAGES AND DISADVANTAGES OF THE ALLIGATOR INDICATOR

ADVANTAGES OF THE ALLIGATOR INDICATOR.
- It identifies all forms f trends and it doesn’t restrict its use to just one type of trend.
- It helps you identify strongholds on your charts
- It is a trend tool but also help you understand the various forms of market condition
- Beginners can quickly get to understand it if they develop an interest in it.
- It notifies you of the beginning of a trend, and this way when you’re able to catch it quickly you’ll be opportune to make more profit.
DISADVANTAGES OF THE ALLIGATOR INDICATOR
- It is liable to give false signals; therefore, you must not use it in isolation. Although I recommend using it with a Stochastic oscillator, don’t limit yourself to this alone.
- Just as many indicators, you will need to readjust the timeframe depending on your trading style.
- If you use it without combining it with other indicators, you could lose money.

CONCLUSION

The Alligator is a fascinating technical analysis tool to use in detecting or catching a trend early, it serves quite a useful purpose and the concept behind its name is amazing. However, it is of great importance to be able to know how to use it to spot trade and take different entries while ensuring you’re not risking too much. So one needs knowledge of good risk management, as well as candlestick knowledge to be able to make the best use of this indicator.
NOTE: All screenshots taken from Tradingview