ANSWER
Pivot Points
A pivot point is a technical instrument used by traders to determine whether to take profit, when to buy, and when to wait.
The mean average of the market highs, lows, and closing price is referred to as the pivot point. It is used to determine the crypto market price trend within a particular period of time.
As a result, we can agree that the pivot point is a midpoint; if the price trend rises above it, the market is considered bullish; if the price trend falls below it, the market is considered bearish.
The pivot point provides information about the market's resistance and support levels. With pivot point, traders can make trading decisions by analyzing the past price chart over a period of time with the goal of predicting price trend in times to come
ANSWER
The Pivot Point Levels are made up of Pivot point itself which stays in the middle and then, the support levels and the resistance levels.
- Support levels
On a cryptocurrency chart, a support level is the point at which the price of a cryptocurrency falls in a downward direction before rising again. The support level is the floor level where the price hits and rebounds back to an uptrending position.
Support level. S1: This is basically the first support level. The S1 line falls below the center pivot line and when price trend gets here, it is referred to as bearish movement.
Support level2. S2: This is the second support level. S2 line sits below the S1 level. The price trend might bounce up from here or continued the bearish movement as well.
Support level 3. S3: This is the third support level. The S3 position is below the S2 levels. The price trend might bounce up from here or continued the bearish movement
- Resistance Levels
The resistance level is the point at which the price of a cryptocurrency reaches its highest point in an upward trend. The resistance level is the point at which the price hits and bounces off in a downward position.
Resistance Level 1. R1: The R1 is refered to as the principal level of resistance, which comes right above the middle line which is the pivot point and when price moves toward R1 or above it, it is referred to as bullish market
Resistance Level 2. R2: This level comes above the R1. Possibly, the price trend might move downward trend, but if the price goes more higher, it is continued a bullish market
Resistance Level 3. R3: This is the third resistance level. This level comes above the R2. Possibly, the price trend might move downward from there, but if the price trend didn't come down, then it continued a bullish run.
ANSWER
Given that:
High - Highest price for the day
Low - Lowest price for the day
Close - the closing price of the day.
PP - The Pivot point itself
Pivot Point = (High + Low + Close) / 3
- S1: Support 1 = 2 x Pivot - High
- R1: Resistance 1 = 2 x Pivot - Low
- S2: Support 2 = Pivot - (R1 - S1)
- R2: Resistance 2 = Pivot + (R1 - S1)
ANSWER
I will be using Tradeview tools to apply Pivot point on a chart.
Tradeview was accessed from coinmarketcap.com
After you might have searched for your preferred coin, go to the chart and select tradingview.
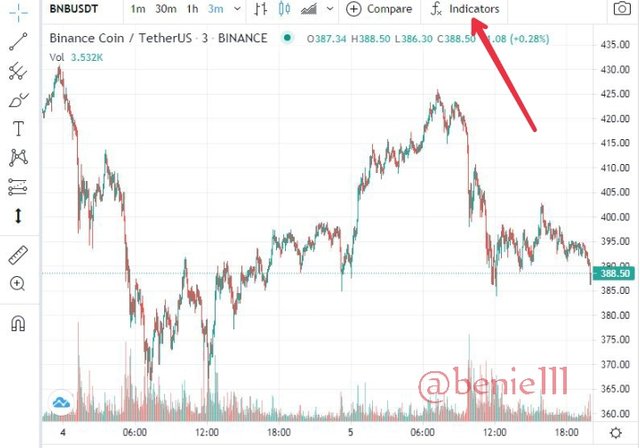
Here, click on the Fx indicator and it will bring a set of indicators from which you can make your choice
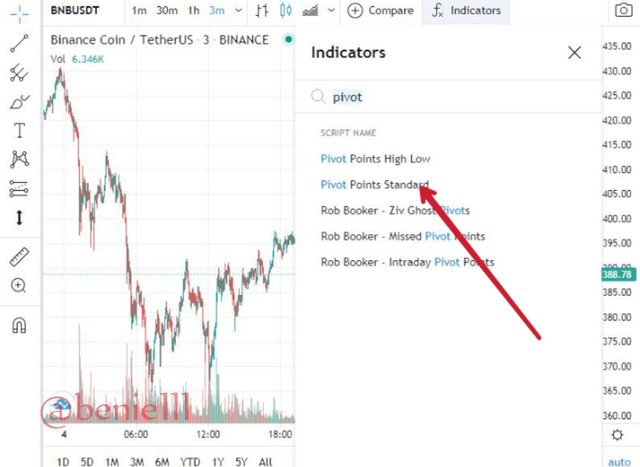
Go to the search bar, and type the indicator which you'll like to use: Pivot point. It will bring different pivot points for you, then, click on pivot points standard.
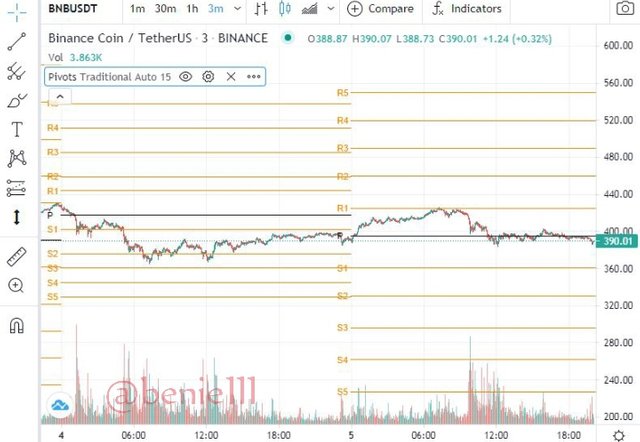
This will be the result of what you've selected, and that's what the pivot points standard looks like. But we will be adjusting somethings to ease our experience and use. As you can see, the number of support and resistance level we have now is upto 5.
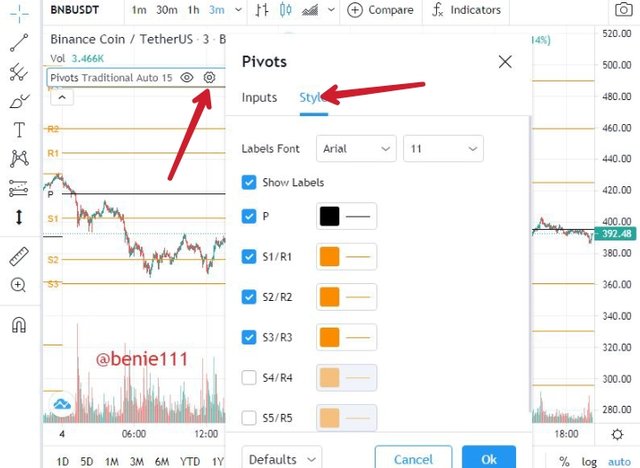
Go to the pivot points standard auto bar, and click on settings. we will be maintaining all the setting from the "input option". So we will click on "style", then we will active just the numbers of Support and Resistance lines we would like to have on the chart. We can adjust the colors too. (And here, I selected the pivot point line to be black, and then, click on Ok).
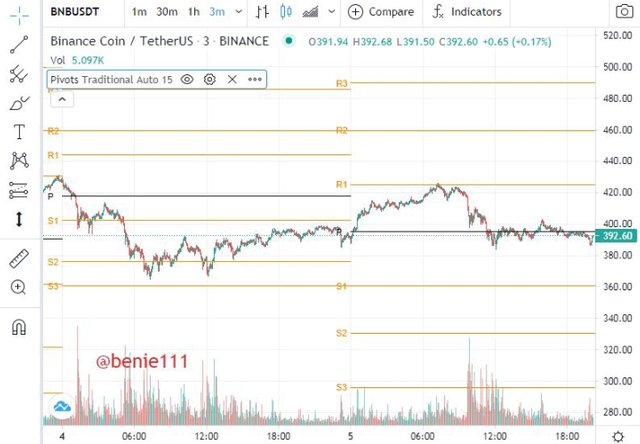
Finally here, I have configured my pivot point on a chart
ANSWER
The Pivot points system uses the trade history of previous trends to forecast future resistances and support in a cryptocurrency market at a given point in time. Because they foretell levels of resistance and support that market prices have not yet reached, pivot points are regarded as predictive indicators. After that, these levels will be used to evaluate if the market is in a breakout or a reversal.

This will assist the trader in determining the optimal time for entrance via support signals, as well as when to exit via resistance indications.
ANSWER
The Pivot Reverse technique is a wonderful way for traders to profit from both bearish and bullish market conditions. The pivot level, which will play a significant role in deciding when is the optimum time to enter and exist point, can be used on a chart to take advantage of distinct trends in an asset's market utilizing the pivot points reversal trading method.
ANSWER
The exchange market is a business place, and also there must be understanding that sometimes, the market deals with supply and demand.
Using the pivot point technique without the discipline of how to follow the pivot point methodology
Many people lack patience, so they jump in too early or are concerned about missing too much of a chance, so they don't watch the signal to trade.
If Traders doesn't pay attention, they might fall for the fake signals, especially on longer timeframes.
ANSWER
Advantages
Pivot points are simple to set up and use on a chart, and they provide unambiguous signals.
The indicator includes many other signals, such as the trend direction, in addition to one of the most important roles, which is the support and resistance levels.
Even if you want to calculate the levels manually, if you know a few figures and the formula, you can do so quickly.
The aim of every trader is to make profit without much stress, pivot points tools can make this work out if we'll utilized
Disadvantages
Pivot levels, especially on longer timeframes, can produce fake signals.
It is difficult for new traders to determine the best entry and exit points.
ANSWER
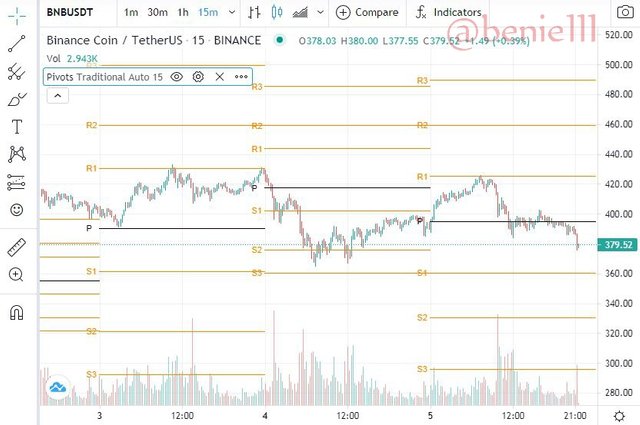
The price was doing very well in a bullish form from the 2nd of June, and came to the pivot point early on the 3rd of June. The trend later continued on the bullish run till on the 4th of June when the price began to drop. The price dropped on the 4th of June, even below the second level of support S2. The price later bounce the S2 crossing over the Pivot point on the 5th. The trend hit the R1 and bounced back to fall below the Pivot point. Presently, the price is still below the Pivot point, but yet to get to the first level of support S1.
Possiblity
The price will fall deeper and continue to be bearish, but possibly, it will not gets to the first support level before the end of the day.
The basic information or your thoughts on the Crypto Coin that you would like to Predict its price for the next 1 week?
ANSWER
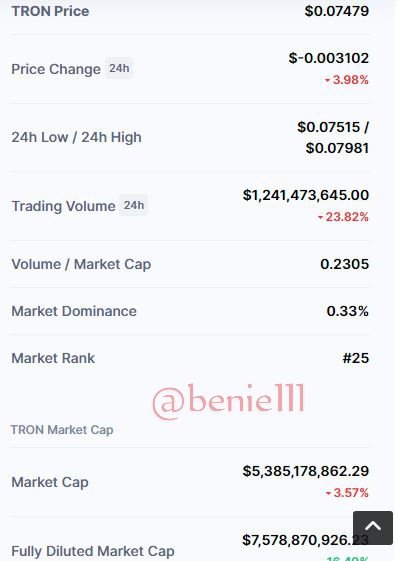
TRX current price is $0.074
TRX market rank is presently at: #25
TRX current market cap is: 5,385,178,862.29
Why TRX
TRX has proved to be an asset with potential.
Tron network charges no fees for transactions
During the middle of April, we have seen the TRX price rose to $0.16 which was really a good move. There is a general bear market in the crypto space presently, and yet, TRX didn't fall to hard. TRX also is rated among the TOP 50 assets which makes the project safe for investors to a certain level.
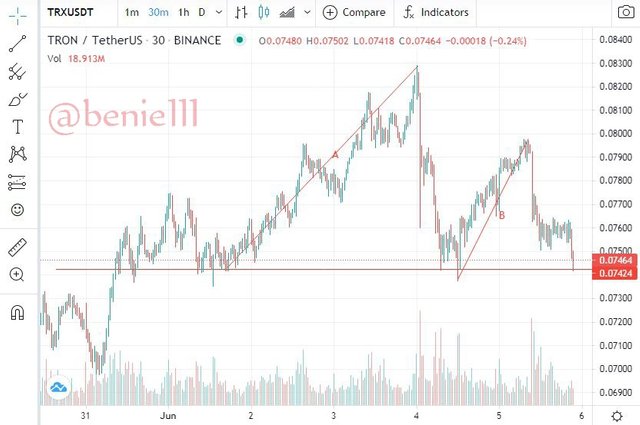
Looking at the price of TRX from the chart we will see that TRX has been maintaining a certain support level of $0.74 for couples of days now, and after which it will rise to an uptrend position. Presently, seeing the price back at $0.74 again tonight, will be a good entry point, as the price is expected to move uptrend from the support level which is $0.74
From Technical study, what will be the possible low level and the high level for the next 1 week?
TRX should possibly go higher upto $0.079 or above in the next one week.
Conclusion
Pivot points is a very good tool to use in technical analysis and mostly useful for traders.
Nevertheless, it is essential the the trader have the knowledge and understanding of how the methodology works before using it, so as to avoid common mistakes and probably to avoid trading in loss too.
Thanks to Prof @stream4u for this week's lecture
Hi @benie111
Thank you for joining The Steemit Crypto Academy Courses and participated in the Homework Task.
Your Homework Task verification has been done by @Stream4u, hope you have enjoyed and learned something new.
Thank You.
@stream4u
Crypto Professors : Steemit Crypto Academy
#affable
Downvoting a post can decrease pending rewards and make it less visible. Common reasons:
Submit