Hello, welcome to Steemit Crypto Academy Season 5, Week 8.
It is another great chance to learn. Thanks to Prof @utsavsaxena11.


What do you understand by ultimate oscillator indicator. How to calculate the ultimate oscillator value for a particular candle or time frame. Give a real example using chart pattern, show complete calculation with accurate result.

The Ultimate Oscillator indicator developed in 1976 by Larry Williams is as its name sounds, an oscillatory class indicator.
The Ultimate Oscillator indicator was made to reduce volatility, address its reading from different time periods so as to give more reliable signals.
The Oscillator Indicator which has become very common among financial entity traders, from the Forex market, stock market to the crypto market is known for its great divergence signals which tell of price either overselling being overbought.
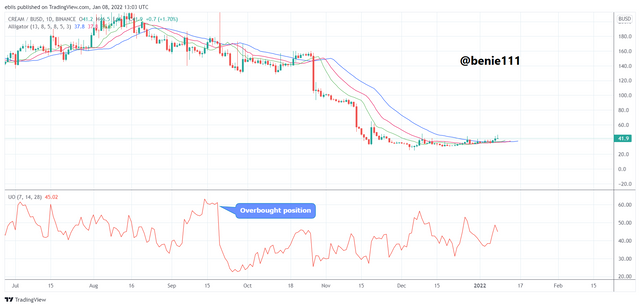
Calculating the oscillator indicator value for a certain candle stick involves some mathematics, so let us hang on.
The Ultimate Oscillator is calculated with two major parameters:
The Buying Pressure (BP), and the True Range (TR)
With the Buying Pressure calculated as the Current close price minus the minimum of the previous price low or close.
PR = Close - Min(Close, Previous Close)The True Range on the other hand is calculated as the maximum of either the current price period high or the previous close, minus the minimum of the current price period low and the previous close.
TR = Max(High,Previous Close) - Min(Low, Previous close)Understanding how these values are calculated, we now calculated them for 7, 14, and 28 periods and then summed them. Then we find their average using different weights, with 7 having a weight of 4, 14 having a weight of 2, and 28 with a weight of 1.
The total calculation is shown in the picture below:
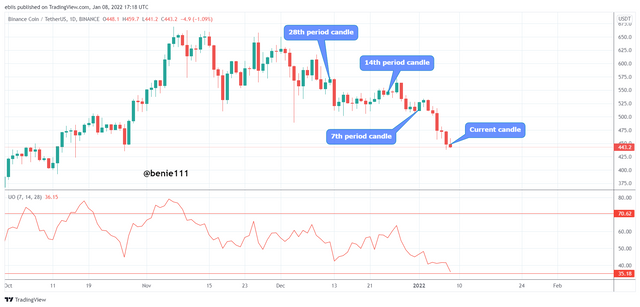
counted the candles, we can now use their historical price, gotten from Cryptodatadownload.com
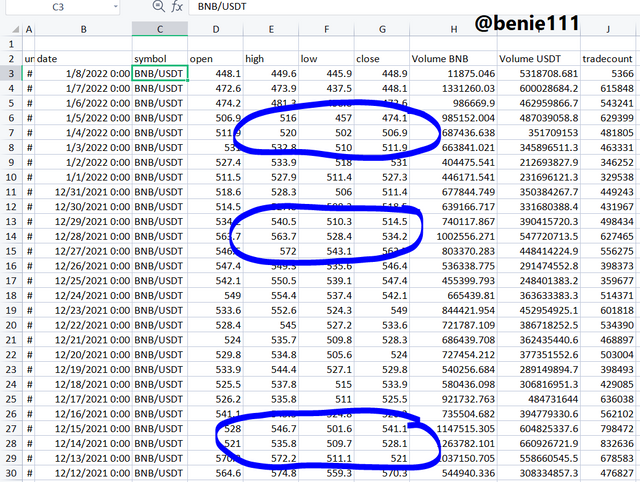
Now we calculate for Buying Pressure: (BP) = Close - MIN(low, PC)

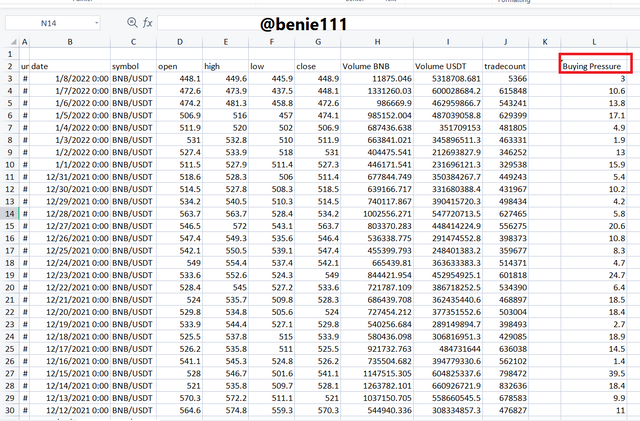
From the above excel sheet, the calculated SUM Buying Pressure for periods 7, 14, and 28 are: (64.3, 137.2, and 334.5)
Calculating for True range,
True range = Max(High, PC) - Min(low, PC)
Using the excel sheet for easier calculation:
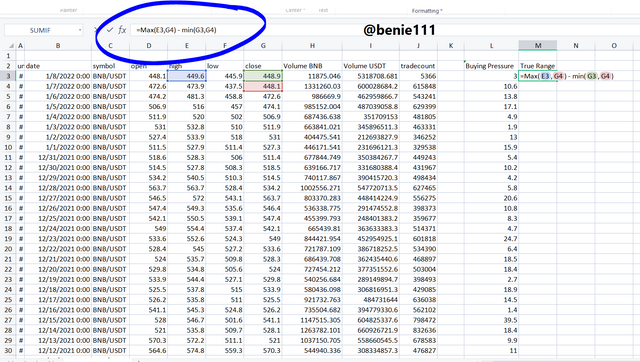
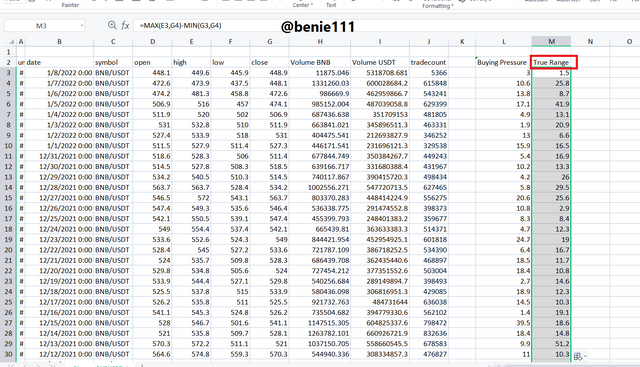
From the above excel sheet, the calculated SUM True Range for periods 7, 14, and 28 are: (118.5, 249.2, and 479.3)
So finding the Averages of periods 7, 14, and 28 are:
A7, A14, A28 are:
(Sum (BY7) / Sum (TR7)),
(Sum (BY14) / Sum (TR14)),
(Sum (BY28) / Sum (TR28)).
A7 = 0.54
A14 = 0.55
A28 = 0.69
Therefore, Ultimate oscillator for next candle = [0.54/1 + 0.55/2 + 0.69/4] * 100 = 98.75
Ultimate oscillator = [40.54 + 20.55 + 0.69]/7 * 100 = 56.42

How to identify trends in the market using an ultimate oscillator. What is the difference between an ultimate oscillator and a slow stochastic oscillator?

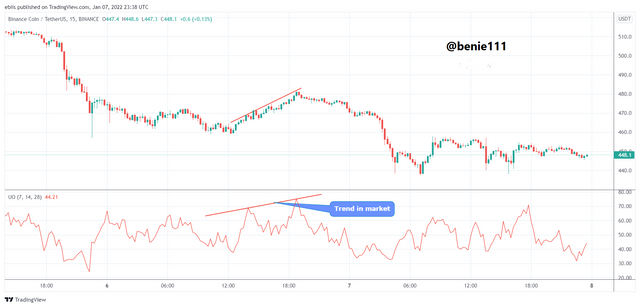
Trend Identification with the Ultimate oscillator is pretty easy, like most oscillator indicators, oversold and overbought positions are known from the indicator margins, (70, 30) for the Ultimate indicator, and (80, 20) on some other indicators.
More, when price hits these levels, traders can now take a cue and enter the market depending on the next trend and how much they trust the market movement.
Looking at the chart below, we can see that the Ultimate indicator has hit the 70 margins, and is starting to trend back down. Price follows suit and we can see the amount of pips traders could have gained from this trend. ‘
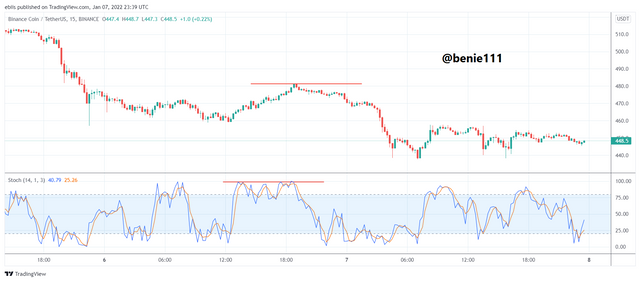
Comparing the Ultimate indicator to the Stochastic Oscillator is like comparing a 100 meters speed relay to a 1500 meters stamina race, though both of them are track and field race events, one is more about speed and quick changes, while the other is about knowing the final direction of price based on the obvious momentum.
The Stochastic indicator is a very fast oscillator indicator. It tries to find short momentum drift of price, therefore allowing traders to make quick price entry on price momentum. The disadvantage of the stochastic indicator is that it may give wrong signals since it is a very fast indicator. For this reason, traders must be cautious using it.
The Ultimate Oscillator on the other hand is slower but tries to give more accurate signals. The Ultimate Oscillator taking data from different price periods and averaging them with different weights tries to give a triple confirmation of market movement there making it more reliable to traders.

How to identify divergence in the market using an ultimate oscillator, if we are unable to identify divergence easily then which indicator will help us to identify divergence in the market.

Divergence is the deviation of price with the Oscillator indicator, signaling traders that either price is experiencing marginal momentum drawdown or marginal momentum increase.
Traders usually use divergence to tell of an incoming breakout, then they can jump into the trade and make a profit.
There are two types of divergence and the Ultimate oscillator indicator can be used to note when either is happening. Let us look at these divergences with the Ultimate oscillator indicator.
Bullish Divergence:
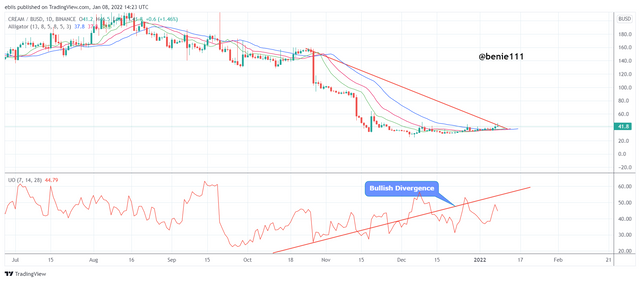
Bullish Divergence occurs when the price is making new lows, but the oscillator indicator is making new highs. This shows that the bulls are gaining the power of the market and the bears are losing their stance.
An example of a bullish divergence is shown below:
Bearish Divergence:
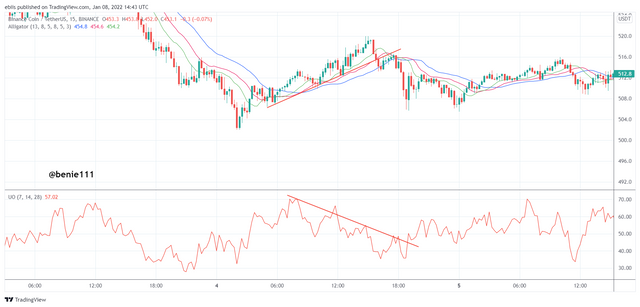
Bearish divergence as we should know is the inverse of bullish divergence. Here price makes new highs while the oscillator indicator makes new lows. This tells us that price is weakening as it is having a marginal momentum decrease and the bears are gaining in on the bulls of the market.
An example of the bearish divergence is shown below:

What is the 3 step- approach method through which one can take entry and exit from the market.
Show real examples of entry and exit from the market.

To make an entry trade with the Ultimate oscillator indicator involves taking 3 major steps to check the trend of the market and more its momentum.
Since the Ultimate Oscillator indicator was made majorly to spot divergence, the first step of the 3 stage approach is to check for divergence.
Buy Entry Divergence
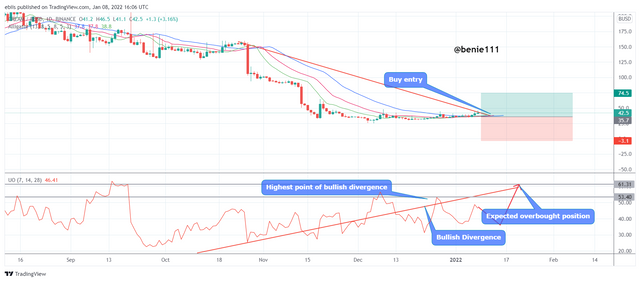
To check for a buy entry divergence, we look for a bullish divergence, as explained earlier, we look for the price making lower lows, but the indicator making higher highs.
Next, we want to confirm that the divergence starts from the over-sold position, this way we can track the oscillator indicator till it shows a new different move of price, so we can enter at such points.
Now we look for our entry position, the entry position for a bullish divergence is when the oscillator has risen above the divergence high. This is after at least two highs of the divergence.
Example of a Buy Entry Divergence is shown in the chart below:
Sell Entry Divergence
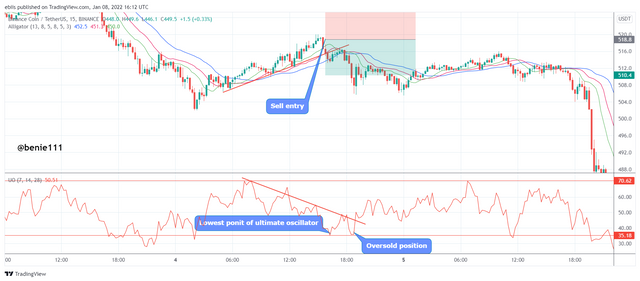
To check for a Sell Entry Divergence, we look for a bearish Divergence, as explained earlier, we look for price making higher highs, but the indicator making lower lows.
Next, we want to confirm that the divergence starts from the over-bought position. This way we can track the oscillator indicator till it shows a new different move of price, so we can enter at such points.
On confirming the above criteria, we now look for our entry positions. The entry position of a bearish divergence is when the oscillator has dropped below the divergence low, at least two lows of the divergence.
Example of the Sell Entry Divergence is shown in the chart below:

What is your opinion about the ultimate oscillator indicator. Which time frame will you prefer how to use the ultimate oscillator and why?

The Ultimate Oscillator indicator is a well-designed indicator as to when it was being designed, its parameters were properly considered to reduce false signals.
My opinion of the ultimate oscillator is that it is a great alternative to the Relative strength indicator, but more it considers different periods and so gives us a composite, but more correct result.
On my choice of time frame, I usually prefer the Daily time frame as most traders usually leave their trade through a day and then make decisions on if to continue holding or change positions, therefore making the daily timeframe a good time frame to watch.

CONCLUSION

In conclusion, the Ultimate oscillator indicator is a great divergence indicator. With its use of three different time periods, it gives a more smoothed-out reading, reducing noise and false signals.
The Ultimate Oscillator indicator should be augmented with other trend indicators such as moving averages so as to have confirmations before entry.
Thanks.