
1. What is your understanding of the TRIMA indicator?

In order to understand the TRIMA indicator, we must first of all start by understanding the Moving Average Indicator. The moving average indicator is a lagging indicator that analyses the past price data of an asset and shows a line that is based on the averaged prices per period. The Moving average indicator has a single flaw which is that it cannot predict price movement but it only shows the price movement after the market opportunity has been confirmed and long gone. Due to this lagging effect, traders have tried to create more effective moving averages such as the exponential moving average, smooth moving average, triple exponential moving average and our topic for today which is the Triangular Moving Average.
The triangular moving average(TRIMA) is a moving average that averages the Simple Moving Average and thus creates a more smooth moving average that does not succumb to volatile changes in the price of the asset. It is created with the use of simple moving averages (SMA). The SMA is a moving average that draws a line that is based on the average prices of the asset per th defined period.
The TRIMA indicator uses the SMAs to create a more smooth and effective moving average as it doesn't react quickly to the changes in the movement of the price, but rather shows a clear path of the price and eliminates the noise which is found in the SMA. The TRIMA being a noise-free indicator, is a very effective indicator to be used to identify and analyze trends by traders. This is because the TRIMA reacts slowly to the changes in the price which is very common in a volatile market like the crypto market, and thus gives a clear analysis and representation of the market phase ( whether a trend or a range).
Also, another very important aspect of the TRIMA is that, not only can it identify trends and ranges but it can also give a good market entry and exit opportunities when it is used in confluence with other technical tools and indicators. This makes the TRIMA indicator a very effective moving average.

2. Setup a crypto chart with TRIMA. How is the calculation of TRIMA done? Give an illustration. (Screenshots required).

How to setup the TRIMA in a crypto chart.
- Firstly, we will go to the platform https://www.tradingview.com/ and select a suitable chart.
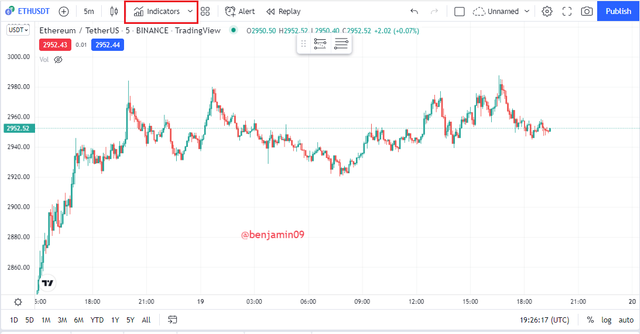
- Secondly, we will tap on the highlighted icon below which represents indicators.
- Next, we will type in "Triangular Moving Average" in the search bar and click on it to add it to the chart.
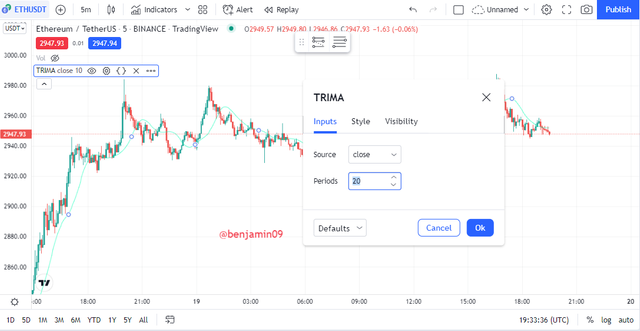
- From there, we click on the highlighted icon below in order to adjust the period. I select the 20 period as was used by Professor @fredquantum in his post.

How is the calculation of TRIMA done?
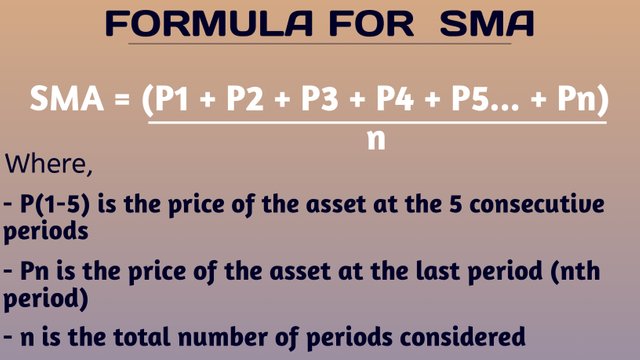
In order to calculate the TRIMA, we will first need to understand the SMA as we said above that the TRIMA is calculated using the SMA. The image above shows the calculation of the SMA.
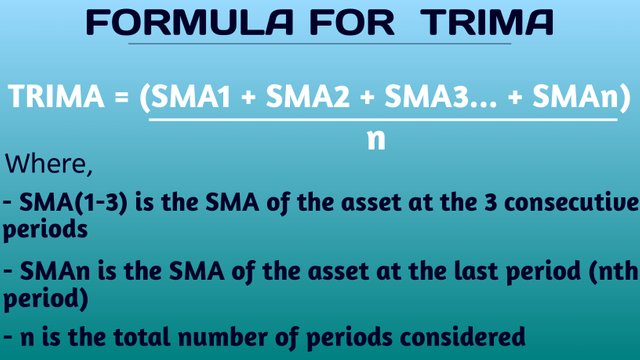
Now that we have understood the SMA, we can now understand the calculation of the TRIMA. The image above shows the calculation of the TRIMA with the use of the SMA.

3. Identify uptrend and downtrend market conditions using TRIMA on separate charts.

The TRIMA is an indicator is best used for trending markets, as it will be able to give the trader necessary information about the current market trend. But this will all depend on the period which the trader used for the TRIMA, as the shorter timeframes will lead to the price being closer to the TRIMA and the longer timeframes leading to the price being further away from the price. Let us now see how to identify either of the trends using the TRIMA indicator.

Uptrend with TRIMA.
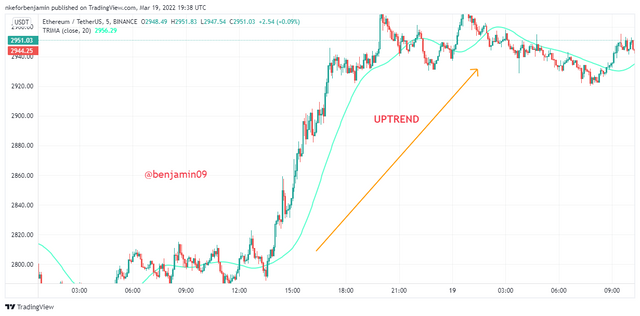
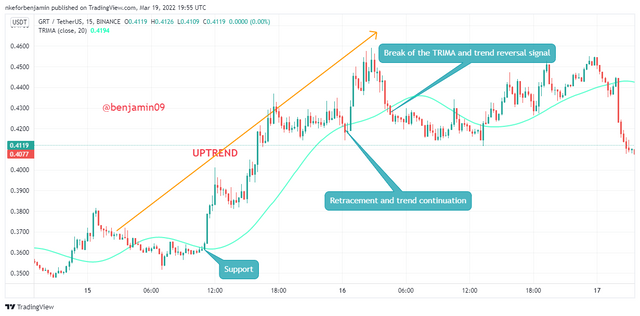
In an uptrend, the TRIMA will identify this trend by being below the price. This means that, during an uptrend, the price will be rising above the TRIMA line and the TRIMA line will act like a dynamic support line where trend continuations and reversals can be seen. We will discuss more on the dynamic support TRIMA in the following question. Let us see an example of an uptrend as is identified by the TRIMA indicator.
As is seen in the above chart, we can see the price steadily rising above the TRIMA. This is an indication of an uptrend as was determined above. The TRIMA line is seen below the rising ETHUSDT price.

Downtrend with TRIMA.
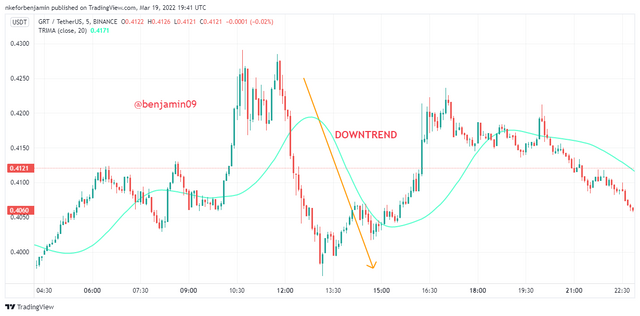
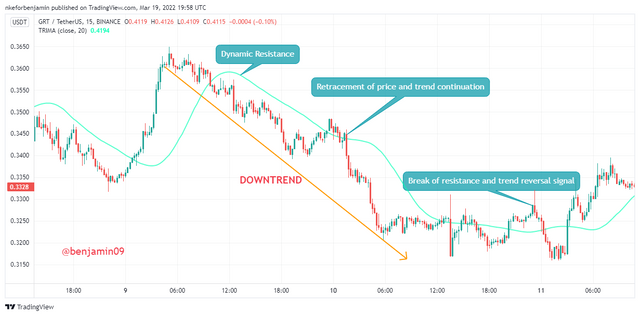
As for the downtrend, the TRIMA line will be above the price as there is a major fall in the price. The TRIMA line acts like a dynamic resistance line during the downtrend as there are several trend continuations and trend reversals. An example of a downtrend with TRIMA can be seen below.
From the above GRTUSDT chart, we can see a downtrend as is identified by the TRIMA line. We can see the TRIMA line above the price as there is a major bearish movement in the price.

4. With your knowledge of dynamic support and resistance, show TRIMA acting like one. And show TRIMA movement in a consolidating market. (Screenshots required).

As we discussed above, the TRIMA lines help to identify uptrends and downtrends. This is because, the TRIMA acts like a dynamic resistance line during a downtrend and a dynamic support line during an uptrend. Let us see them individually below.

Dynamic support with TRIMA.
During an uptrend, the TRIMA acts like a dynamic support line such that, when there is a retracement during the uptrend, the price goes down and bounces off the TRIMA line and there is a trend continuation as the price resumes its original uptrend. Also, when the price has hit the TRIMA line severally, it becomes weak and therefore, it gets broken. A break of the dynamic support line can act like a bearish reversal signal. Let us see an example below.
In the above chart, we can see the price in an uptrend, as the TRIMA line is below the price. Also, we can see that, as the price moves away from the trend and towards the TRIMA line, the price bounces off the TRIMA line and moves back upwards. When the TRIMA line becomes weak, there is a breakout which acts like a bearish reversal signal.

Dynamic Resistance with TRIMA.
Being the opposite of the uptrend, during a downtrend, the TRIMA acts like a dynamic resistance line such that, when there is a retracement during the downtrend, the price goes up and bounces off the TRIMA line and there is a bearish trend continuation as the price resumes its original downtrend. In addition, when the price hits the TRIMA resistance line severally, it becomes weak and therefore, it is bound to get broken. A break of the dynamic resistance line can act like a bullish reversal signal. Let us see an illustration below.
In the above chart, we can see the price in a downtrend, as the TRIMA line is above the price and it acts like a dynamic resistance line. Also, we can see that, as the price moves away from the trend and upwards towards the TRIMA line, the price bounces off the TRIMA line and moves back downwards towards the original bearish trend. When the TRIMA line becomes weak as is seen from the several touches, there is a breakout which acts like a bullish reversal signal and the end of the bearish trend.

Consolidating market analysis with TRIMA.
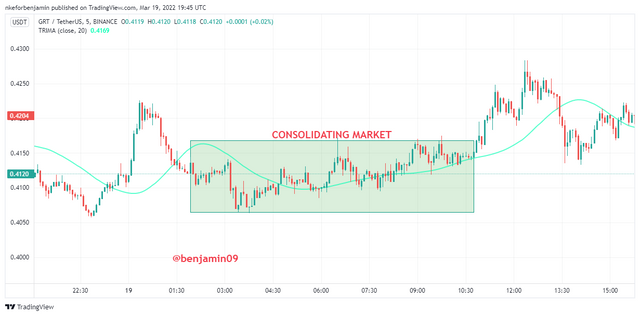
During a consolidating or ranging market, there is no major price movements or direction. The market just keeps moving in an undecided manner as the big hands of the market are gathering liquidity for whatever market direction they intend to fund. During this period, the TRIMA line can be seen just crossing the price up and down as there is no major price movement. This also comes to explain the fact that, the TRIMA indicator is a trend-based indicator. We can see an example in the chart below.
In the above GRTUSDT chart, we can see the chart in a consolidating market as there is no major price movement. The price can be seen crossing the TRIMA line up and down but there is no major movement for the price to remain above of below the TRIMA line.

5. Combine two TRIMAs and indicate how to identify buy/sell positions through crossovers. Note: Use another period combination other than the one used in the lecture, explain your choice of the period. (Screenshots required).

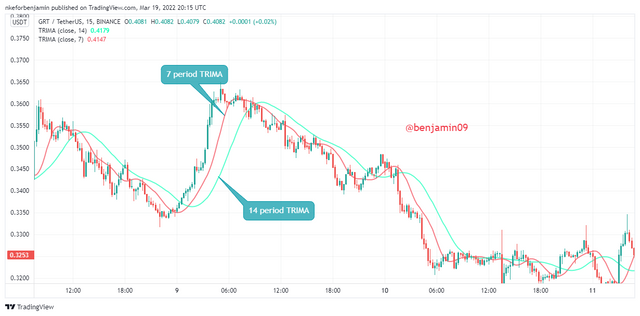
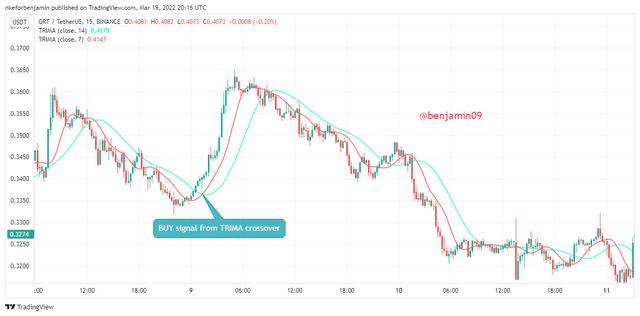
For this exercise, I will be using the 7 period TRIMA as my fast moving TRIMA and the 14 period TRIMA as my slow moving TRIMA. I prefer to use this period for my strategy because I am a scalp trader and I like to trade using market price changes. If I was a swing trader, I would have preferred longer timeframes such as 200, 50, 89 etc, so as to show the general market movement and eliminate noise. We can see the TRIMAs below.
The red line is the 7 period fast moving TRIMA and the green line is the 14 period slow moving TRIMA.

How to identify a buy position with TRIMA indicator.
In order to identify a buy signal using the TRIMA lines, we will have to wait and observe an upward cross of the fast moving TRIMA(7 period) over the slow moving TRIMA (14 period). This will give a good buy signal. This means that the 7 TRIMA will cross over the 14 TRIMA for there to be a good buy signal.
In the above chart, we can see the 7 TRIMA line crossover the 14 TRIMA line. Just as we just said above, this indicates an entry signal into the buy market.

How to identify a sell signal with TRIMA.
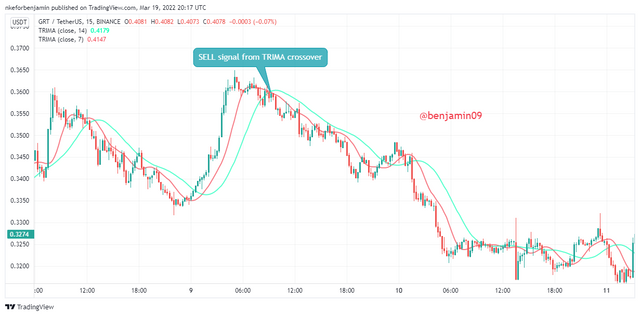
In order to identify a sell signal, there will have to be a downward cross of the fast moving TRIMA (7 period) below the slow moving TRIMA (14 period). This means that, there is sell signal when the 7 TRIMA line crosses below the 14 TRIMA line.
In the above chart, we can see the 7 TRIMA line crossing below the 14 TRIMA line. Just as said above, this is a good sell signal.

6. What are the conditions that must be satisfied to trade reversals using TRIMA combining RSI? Show the chart analysis. What other momentum indicators can be used to confirm TRIMA crossovers? Show examples on the chart. (Screenshots required).

Trend Reversal using TRIMA and RSI.
The TRIMA indicator is a good indicator that helps gives buy and sell signals but since it is a lagging indicator, it is best to trade in confluence with other technical tool and indicators. So, I will show the trading criteria for trend reversals using TRIMA and the RSI indicator.

Bullish Reversal.
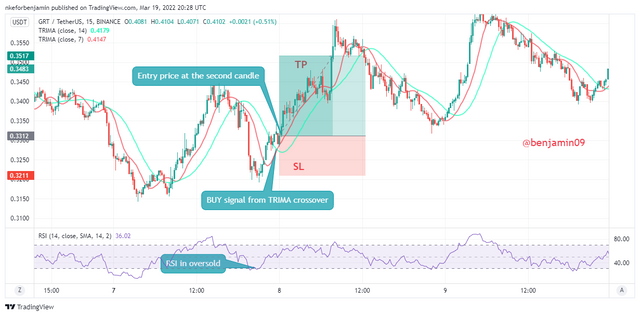
The trade criteria for the bullish reversal is as follows.
- Add your indicators (2 TRIMAs and RSI).
- Secondly, observe the market and check the price in the RSI. If the RSI enters the oversold region below 30, it is a bullish reversal signal. Also, if the RSI crosses 50 moving upwards, it is also a good bullish signal.
- Thirdly, observe a cross of the fast moving TRIMA (7 TRIMA) over the slow moving TRIMA (14 TRIMA) which acts like a bullish reversal signal as was determined above.
- Next, find your entry position into the bullish market after waiting a few candlesticks to confirm the movement.
- Lastly, determine your exit positions in such a way that the risk management is good. The stop loss should be below the crossover and the take profit should be such that the risk:reward ratio is 1:1 and above so that the reward is always greater than the risk.
In the above screenshot, all the trade criteria for a bullish reversal have been observed. We see the RSI in the oversold region, and then later on, the crossover of fast over slow occurs. The entry point is a few candlesticks away from the crossover and the exit point is such that the stop loss is below the crossover and the take profit is such that the risk:reward ratio is 1:2.

Bearish reversal.
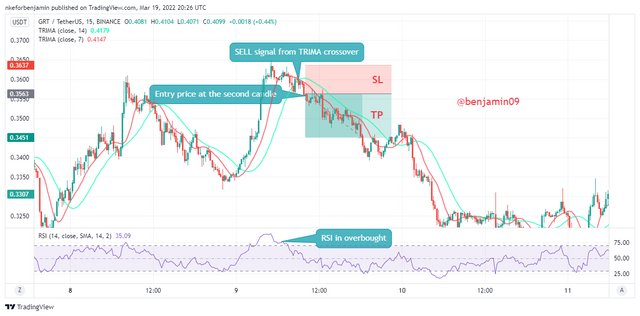
The trade criteria for the bearish reversal is as follows.
- Add your indicators (2 TRIMAs and RSI) as usual.
- Secondly, observe the market movements and check the price direction in the RSI chart. If the RSI enters the overbought region above 70, it is a bearish reversal signal. Also, if the RSI crosses 50 moving downwards, it is a good bearish signal.
- Thirdly, observe a cross of the fast moving TRIMA (7 TRIMA) below the slow moving TRIMA (14 TRIMA) which acts like a bearish reversal signal as we already said above.
- Next, find your entry position into the bearish market after a few candlesticks have formed so as to confirm the bearish movement.
- Lastly, determine your exit positions such that the risk management is good with low risk. The stop loss should be above the crossover and the take profit should be such that the risk:reward ratio is 1:1 and above such that the reward is always greater than the risk.
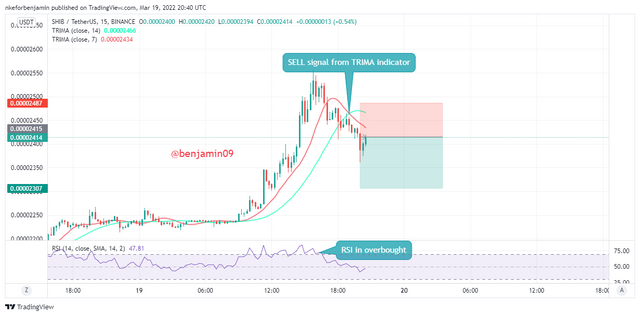
In the above chart, we can see the RSI in the overbought region. Later, we see the cross of the 7 TRIMA below the 14 TRIMA also giving a bearish reversal signal. We then find our entry point a few candlesticks into the bearish movement. The stop loss is above the crossover and the take profit is such that the risk:reward ratio is 1:1.5.

Trend Reversal using TRIMA and Stochastic Oscillator.
Let us now observe the trade criteria for the TRIMA in confluence with a favorite indicator of mine, the Stochastic Oscillator.

Bearish reversal.
The trade criteria for the bearish reversal using TRIMA and Stochastic is as follows.
- Add your indicators (2 TRIMAs and Stochastic).
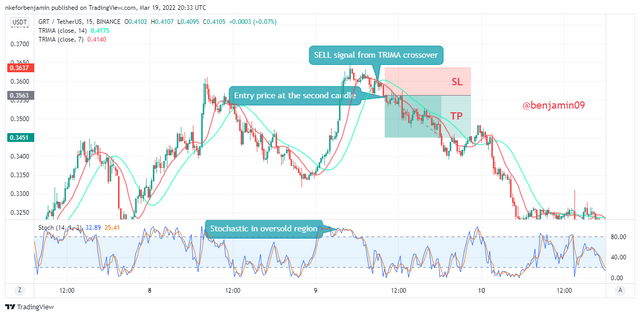
- Secondly, observe the market movements and check the price direction in the Stochastic chart. If the Stochastic enters the overbought region above 70, it is a bearish reversal signal.
- Thirdly, observe a cross of the fast moving TRIMA (7 TRIMA) below the slow moving TRIMA (14 TRIMA) which acts like a bearish reversal signal as we already said above in question 5.
- Next, find your entry position into the bearish market after a few candlesticks have formed so as to confirm the bearish movement.
- Lastly, determine your exit positions such that the risk management is good with low risk. The stop loss should be above the crossover and the take profit should be such that the risk:reward ratio is 1:1 and above such that the reward is always greater than the risk.
The above chart shows the cross of the Stochastic in the overbought region moving down. This is a bearish reversal signal. The downard cross then happened and as was predicted the price was falling. The entry is a few candles below and the closing positions placed as well.

Bullish reversal.
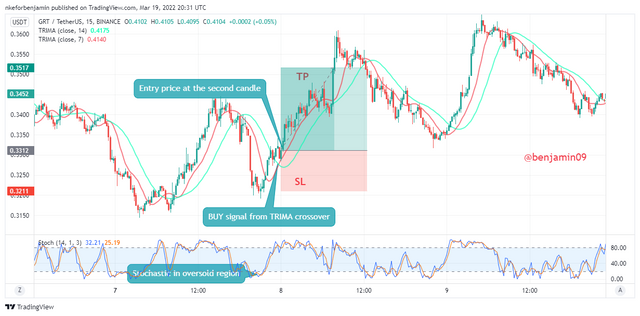
For the bullish reversal, we will observe the Stochastic have an upward cross while in the oversold region. Then, there will be a crossover of the 7 TRIMA over the 14 TRIMA. The entry is a few candles later and proper risk management is used for the closing positions.
The above GRTUSDT chart shows the Stochastic experience an upward cross in the oversold region. Few candles later, there is an upward cross of the 7 TRIMA over the 14 TRIMA. We can see the entry position a few candles above the crossover and the closing positions already placed with proper risk management technique.

7. Place a Demo and Real trade using the TRIMA reversal trading strategy (combine RSI). Ideally, bullish and bearish reversals. Utilize lower time frames with proper risk management. (Screenshots required).

Bearish demo trade on the SHIBUSDT chart
From the above chart, we can see that the RSI was just in the over sold region above 70 and staretd moving downwards. This is my first selling signal. Next, we can see the downward cross of the 7 TRIMA below the 14 TRIMA. This is my last selling signal. I place my sell order a few candles below this crossover. My stop loss is above the crossover whereas my take profit is such that the risk:reward ratio is 1:1.5. The image below shows the proof of the transaction that was taken using my paper trading account on the Tradingview website.

Bullish real trade on the DOTUSDT chart
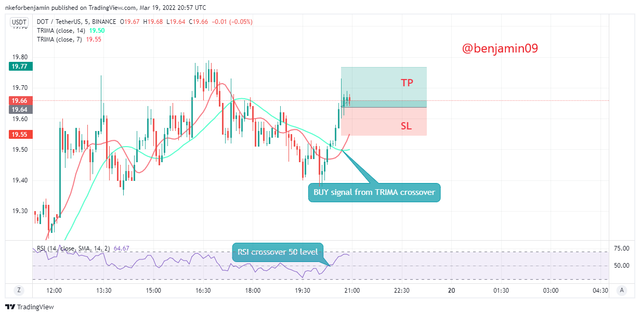
In the above DOTUSDT chart, we can see that the RSI had hit the oversold price of 70 and started moving upwards and crossed the 50 level. This is my first buying signal. We can see on the chart the upward cross of the 7 TRIMA over the 14 TRIMA. This is the second buying signal. I place my entry into the bullish market. My stop loss is below the crossover and the take profit is such that the risk:reward ratio is 1:1.5.
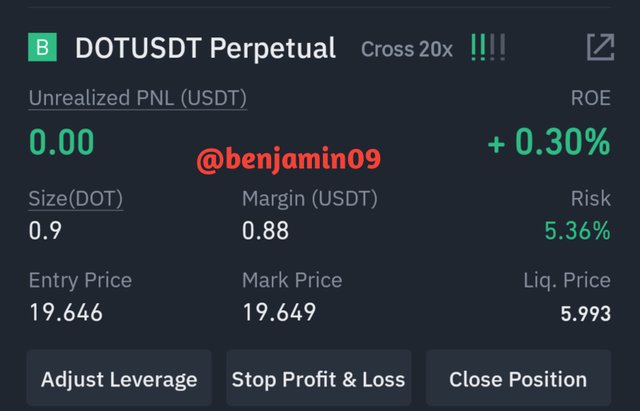
Binance mobile app
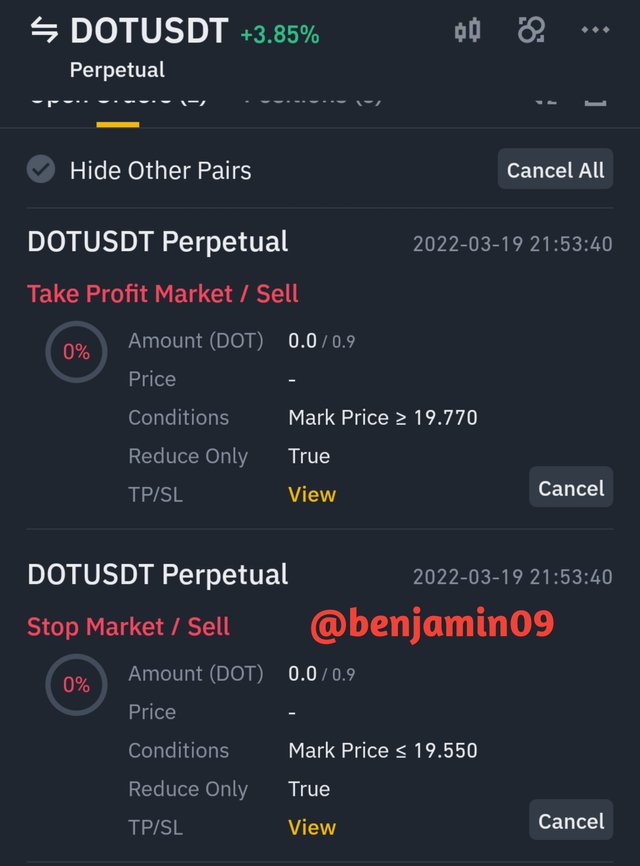
Binance mobile app
I placed my trade with the use of my Binance futures account as the above screenshots can justify.

8. What are the advantages and disadvantages of TRIMA Indicator?

Advantages of TRIMA.
- Firstly, the TRIMA indicator helps to identify trends as we saw in question 3.
- Secondly, the TRIMA indicator helps to reduce unnecessary noise by averaging the SMAs creating a smooth and accurate indicator.
- Thirdly, entry positions into the market can be gotten through the use of trend continuations and reversals that are easily identified with the dynamic support or resistance forms which the TRIMA takes. We saw this in question 4.
- We can get buying and selling signals into the market when a fast and slow TRIMA lines are used to determine crossovers as we saw in question 5.
- We can also get good trading signals and profitable trades when we trade using the TRIMA in confluence with other indicators.

Disadvantages of TRIMA.
- The TRIMA indicator must be used with other indicators in order for a trade to be placed. An entry position must be derived only through confluence trading despite its numerous benefits.
- The TRIMA indicator though smoothened, still remains a moving average and thus, lags behind the price as only past data is used to create the line. A majority of the trend is therefore lost due to this.

Conclusion.

Just like we have seen above, the TRIMA indicator is a wonderful trend-based moving average indicator which has so many benefits to the traders that use it. But beware of the limitations of this indicator as entry positions can be gotten only with the use of other technical tools. But this entry position is also at a position where the trend movement has already happened for a while. But anyways, it was a wonderful lesson by Prof @fredquantum.
Thank you for reading.
@fredquantum
