
Theory
1. Define in your own words what Price Action is?

Price Action refers to the study of the observation and analyzing of the price of a currency independent of any external factors that may influence the price in any way. The price action technique, is being used by traders as an alternative to technical indicators. The traders follow the recent price action and changes in the price and this helps him to place his trade at the optimal point that will bring in the highest profits.
The Price action technique refers to observing the movement of the price of a currency and using the data from the analysis, to place trades at the perfect entry points and also, close the trades at the optimal exit point.

2. Define and explain in detail what the "Balance Point" is with at least one example of it (Use only your own graphics?)

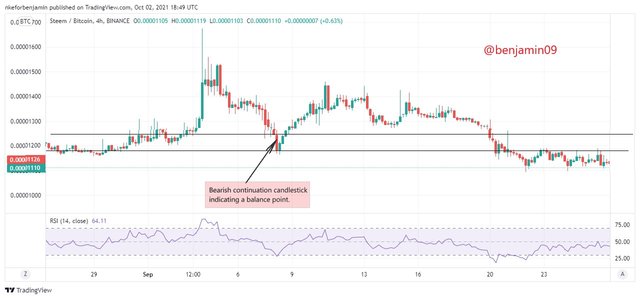
The break even point or the balance point refers to the last candle stick which can be identified at the end of a retraced trend. For identification of the balance point, the trader needs to find the last candlestick at the end of the continuity of the trend and two horizontal lines be drawn; one at the top, and the other line at the bottom of the candlestick. When this is done, the trader has identified the balance point and with this data, can use on the trade to be placed.

Screenshot taken from tradingview
From the above screenshot, we can see the last red candlestick of the continuation which indicates it as the balance point. The two horizontal lines are being placed both at the top and at the bottom and these lines help the trader to make his trade.

3. Clearly describe the step by step to run a Price Action analysis with "Break-even"?

The step by step procedure to run a Price Action analysis with breakeven are as follows:
Firstly, we identify the timeframe which we are going to use for our trades. The timeframes vary and should be selected based on the trading style of the trader.
If it is a scraper, or someone who likes making short term profits, the trader should use 1 hour time frame or the 15 minutes tameframe.
If it is a trader who likes long term trades and does not want instant profits, the trader should use 4 hour timeframe.Next, the trader will go to the chart, and mark the areas where the price reacted with horizontal lines. The essence of marking these relevant points, is to keep them to be used for future take profits.
And lastly, the trader has to observe the market's current trend and mark all of the balance points. After this is done with, the trader finds possible market entries that will give the optimal result required by the trader.

4. What are the entry and exit criteria using the breakeven price action technique?

The criteria which is being used to determine the entry and the exit point of a trade when using the break even point as a price action technique are as follows.
The Entry Point Criteria
Before a trader wants to first of all determine his entry point into a trade while using the price action technique of break-even, he must have identified and marked with horizontal lines, the candlestick that forms the balance point. Once the horizontal lines have been placed both above and below the last candle of the trend, the trader may now decide on his entry point.
- If the price breaks the break even point and goes up, this means there is a rise in the price and the trader should thus, place a buy order.
- And if the price breaks the breakeven point and moves downward, it therefore means that the price is falling and the trader should place a sell order.
These are the criteria for the point of entry for the Price Action technique using the break even method.
The Exit Point Criteria
After the trader has placed his trade depending on the direction that price broke from the break even point, the trader should therefore, input his stop loss price and his take profit price.
- The Stop loss price should be above the price if price broke downwards and entered a sell. And the stop loss price will be below the price if the price broke upwards and entered a buy.
- The Take profit price should be in proportion to the price as the Stop loss price. This means that, if the trader put the stop loss price 2% away from the current price, the take profit should also be put 2% away from the current price.

5. What type of analysis is more effective price action or the use of technical indicators?

This question will mostly determine on the trader but if you ask me, I think that Price Action is better than the Technical Indicators and I will explain more on in this using this table.
| The Price Action is very easy to use. This goes for the break even technique. | The technical indicators are a bit tricky and difficult to use |
| Price Action is faster to use and gives really high profits since the trader enters at the optimal timing. | Technical indicators, more precisely lagging indicators reduce the amount of profits which a trader could make. |
| The chances of obtaining successful trades using Price Action are higher. | The success rate in trades is lower using Technical Indicators. |

Practice (Only Use your own images)
Make 1 entry in any pair of cryptocurrencies using the Price Action Technique with the "Break-even Point" (Use a Demo account, to be able to make your entry in real time at any timeframe of your choice)

Before I placed my trade, I had to make sure that the break even technique of the Price action method was in correspondence with the trade.

Screenshot is taken from Tradingview
So, from the above screenshot, we can see that the last candlestick of the trend was used as the balance point with the horizontal lines both at the top and at the bottom of the candlestick.
And, also, from the screenshot above, the candlesticks just crossed the line below and started moving downwards. This is the time for my entry as a sell order.

Screenshot is taken from Tradingview
From the above screenshot, I put my take profit and my stop loss 20 pips away from the current price respectively.

Screenshot is taken from Tradingview
This is a screenshot of my order which has already been placed in my newly created demo account for trading on Tradingview.

Conclusion.

From the above post, I have learned about price action and the break even technique. I have seen the difference between Price Action method and Technical Indicators method in placing a trade. I also know how to place a trade using the break even method.
Thank you for reading.