

1. Explain Puria method indicative strategy, what are its main settings. which timeframe is best to setup this trade and why? (Screenshot needed and try to explain in detail)
The Puria method indicative strategy refers to an effective and efficient trading strategy that follows the market trend and give traders possible entry positions for their daily trades. With the Puria trading strategy, traders can make daily and regular profits making it very comfortable and effective for daily trades.
The Puria Strategy is made up of 3 indicators which are as follows ; 2 Moving Averages and 1 Moving Average Convergence Divergence (MACD). The WMA acts as support and resistance lines which can identify trends and trend reversals while the MACD indicator acts as an indicator for the perfect entry point and exit point into a trade.
In order to set up a Puria Trading Strategy, the 2 Moving Averages will have to be set and the MACD indicator set as well. The best timeframe fit for the Puria Trading Strategy is any timeframe between 5 minutes to 300 minutes. This is because, at any of these timeframes, the indicators are able to analyze and detect any changes in the market trend. This will give a good entry position when using the Moving Averages and the MACD. This timeframe range is best and perfect for intraday trades and entry positions.
Let us look at a practical example below that will further confirm the above information.
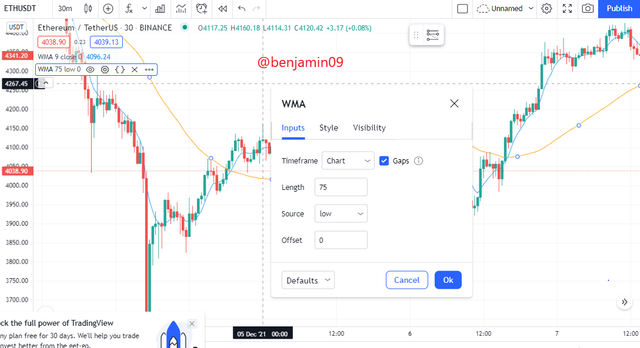
In order to set up a Puria Method Indicative Strategy, we will need to start off by adding the Moving Average Weighted indicators to the market chart.
The first WMA is set to a length of 75, source is low and timeframe is taken from the chart. I have given this line an orange color.
The first WMA is set to a length of 85, source is close and the timeframe is taken from the chart. I have given this line the blue color.
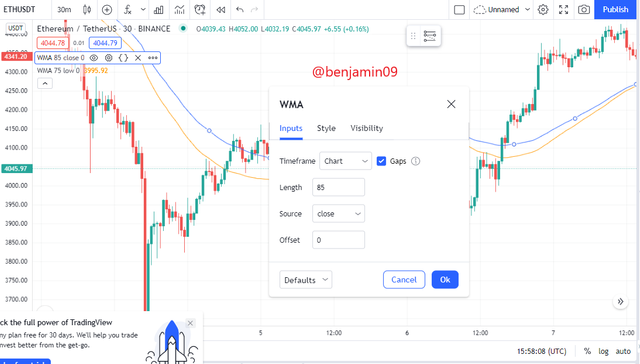
Now that the WMA lines have been added, what is left is the MACD indicator.
For the MACD indicator, the timeframe is taken from the chart, the fast length is 15 and the slow length is 26. The source is close and the signal smoothing is set to 1.
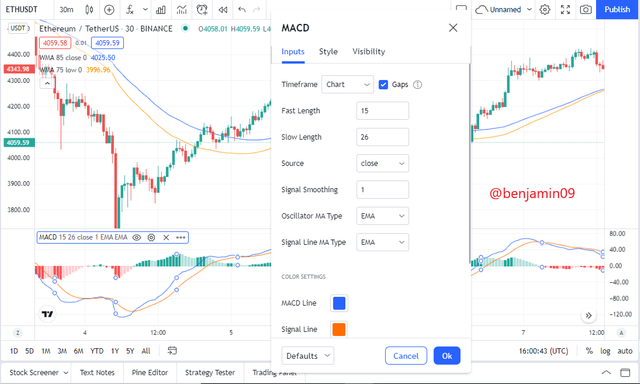
With these, the Puria Method Strategy is complete and the user can use this strategy to perform intraday trading transactions.
The timeframe which I set to use for this strategy is at 30 minutes. I used this timeframe because at this timeframe, any market changes and movements are seen and the trader can easily identify perfect entry and exit points for trading.
2. How to identify trends in the market using the puria method. Is it possible to identify trend reversal in the market by using this strategy? Give examples to support your article and explain them. (screenshot needed)
When using the Puria method strategy, the trader can easily identify trends and will be able to see trend continuations and trend reversals, while using Moving Average Weighted (WMA). When the price remains above or below the WMA lines, it shows a trend. This means that, if the price is moving upwards above the WMA lines, there is a bullish trend and if the price is below moving downwards below the WMA lines, there is a bearish trend.
Also, a trend continuation can be seen when the price moves close to the WMA lines as a means of testing the trend strength, and then later on moves and continues in the original trend. There has been a trend continuation when this occurs. For example, during a bearish trend, the price moves upwards towards the WMA lines and is very close to it, but later on, the price falls and continues in the bearish trend, there has been a trend continuation.
We can identify a signal for a possible trend reversal when we see the price breaks the WMA line and moves in the opposite direction of the original trend. For example, if there is a bearish trend and the price moves upwards and breaks the WMA lines, this indicates a possible trend reversals and all sell trades should be closed.
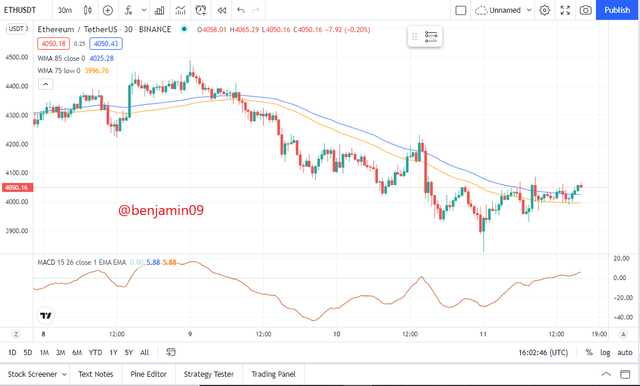
Let us analyze a trend, trend continuation and trend reversal by using the following screenshot of the ETHUSDT currency pair market.
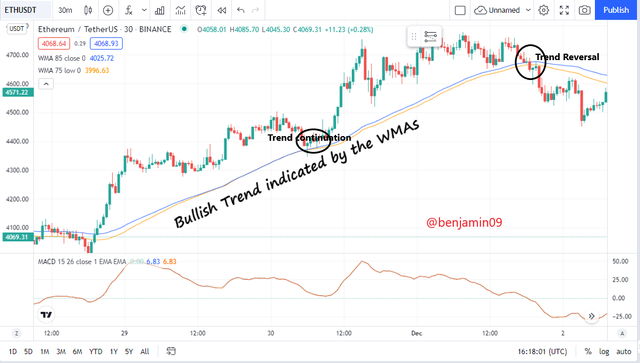
From the above screenshot, we can see that the market of ETHUSDT was in a bullish trend, as the price remained moving upwards above the WMA lines. This is an example of a trend identification using the Puria method.
Also, we can find the trend continuation in the highlighted part that is marked trend continuation. At this point, the price was falling and came so close to the WMA lines just to rise again and continue in its original bullish trend.
We find that there is a trend reversal when the price of ETHUSDT fell and crossed the WMA lines and moved below it. At this point, traders who were buying ETHUSDT should start closing their buy orders and opening the sell order after analyzing in confluence with other indicators.
3. In the puria strategy, we are using MACD as a signal filter, By confirming signals from it we enter the market. Can we use a signal filter other than MACD in the market for this strategy? Choose one filter(any Indicator having 0 levels) and Identify the trades in the market. (Screenshot needed).
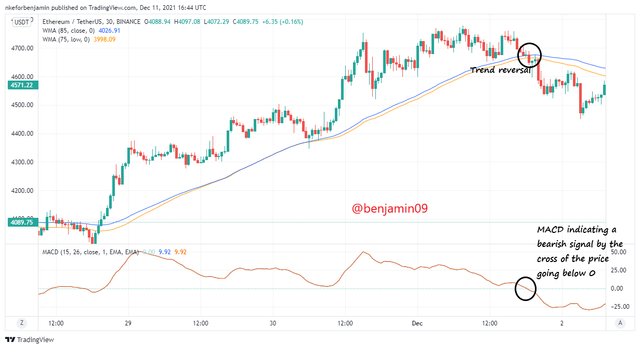
In the Puria strategy, we use the MACD indicator to filter the signals and have perfect entry positions. When the price crosses 0 and goes down, this indicates a good entry position by placing the sell order. And if the price crosses 0 moving upwards, we can say that this is a good entry position to place a buy order.
But there are other indicators that can provide good signals for entry into the market. A good example of this signal filtering indicator is the Stochastic Oscillator.
With the Stochastic Oscillator, when the price enters the overbought region and there is a cross moving downwards, this is a bearish signal and when the price is in the oversold region and there is a cross moving upwards, this is a bullish signal. Personally, I think the Stochastic Oscillator will work perfectly in the Puria Method Strategy as it gives good signals that help filter the signals from the WMA lines.
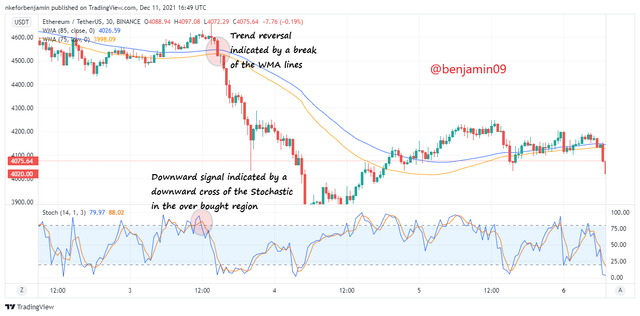
From the above screenshot of the ETHUSDT market, we can see that I replaced the MACD indicator with the Stochastic Oscillator. From the above chart, when the price crossed the WMA lines that act as support lines and came downwards, this acts as a trend reversal with the market entering a bearish phase. When we look below, the Stochastic was in the overbought region and the downward cross occurred at the precise time of the trend reversal indicated by the WMA lines. This acts as a bearish signal that is working in confluence with the WMA lines indicating a downward movement. The trader can place his sell order after seeing these 2 indicators working in confluence to give thesame result.
4. Set up 10 demo Trades (5 buying and 5 selling ) on 5 cryptocurrency pairs using puria method indicative strategy. Explain any 2 of them in detail. Prepare a final observation table having all your P/L records in these 5 trades.
The ten trade setups for 5 currencies are as follows.
ETHUSDT
Bullish trade
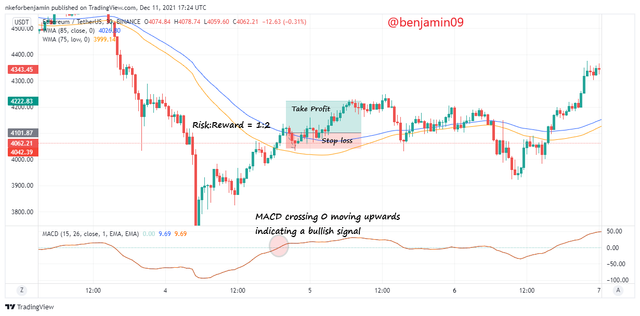
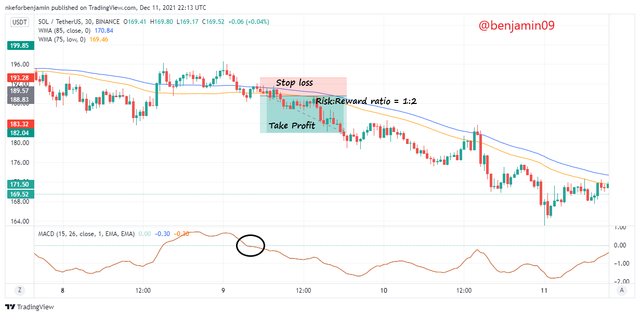
From the above chart, the price of ETHUSDT crossed the WMA lines and moved upwards, this acts as a perfect entry point for placing a buy order. This works in confluence with the MACD line which crosses the 0 line and goes upwards and acts as a bullish signal. I placed the trade. The risk:reward ratio for the above trade is 1:2 such that the level of profit is more than the level of risk.
Bearish trade
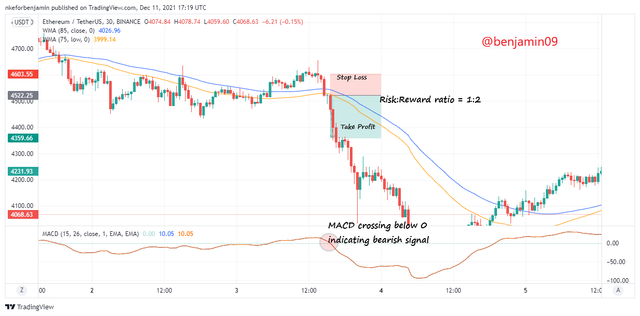
From the above chart, the price of ETHUSDT crossed the WMA lines and moved downwards, this acts as a perfect entry point for placing a sell order. This works in confluence with the MACD line which crosses the 0 line and goes downwards and acts as a bearish signal. I placed the sell order trade. The risk:reward ratio for the above trade is 1:2 such that the level of profit is more than the level of risk.
BTCUSDT
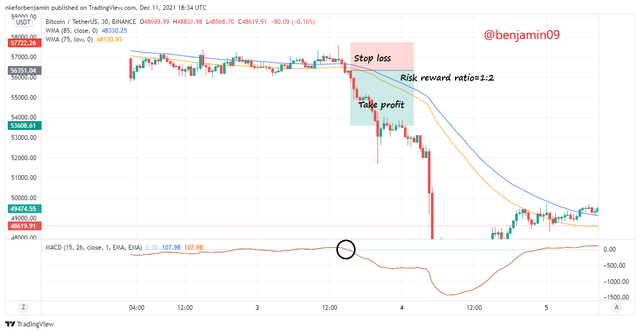
Bullish trade
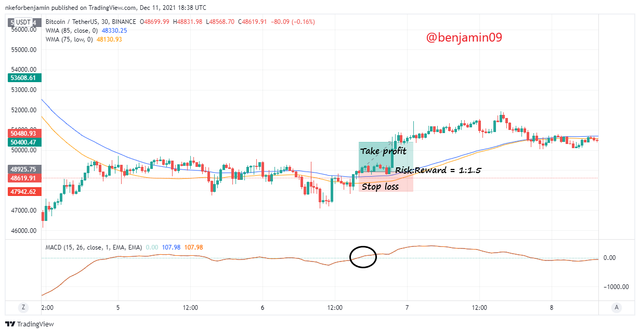
Bearish trade
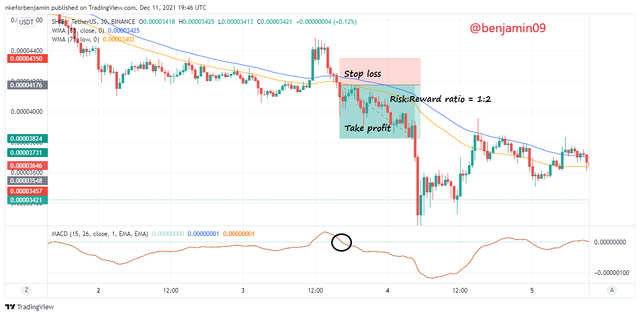
SHIBUSDT
Bullish trade
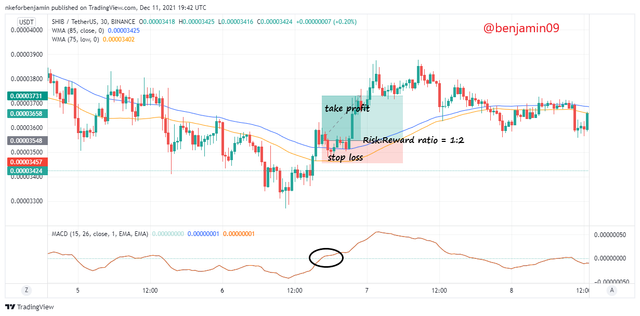
Bearish trade
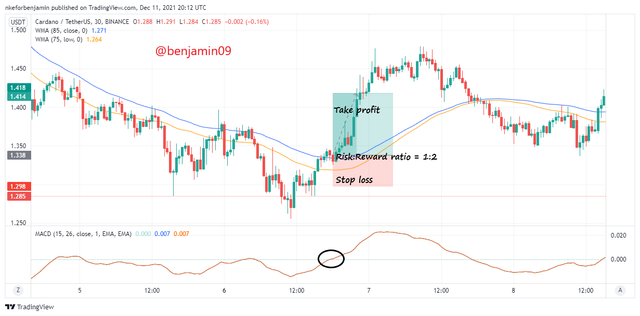
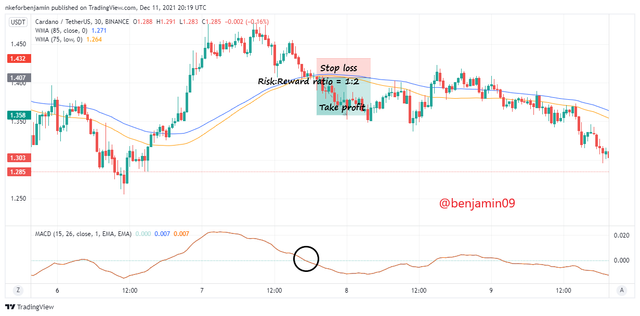
ADAUSDT
Bullish trade
Bearish trade
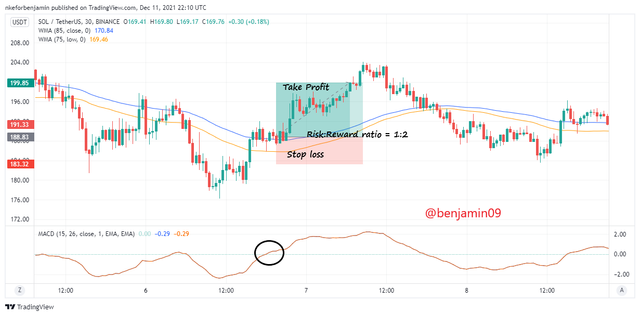
SOLUSDT
Bullish trade
Bearish trade
The table showing the various entry prices and profit and loss levels of the above trades is as follows.
| S/N | Pair | Buying price | Selling price | Profit | Loss | Timeframe |
|---|---|---|---|---|---|---|
| 1 | ETHUSDT | / | 4529.79 | $75 | $37.5 | 30minutes |
| 2 | ETHUSDT | 4101.87 | / | $75 | $37.5 | 30 minutes |
| 3 | BTCUSDT | 48925.75 | / | $27.5 | $15 | 30minutes |
| 4 | BTCUSDT | / | 56351.04 | $30 | $15 | 30minutes |
| 5 | SHIBUSDT | / | 0.00004176 | $30 | $15 | 30minutes |
| 6 | SHIBUSDT | 0.00003548 | / | $30 | $15 | 30minutes |
| 7 | ADAUSDT | 1.338 | / | $30 | $15 | 30minutes |
| 8 | ADAUSDT | / | 1.407 | $30 | $15 | 30minutes |
| 9 | SOLUSDT | / | 189.57 | $30 | $15 | 30minutes |
| 10 | SOLUSDT | 188.83 | / | $30 | $15 | 30minutes |
5. You have to make a strategy of your own, it could be pattern-based or indicator-based. Please note that the strategy you make must use the above information. Explain full strategy including a time frame, settings, entry exit levels, risk managment and place two demo trades, one for buying and the other for selling.
In order for me to make my strategy, these are the steps in determining the strategy which I prefer.
- I will be using my strategy to trade in the Crypto market as well as the Forex market.
- I like trading within a short timeframe so I will choose the 30 minutes timeframe where I can see the market changes and make my daily intraday trades.
- I will use the 7 period MA and the 14 period MA, such that I will use the golden cross of the 2 MAs as the perfect entry and exit points. Once the 7 MA crosses the 14 MA downwards, this is an entry point to sell and when the 7 MA crosses the 14 MA upwards, this is an entry point to buy.
- Risk:Rewards ratio will be set to 1:2 such that the ratio of rewards is twice the ratio of risk.
- I will use the Stochastic Oscillator to filter false signals and indicate good signals for trends and trade entries and exits. When the green stochastic line crosses the red moving downwards while in the Overbought region, this is a sell signal or a bearish signal. And when the green stochastic line crosses the red moving upwards while in the oversold region, this is a buy signal or a bullish signal.
Let us now examine this strategy with trade entries and exits in the following images.
Bearish Trade.
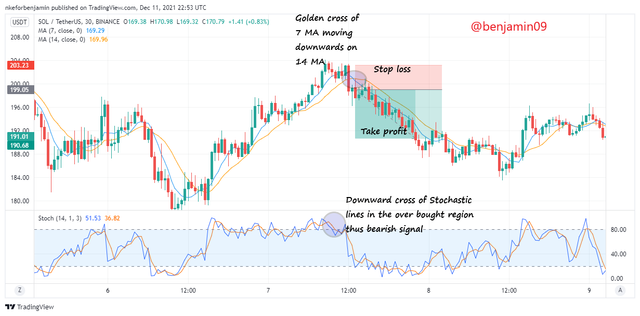
From the above chart of SOLUSDT, we can see that there is a downward cross of the Stochastic chart while in the Over bought region and this acts as a bearish signal. Few moments later, we can see the downward cross of the 7 MA on the 14 MA. This confirms the bearish signal and acts as an entry point into the market.
The Take Profits and Stop loss are both set such that, the risk:reward ratio is 1:2 making profits more than the losses.
Bullish Trade.
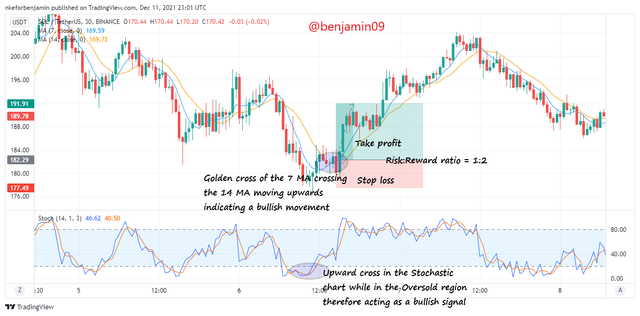
From the above chart of SOLUSDT, we can see that there is an upward cross of the Stochastic chart while in the Over sold region and this acts as a bullish signal. Few moments later, we can see the upward cross of the 7 MA on the 14 MA. This confirms the bullish signal and acts as a perfect entry point into the bullish market.
The Take Profits and Stop loss are both set such that, the risk:reward ratio is 1:2 making profits more than the losses.
Conclusion.
The Puria Method Indicative Strategy is a really efficient trading strategy that helps intraday traders get effective trades that yield small and regular profits. This trading strategy is very efficient and with this, traders can place their daily trades and make regular profits that is convenient for the trader. With the Puria Method Indicative Strategy, 3 indicators are used; 75 length WMA, 85 length WMA and the Moving Average Convergence Divergence (MACD). These 3 indicators have to work in confluence in order to create perfect entry points and exit points.
Thank you for reading.
CC : @utsavsaxena