Here is a link to the post.
API3USDT BUY - Steemit Crypto Academy | S6W1 | Team Trading Contest Post for Reminane | by @benjamin09
Greetings friends and welcome to my crypto academy trading contest post on the cryptocurrency pair API3USDT.


The name and introduction of the project token, and which exchange it can be traded on, project/team/technical background, etc.

Introduction of the token.
API meaning Application Programming Interface are created to solve the problem of accessing dependable data that is unsolved by smart contracts. API3 is made up of APIs in the blockchain system that give timely and reliable data and therefore monetize and scale the blockchain. This project was unraveled in September 2020 by 3 founders; Heikki Vanttinen, Burak Benligiray and Saša Milić. We can see more about API3 below.
Exchange platforms available for this token.
Project/team/technical background.
- Price : $6.59
- Rank : #179
- Market Cap : $243,287,374
- Fully Diluted market cap : $727,955,253
- 24H Volume : $119,259,575
- Circulating Supply : 36,907,810.00 API3
- Max Supply/Total Supply : 110,978,134
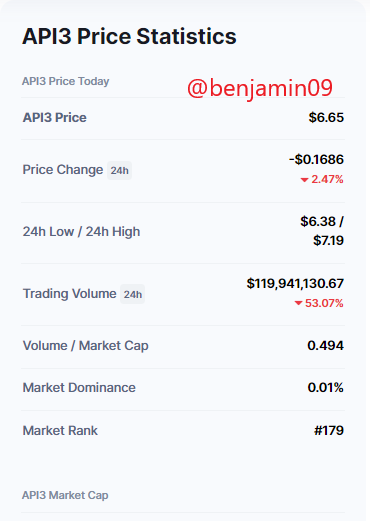
Source
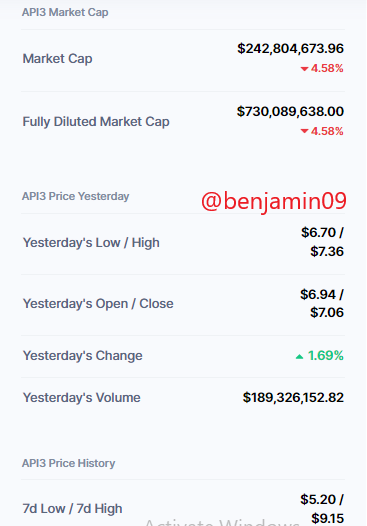
Source
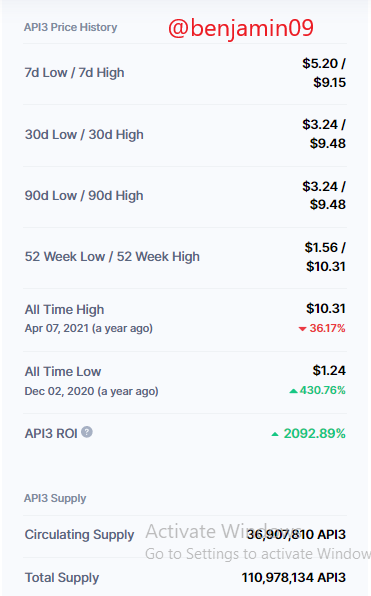
Source
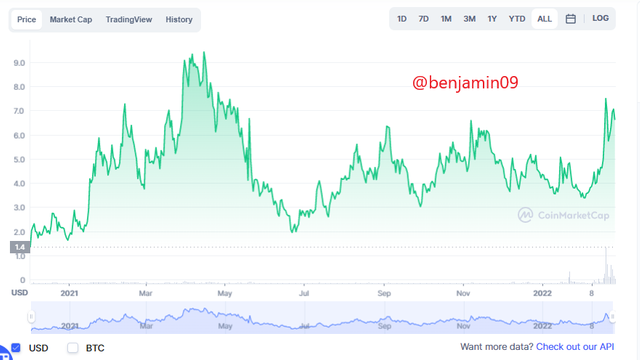
As we can see above, we can see the analysis of the price since its creation, with its all time high and all time low. Also, we can see the highs and lows of the price for several timeframes.

Why are you bullish on this token today and how long do you think it can rise?

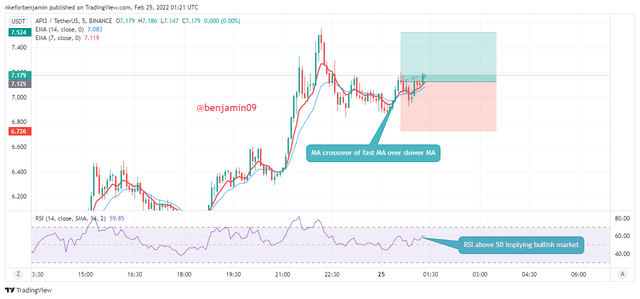
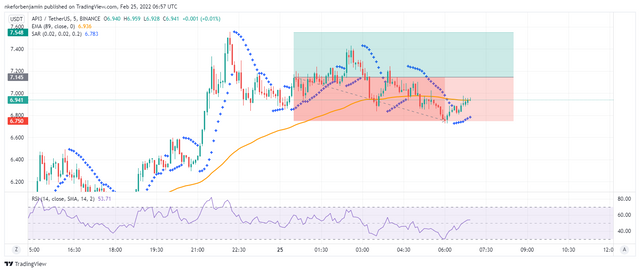
As we can see in the above screenshot, we can see bullish movement indicators by seeing the RSI above 50 indicating bullish movement. Also, we can see the upward cross of the fast MA(7 MA) over the slow MA(14 MA) indicating upward movement.
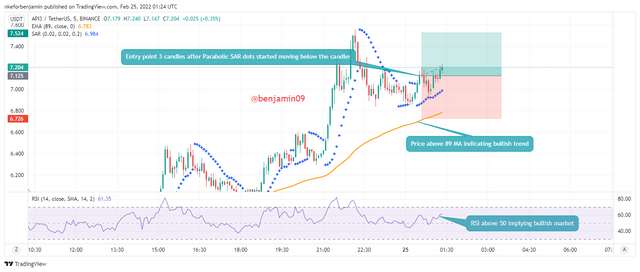
Also, we can see the price above the 89-EMA line indicating a bullish trend. Also, we can see the dots of the Parabolic SAR below the candlesticks meaning upward movement of price.
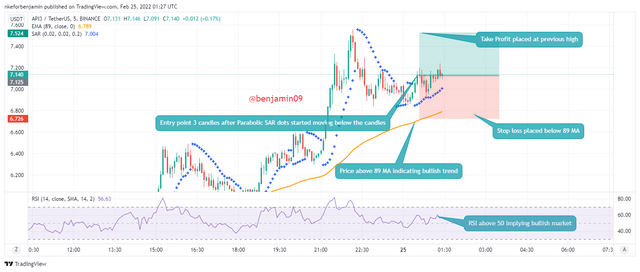
Also, we can see in the above screenshot the take profit and stop loss level for which this trade will be placed upon.

For this trade, I used leverage trading in futures.
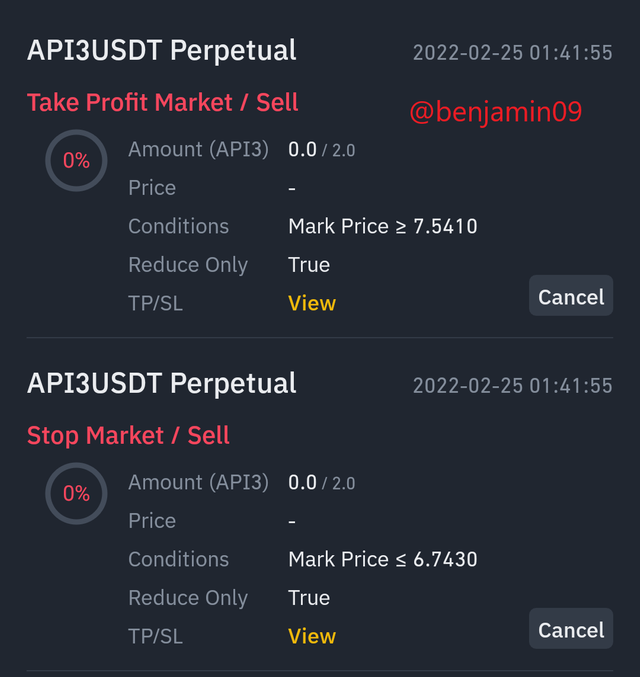
As is seen above, my take profit/sell price and my stop loss/sell price can be seen as I placed during my leverage trade.
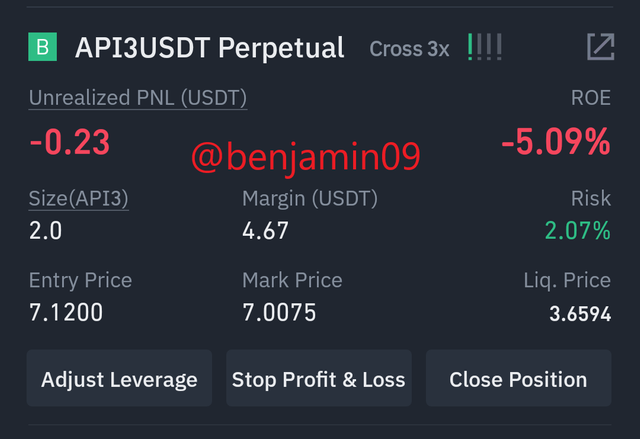
I used leverage of 3x for this trade as is seen above.
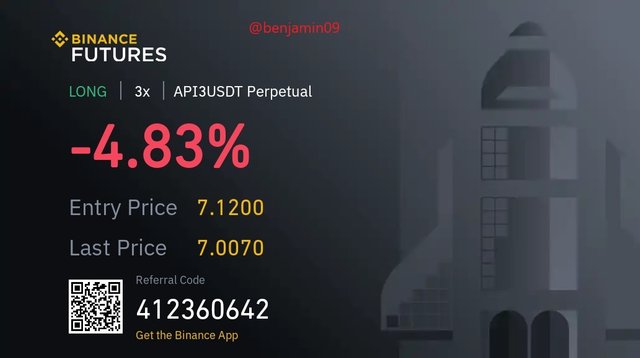
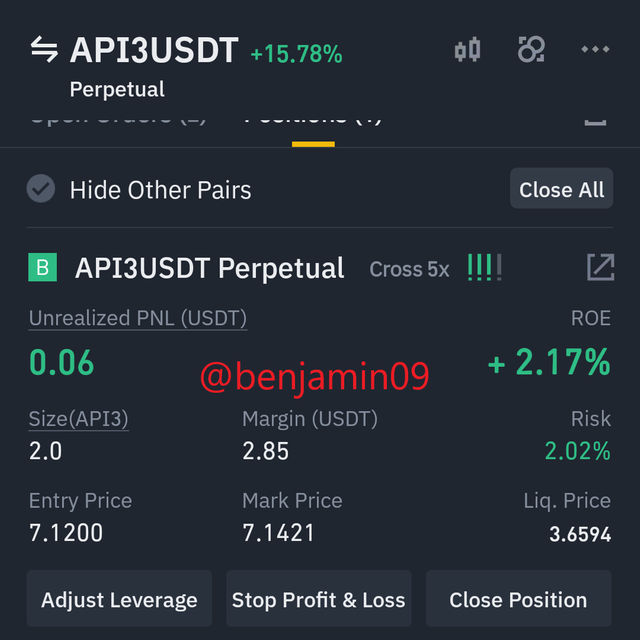
After a few hours, I saw the indicators change the data indicating a bearish reversal, so I closed my trade at a break even position.
As we can see above, shortly after I closed my trade, the price fell on until the price of the stop loss which could have been a huge loss on my account.

Thank you for reading.
@reminiscence01
@nane15


