

Question 1.


a) What do you understand by a Trending market?

A market, being advanced by the forces of demand and supply, is liable to enter 2 phases. Either a ranging phase or a trending phase. A ranging phase of the market is when the price of the crypto pair remains within the support and resistance level. There is no trend occurring.
A trending market, refers to a market phase in which is the price of the crypto pair is influenced by the forces of demand and supply, and this causes the price to breakthrough the support and resistance levels and enter a trend. A trend can either be a bullish trend or a bearish trend.
With a bullish trend, there are many buyers than there are sellers for the currency pair thus implying that there will be a high demand for the currency pair, causing the price to rise. In a bullish trend, the price is moving upwards.
While with a bearish trend, there are many sellers than there are buyers. Since the number of sellers are quite many, there will be a rise in supply leading to a fall in price.
In order to determine the current market trend whether bullish or bearish, there are 2 ways involved; using the market structure, or using the trendlines. We will look and detailly explain these below.

b) What is a bullish and a bearish trend? (screenshot required)

A bullish trend.
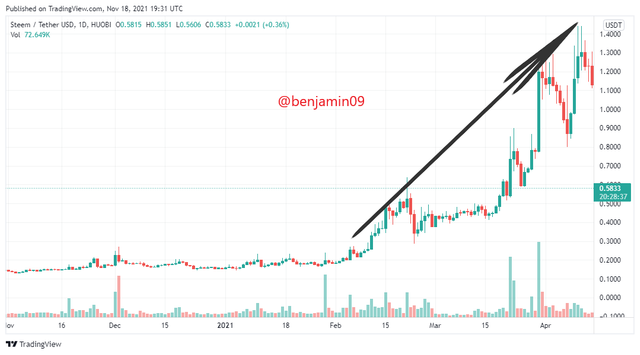
A bullish trend refers to a trend in which the market is currently experiencing a rise in the price of its currency. With the bullish trend, there is a general rise in the price of the currency pair and this is caused by the rise in the demand for that currency from a large number of buyers in the current market.
The above image shows us an example of a bullish trend with the currency pair STEEMUSDT. The price of 1 STEEM rose from $0.18 to $1.29.
Bearish trend.
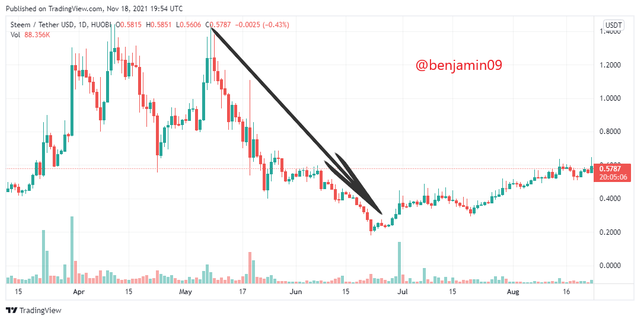
A market is considered to be in a bearish trend, when there is a general downfall of the price of the currency pair. This means that, the price of the currency went below the support level and is moving in a downward motion. This is all due to an increase in the number of sellers of the cryptocurrency causing a rise in supply, but a fall in demand.
The above image is of a bearish trend of STEEMUSDT indicated by the arrow. That is a bearish trend of the currency pair STEEMUSDT where the price of 1 STEEM dropped from $1.2 to $0.23.

Question 2.
Explain the following trend identification and give an example of each of them. (Original screenshot needed from your chart). Do this for a bullish and a bearish trend.


i) Market Structure.

When trying to identify a trend, we can use the market structure to define the trend. This means, we will analyze the market movement and direction, and we will be able to determine with accuracy the trend type of direction; whether bullish or bearish.
Bullish trend.
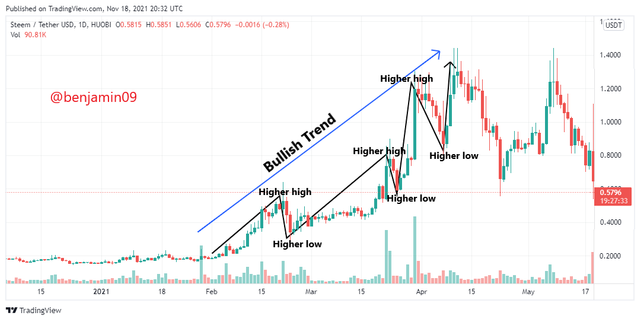
In order to determine if a trend is bullish, we will need to analyze the movement of the market price. For a bullish trend, we will notice that the market will give a higher-high and higher-low formation. This means that, as the price moves upward, it will close only at a position that is above the previous high point (higher-high). Also, when there is downward movement, it will close only at a position, that is above the previous low point of the market price (higher-low). This means that, in a bullish trend, the market will not trade at a price that is below the previous low point or below the previous high point. This formation type is caused by buyers who are increasing and causing the market to enter a bullish trend.
From the above image, we can see how the bullish trend is marked by the higher high and higher low formation. This what determines the bullish trend when using the market structure.
Per say there is a change in formation, for example higher-high lower-low, then this will discontinue the trend from being a bullish trend.
Whenever there is a minor setback, such as a fall in price, this is a retracement of the price by the buyers and it creates a good entry point for a trader to enter the market and place his buy order.
Bearish trend.
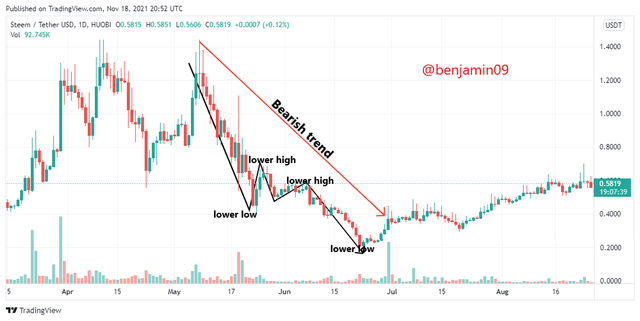
In order to determine if a market is bearish or not while using the market structure, the trader will have to observe the market formation for the crypto currency pair. For a bearish trend, the market structure should give a formation of lower-high and lower-low. This means that, the next high point of the price in the trend, should be lower than the previous high point. And the next low point in the trend, should be lower than the previous low point.
Whenever there is a rise in the price of the crypto, this is just a retracement by the sellers in order to create a perfect entry point into the market. But when there is a change in the formation, this tells the buyers that the trend has been discontinued and they should close all sell orders and exit the market.
The above image of the currency pair of STEEMUSDT shows us a bearish trend with the market structure formation of lower-high and lower-low.

ii) Trendlines.

Another way to determine a market trend is by using trendlines. With trendlines we will be able to determine if the market is in a bullish trend or a bearish trend. The trader can determine the direction of the trend by identifying the 2 low points of the trend and plot a line against it.
Bullish trend.
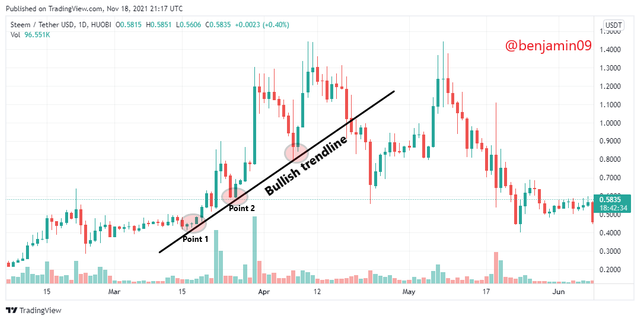
When the market is in a bullish trend, the price will be above the trendline. This means that, the trendline is drawn below the price and candlesticks. Also, whenever the price reaches the level of the trendline while in the bullish trend, it will bounce off and head up. When this happens, it acts as a perfect entry point for the trader.
The above image shows the bullish trend of the currency pair STEEMUSDT which is identified by the trendline drawn from the 2 low points of the market trend.
If the price crosses the trendline and moves downwards, this will mean that trend is over and the trader should exit the market.
Bearish trend.
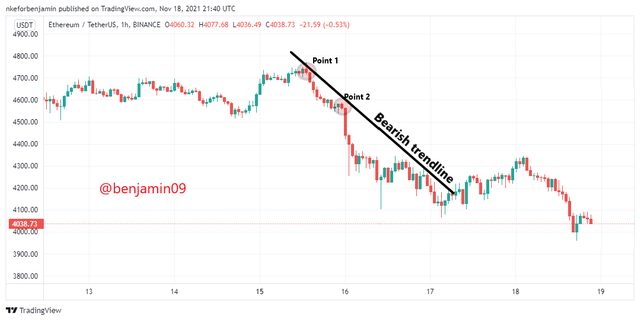
For a bearish trend, the price falls below the trendline. This means that, the trendline is drawn above the price and candlesticks by identifying the highest 2 points. Whenever the price moves towards the trendline while in a bearish trend, it will bounce off and move back downwards. When this happens, it acts as a perfect entry position for the trader. For a bearish trend, if the price moves and cuts the trendline moving upwards, this will mean an end of the bearish trend, indicating to the trader to close his order and exit the market.
The above image is a screenshot of the market bearish trend of ETHUSDT that is identified using the trendline drawn from the highlighted points.

Question 3.
Explain trend continuation and how to spot them using market structure and trendlines. (Screenshot needed). Do this for both bullish and bearish trends.

As we all know, the price of a crypto moves in a zigzag manner, but still follows the trend. This brings us to talk about trend continuation.
When we talk of trend continuation, we talk of the ability of the trend to have retracements and continue with the trend, despite a change in the direction of the price. This means that, whenever a market is in a trend, the price would sometimes change direction in order to test the strength of the trend, and later on, have a retracement and continue in the original trend direction.
Whenever the price changes direction and moves against the trend, this means the traders are currently closing trades and this is to test the strength of the trend. When the price now comes back to follow the trend direction, this retracement acts as a perfect entry point for the traders into the market.
Trend continuation can be identified and seen in using both market structures and trendlines.

a) Market Structure.

With the market structures let us examine trend continuation using both the bearish and the bullish trends.
Bullish trend.
With a bullish trend, when the price falls in an attempt to test the trend strength, it creates a higher-low. At the higher-low, there is retracement that forces the price to rise and continue in the bullish trend. After every retracement in a bullish trend, there is a higher-high. Also, when there is a new higher-low, this point is always above the previous higher-low, thus keeping this as a bullish trend. And the new higher-high formed should be above the previous higher-high.
If there is a break in the bullish market trend formation of higher-highs and higher-lows, this therefore means that the current bullish trend has come to an end and the trader should exit the market. Also, this could be a trend reversal, but before any action is made towards the trend reversal, other technical indicators should be consulted and used.
Bearish trend.
With the bearish trend, whenever there is a rise in the price of the currency pair up till the point of a lower-high, this is when the strength of the bearish trend is tested to see if it was a fake or not. At this point, if it wasn't a fake, there would be a retracement where the price will experience a fall and continue in the bearish trend. At the point of the retracement, this creates a perfect entry point for a trader to place his sell order and follow the trend into profits. After the retracement, the price will fall to a level where it will create a new lower-low and rise again to test the market strength.
We should note that, the lower-high created should not be higher than the previous lower-high. Also, the lower-low, should not be higher than the previous lower-low. When this applies, the market is in a bearish trend.
But if the trend is to be broken, by a change in the formation of lower-high and lower-low, this therefore indicates an end in the bearish trend and all traders should close their traders and exit the market. Also, a change in the market formation could lead to a trend reversal. This should be analyzed with other indicators before any action is implemented on it.

b)Trendlines.

With the trendline, it helps determine the direction of the trend by acting as a technical support and resistance tool. We will see how the trendline deals with trend continuation in both bullish and bearish trends as follows.
Bullish trend.
As for trendlines, when the market is in a bullish formation, the trendline is below the price and the candles. Whenever the price comes down towards the trendline and reaching it, the buyers have reduced buying and are testing the market strength. If the price bounces of the trendline and move upwards, then there is trend continuation. At this point, the trader should place a buy order order.
However, if the price instead cuts the trendline and moves downwards, then there is therefore an end in the bullish trend and the traders should exit the market.
Bearish trend.
With the bearish trend, the trendline is above the price and candles. When the price stops moving downwards and starts moving upwards towards the trendline, there is a test to see if the trend is strong enough not to return into support zone. Once it bounces off the trendline and moves back downwards, then there is therefore a continuation in the bearish trend and sellers can place their orders in the market.
However, if the price cuts through the trendline and moves upwards, then the bearish trend has come to an end, and the traders should close their orders and exit the market.

Question 4.
Pick up any crypto-asset chart and answer the following questions.


i) Is the market trending?

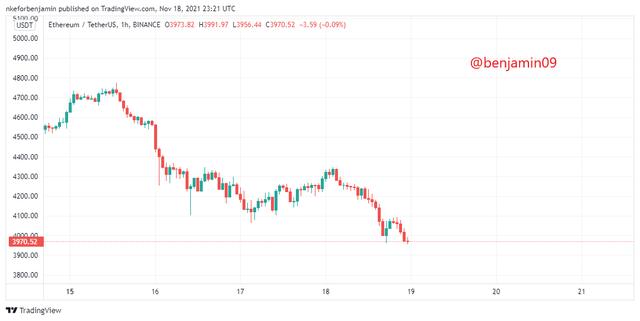
The crypto currency pair which I have chosen for this practical task is ETHUSDT.
The above image is the chart of the market for ETHUSDT as at the time I made this post. After analyzing the chart, I can confidently say that, YES the currency pair is trending.
We will see the details of the analysis in the following question.

ii) What is the current market trend? (Use the chart to back up your answers).

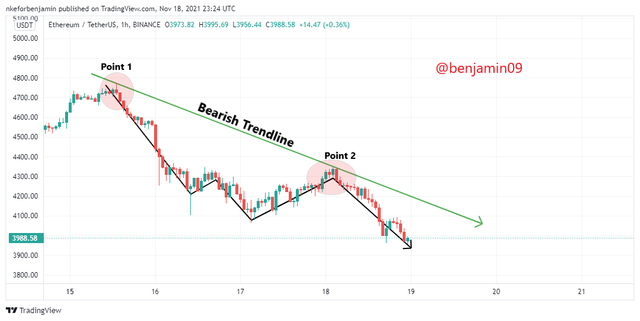
From the above chart we can see the chart of ETHUSDT. I have determined its market trend as the Bearish Trend.
This is because, from the chart above, I have been able to draw a trendline above the candlesticks, using the highest 2 points to draw the trendline. Also, the line is placed above and it is moving downwards indicating a bearish trend.
From the above chart, when the price moves up toward the trendline and reaches it (point 1), it immediately went back down and the price fell. At point 1 was a good place to enter the market with a trade. Point 2 also has thesame characteristics as point 1 and can be considered as good entry points of trade in the bearish market of ETHUSDT.

Conclusion.

The market of crypto currencies is greatly influenced by the forces of demand and supply. These forces lead to create market trends that can either be bearish or bullish. For us to determine whether a trend is bearish or bullish, we must understand the market structure as well as analyze with a trendline. To be certain of trends and when to enter or exit the market, one must be verse with trend continuation and retracements.
Thank you for reading.
This is a repost of the homework post I made which expired without having a vote from the steem curator. This is the link to the post.
Here is the score which was rated by the Professor @reminiscence01.



This is the link to the original post.
Downvoting a post can decrease pending rewards and make it less visible. Common reasons:
Submit