

1.- Explain in detail the advantages of locating support and resistance on a chart before trading.

The support and resistance are technical analysis tools that help traders in analyzing the market movement and help in so many ways more than 1. Such benefits of the support and resistance on a chart can be seen below.
- With the use of support and resistance, a large number of signals can be derived and analyzed within the various timeframes. For this reason, multi-timeframe analysis is very important when using support/resistance lines.
- Also, the support and resistance lines can be used on all timeframes which makes it more effective.
- With the support and resistance levels, they can be used within any trading strategies whether intraday, scalper or long term.
- There is a lot of information within the dynamics of the market that can be seen using the resistance and support.
- One of the major benefits is that they help to determine good entry and exit points as well as the price floor and ceiling.
- Also, the resistance and support is already built within several indicators and charting tools that are displayed on the chart.

2.- Explain in your own words the breakout of support and resistance, show screenshots for the breakout of a resistance, use another indicator as a filter.

Support and resistance are naturally made so that when they are hit, the price will immediately change direction. Such that, when the price hits the resistance level, the sellers should take over and the price will fall. And when the price hits the support level, the buyers would take over and there will be an increase in the price. But when the price hits the resistance or support lines multiple times, the resistance and support levels become weak and they are bound to break. The high selling pressure during a bearish run can also cause the support level to break and the high buying pressure during a bullish run can cause the resistance level to break.
Breakout of resistance level.
When the price hits the resistance level, it is bound to fall immediately because the sellers will take over the market. But when the resistance level gets weak, it is bound to break. If there is much buying pressure in the market, the price can break the resistance level and there will be upward movement. At this point, the resistance will become the support level. We can see a practical example below.
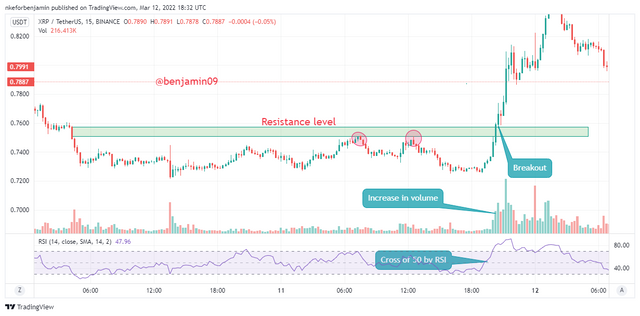
In the above chart, we can the price ranging hitting the resistance level multiple times making the resistance weak. Then there was a breakout of the resistance. At this point, we can see that there is an increase in the volume. Also, we can also see that the RSI just crossed above 50 moving upwards all indicating upward movement.

3.- Show and explain support breakout, use additional indicator as filter, show screenshots.

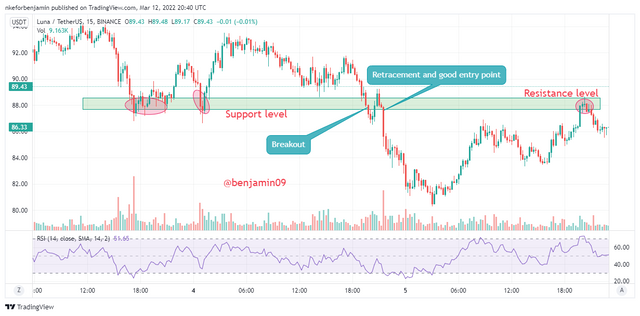
When the price hits the support level, the buyers will take over the market and the price will rise. But when the price hits the support level many times, it becomes weak and is liable to break. The higher the selling pressure, the more the support is liable to break. A break of the support turns it into the resistance for the bearish movement. We can see an example of the breakout at the support level below.
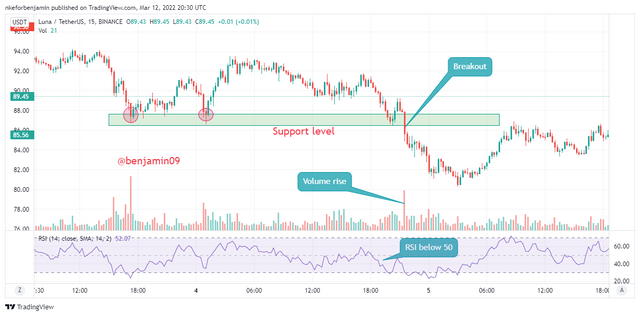
From the above screenshot, we can see the price hitting the support level multiple times making it weak due to the high selling pressure. The price later on broke the support level due to the high selling pressure and the support level now became the new resistance level. Also, at the point of the breakout, we can see that the RSI just recently crossed the 50 level moving downwards and the Volume became high also showing the high pressure to sell in the market. All these indicators act in confluence to confirm the selling signal.

4.- Explain what a false breakout is and how to avoid trading at that time. Show screenshots.

When the resistance and support levels get weak, they can get broken. A break in the resistance and support level will either lead to 2 cases; a successful breakout and a false breakout. When the price crosses the resistance or support level, the price can rise for a while causing inexperienced and impatient traders to enter the market at the breakout. The market will rise for a while above the resistance, and then fall almost immediately causing the price to go and start moving below the resistance line. For a support level, when the price moves below the support and then after a while, it will move back upwards breaking the support level again moving upwards.
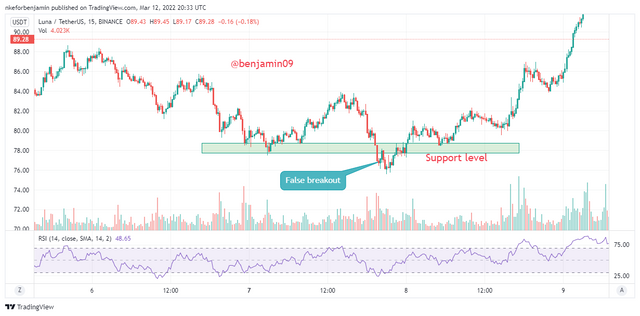
False breakouts is caused mostly by the big hands of the market that influence the market and liquidate positions. We can see an example of a false breakout below.

How to avoid trading during false breakouts.
In order for a trader to avoid the unsuccessful trades during false breakouts, he should wait for the price to do a retracement at the support or resistance level depending on the breakout type before entering the market. This means that,
- In the case where the price broke the resistance level, the trader should wait for the price to retrace at the new support level (previous resistance level) and if the price continues with bullish movement, the trader should enter the buy order while trading in confluence with other indicators.
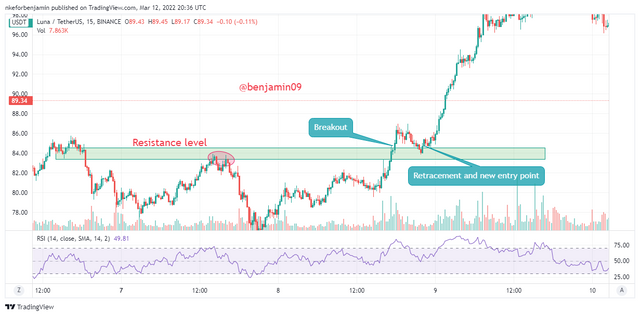
- While in the case of a support level, the trader should wait for the price to retrace upwards towards the new resistance line (previous support line) and if the price continues with the bearish movement, the trader can now place his sell order in confluence with other indicators and technical tools so as to filter out false signals.

5.- On a demo account, execute a trade when there is a resistance breakout, do your analysis. Screenshots are required.

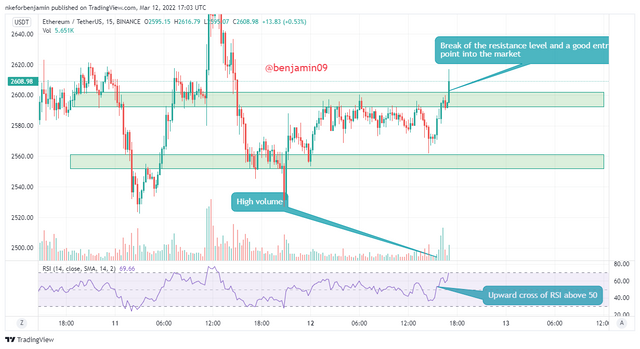
From the above chart of ETHUSDT, we can see that the market was ranging between the resistance and support lines until when the price finally crossed the resistance level moving upwards. In order to avoid false signals, I waited for the retracement at the resistance line.
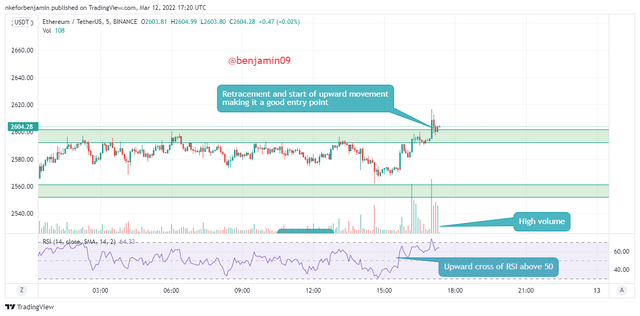
As we can see above, the price retraced, and then started moving upwards in its original direction. Also, at this point, we can see the volume rising and also, the RSI just crossed above the 50 level moving up, supporting the rise in price.
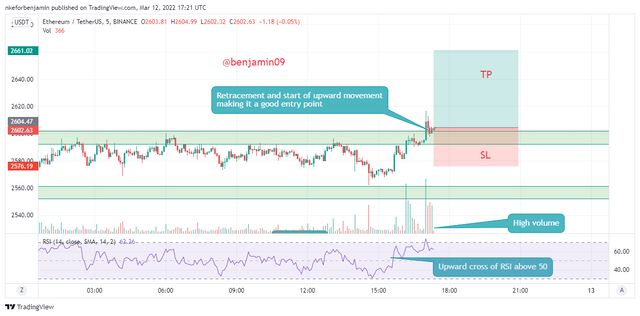
In the above screenshot, we can see the stop loss below the resistance and the take profit is set such that the risk:reward ratio is 1:2.

The above image shows the trade as was carried out from my Paper Trading account in Tradingview.

6.- In a demo account, execute a trade when there is a support break, do your analysis. Screenshots are required.

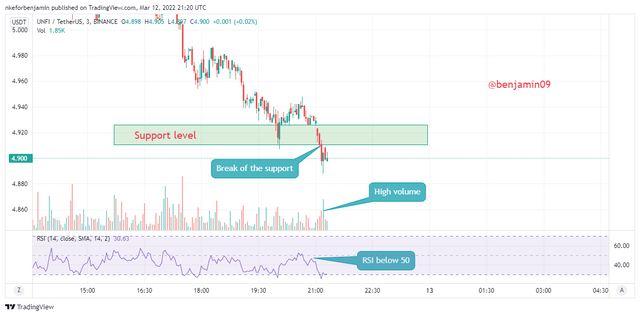
In the above chart, we can see that the price was ranging above the support zone until when the price broke the support zone. After the break, I waited to see the price movement before entering the market. As we can see, the market for a while before falling and entering the downward cycle. I check my volume to see it having a rise. Also, my RSI had crossed 50 and is ranging below 50 also confirming my bearish trade.
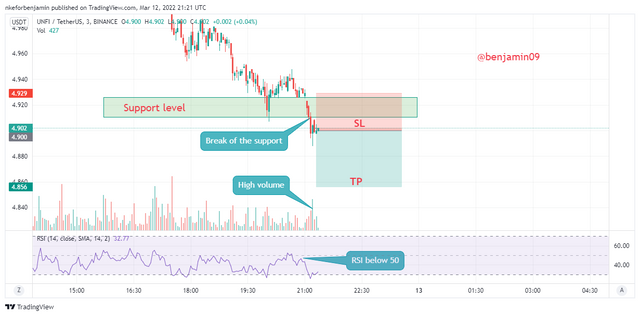
My stop loss is placed above the support zone and my take profit is such that the risk:reward ratio is 1:1.5.

We can see the proof of the transaction in the above screenshot of my Paper trading account.

Conclusion.

From the above post, we can see how to use support and resistance zones for creating good entry and exit points as well as avoiding false signals and in order to test my knowledge, I placed demo trades.
Thank you for reading.
@pelon53