

1-Put your understanding into words about the RSI+ichimoku strategy
The RSI+Ichimoku Strategy is a very useful and profitable strategy that works by combining the RSI indicator and the Ichimoku indicator so as to identify market movement early, trends, and even trend reversals. Let us first of all understand each of the essential indicators in this strategy.
i. 👉🏽RSI indicator.
RSI stands for the Relative Strength Index indicator. This is a technical indicator that is used to identify the market strength that is, which market side has more strength in the market but it is unable to identify a market trend. The RSI is made up of a line graph that is within points 0-100.
When the price is below 50, the bears are in control of the market indicating bearish movement. When the price falls further below 30, it shows that the price is in the oversold region, so an increase in the price should be expected.
When the price is above 50, the bulls are in control of the market and the price is rising. When the price rises further above 70, this comes to indicate that the price is currently in the overbought region and future bearish movement should be anticipated.
i. 👉🏽Ichimoku cloud indicator.
On the other hand, we have the ICHIMOKU cloud which is a technical indicator that can be used to identify trends, reversals, resistance and support points of the market but it is unable to identify the market strength and price movement on time. This indicator works by using 5 different Moving Averages that when combined, form a cloud-like structure which acts like a resistance or support line to identify both trends and trend reversals of the market price.
With the Ichimoku indicator, when a green cloud is formed below the candlesticks, this cloud acts as a support to the current bullish movement to either signify trend continuation or trend reversal. While the red cloud that forms above the candlesticks during a bearish run acts as a resistance so as to identify trend continuations and trend reversals.
Now that we have understood each indicator and its uses, we can now understand how the strategy works, taking into consideration both indicators. Since the RSI is an indicator which shows only the market strength and market movements but unable to identify trends, and the ICHIMOKU is used to identify trends and trend reversals using cloud support and resistance but unable to identify market movements, they work hand in hand to balance each other out eliminating each of their individual flaws so as to create accurate signals.
Let us look at the RSI+ICHIMOKU strategy working in 2 different situations.
- Predicting a good market trade entry at the beginning of the trend.
Normally, with the ICHIMOKU indicator individually, trends are identifiable but at a position where the trader is unable to ride the trend for a longer period and enjoy the early profits rather than enter the market late at a position where a reversal may even occur. But with this strategy, we can see the RSI identify the market movement and a good entry position while the ICHIMOKU shows the trend direction.
- Filtering false signals.
Using any of the indicators individually could lead to false signals as there are certain circumstances in the market that are beyond the control and prediction of retail traders, for the stronger hands are controlling for their benefits. With this strategy, these indicators are used in confluence thereby reducing the chances of falling prey to fake signals.
2-Explain the flaws of RSI and Ichimoku cloud when worked individually
👉🏽Flaws of the RSI indicator.
As we have already explained elaborately above, we know that the RSI indicator is a technical indicator which is used to show the price movement and market strength in favor of either bulls and bears. But the RSI has several flaws which are as follows.
- It cannot be used during trends or it doesn't work during trends.
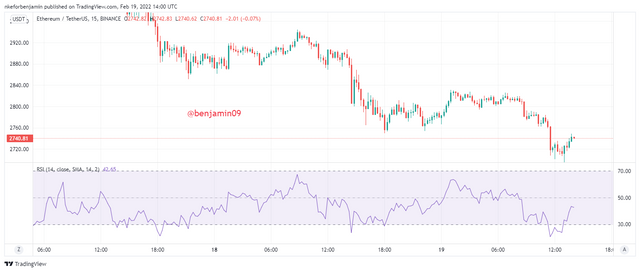
This means that, whenever there is a trend in the market, no matter the direction, the RSI will not be useful to ride this trend as it is unable to detect the pressure to continue buying or continue selling in the market. The working of RSI is that if the RSI is above 70, that is in the overbought region, this therefore indicates that there will be future bearish movement and when the RSI is below 30 (oversold region), the price will soon rise. But this is not true during trends when there is much pressure because the price will keep rising but the RSI will be in the extreme regions indicating trend reversal which is false. Let us see a practical example below to understand this flaw more.
From the above chart of ETHUSDT, we can see the RSI in the overbought region above 70, but when we look at the chart, the market is in a bullish trend. This shows that, the RSI failed to identify the bullish trend and the buying pressure in the market.
- Another flaw of the RSI indicator is that with the RSI indicator, the volume which is entering or leaving the market is not unknown. This makes it hard to use the RSI for investment decisions.
👉🏽Flaws of the ICHIMOKU cloud.
As was stated above, the ICHIMOKU cloud has several flaws as we will see below.
The ICHIMOKU cloud is not useful in a ranging market because when there are breaks of the support or resistance clouds, there may be no trend or impulsive movement. These breaks of the ICHIMOKU cloud are false signals.
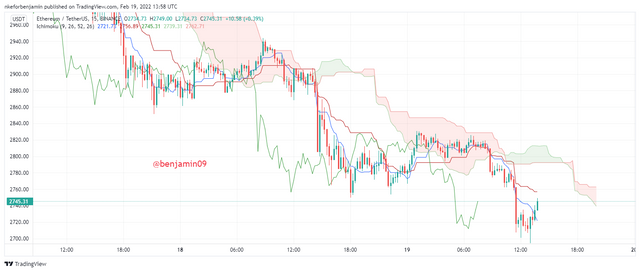
Another major flaw of the ICHIMOKU cloud is that since the ICHIMOKU is based on Moving Averages, it tends to be lagging and traders miss a lot of trading profits because the signal comes late. With the ICHIMOKU cloud, the break of a resistance or support cloud may come at a position where the trend may have already started initially and may be almost over. This therefore gives little room for trading with the ICHIMOKU cloud individually. Let us see a practical example in the following chart.
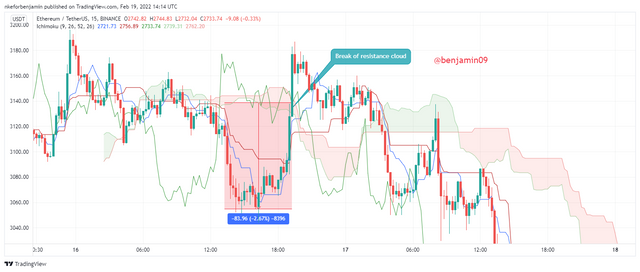
In the above ETHUSDT chart, we can see the break of the resistance cloud which is marked. Then we can also see that we have lost nearly the whole trend or impulsive move. 83.96 points have been lost within this bullish movement before there was a cross of the resistance cloud. This is because the ICHIMOKU cloud is a lagging indicator and therefore need to be used with another indicator that senses market movement and strength.
3-Explain trend identification by using this strategy (screenshots are required)
👉🏽Bearish trend.
During a bearish trend, there is the tendency that the RSI will be in the oversold region (below 30) and probably remain moving there below the 50 point. The presence of the RSI in the oversold region at the beginning of a trend can also signify or represent the selling pressure and the large number of sellers in the market. When the price is below the red cloud (resistance cloud), this indicates that there is a downward trend. Also, the volume of the market is seen using the ICHIMOKU cloud; the larger the cloud, the more the volume in the market and the smaller the cloud, the smaller the volume of the market. A practical illustration is seen below.
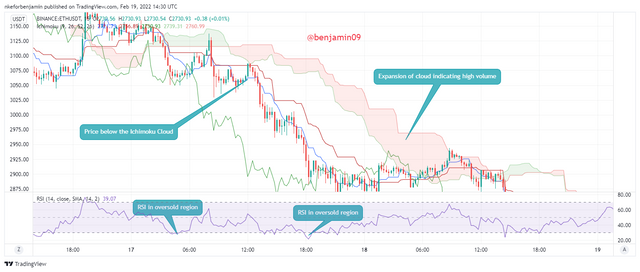
From the above chart, we can see the bearish trend which is identified by; the RSI is the oversold region; the price is moving below the resistance cloud. We can also see that at certain point during the trend, the cloud got bigger indicating the increase in the volume.
👉🏽Bullish trend.
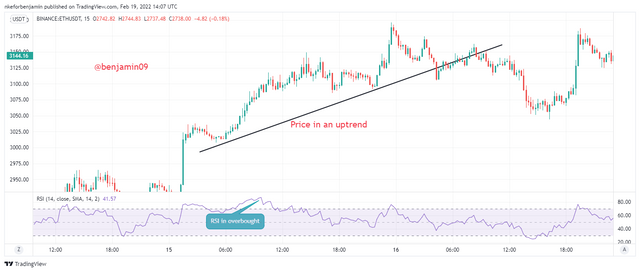
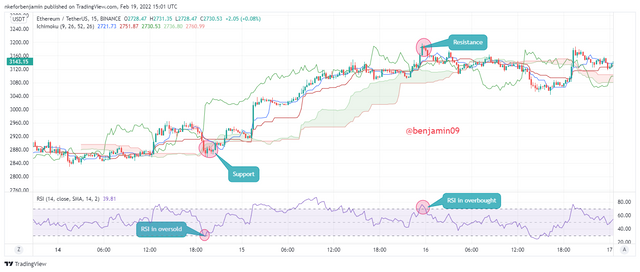
For a bullish trend, it can be identified by the RSI in the overbought region indicating much buying pressure for an upward market trend. Also, the price will be above the green ICHIMOKU cloud that acts like the support cloud. The volume is represented using the size of the cloud. The bigger the cloud, the more volume is in the market and the smaller the cloud, the less volume is in the market. We can see an illustration below.
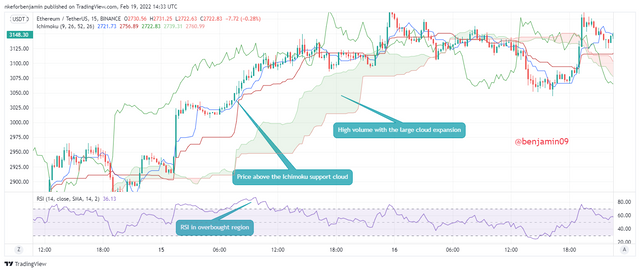
In the above ETHUSDT chart, we can see the RSI in the overbought region, the price moving above the ICHIMOKU support cloud. These come together to identify an upward trend in the ETHUSDT market. The cloud can also be seen to be really large in size which indicates a high volume during the bullish trend.
4-Explain the usage of MA with this strategy and what lengths can be good regarding this strategy (screenshots required)
The Moving Average is an indicator that will work well with this trading strategy. This is because, the MA will help to identify trends, as well as help filter out false signals. The MA will help in identifying trends and trend reversals because of the setting used and the period. For short term periods MA like 9, 14 etc, trends wouldn't be easily identified with the MA, but it will act more like a dynamic resistance or support line. But for higher timeframes, it can be used to identify trends and also trend reversals.
So, for this RSI+Ichimoku Strategy, the more appropriate MA period to use will be the 85 period as it an easily identify trends and trend reversals that will work well with this strategy increasing the accuracy of analysis. We can see an illustration of this MA with the strategy below.
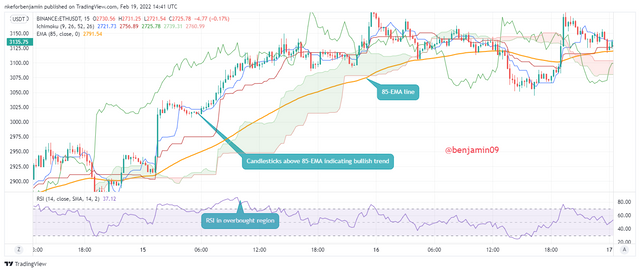
From the above chart, we can see the RSI in the overbought region for most of the trend indicating large buying pressure and many buyers. Also, the price candlesticks are above the ICHIMOKU support line and the 85-EMA line as well. This indicates a bullish trend in the market. The 85-EMA has helped to confirm the bullish trend for this strategy.
5-Explain support and resistance with this strategy (screenshots required)
👉🏽Trending market.
As we have already discussed above, for this strategy, the support and resistance lines during trends are the ICHIMOKU clouds. A support cloud is green and is below the price while a resistance cloud is red and is formed above the price. There is trend continuation when the price comes close to the ICHIMOKU clouds, but doesn't break through, only bounces off and continues the initial trend. And there is trend reversal when the price moves towards the ICHIMOKU clouds and actually breaks it. Let us understand better with the following examples.
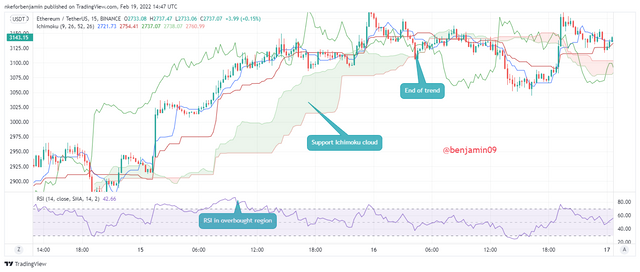
As we can see in the above chart, the market was in a bullish trend as we have already identified in the above question. The support line is the green cloud below the price candles. We can see a trend reversal when the price crosses the support line. It is identified in the chart as end of trend because it is the point of reversal.
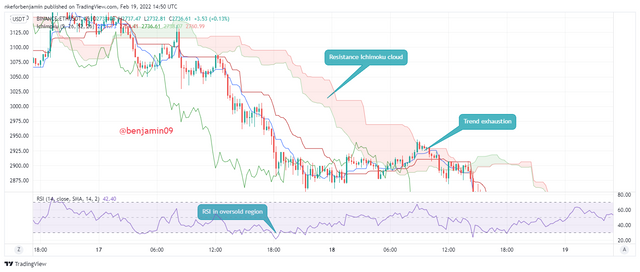
For the chart, we can identify a bearish trend. Here, we can see the resistance as the red cloud above the price candles. There is trend exhaustion when the price breaks the ICHIMOKU resistance cloud.
👉🏽Ranging market
For a ranging market, since we don't use the ICHIMOKU clouds as resistance and support, we will use the RSI. The resistance will be found when the RSI is in the overbought region. The price at that point is the resistance price. While the support is found when the RSI is in the oversold region. The price when the RSI is in the oversold zone is the support price. Let us see an example below.
In the above chart, we can see the RSI marked when it enters the overbought and oversold regions. When we look in the price chart, we can see the price where the RSI extreme prices were marked. These prices act as the resistance and support lines during the ranging market.
6-In your opinion, can this strategy be a good strategy for intraday traders?
As we all know, every strategy can be used to make good results and effective analysis when used by the right trader with adequate experience and information. This RSI-ICHIMOKU strategy which can be used to identify trends and benefit from them is no different from any other strategy. If it is used well by the right trader, it can be used to carry out intraday analysis and after analyzing the market (whether trending or ranging), it can used to create good entry and exit positions within the market.
So, I think that this strategy is useful to intraday traders as it can benefit them, when the strategy is well implemented.
7-Open two demo trades, one of buying and another one of selling, by using this strategy
In order to carry out my demo trades, I will use Paper Trading in the Trading View website.
👉🏽Bullish demo trade.
From the above ADAUSDT chart, we can see the RSI enter the overbought region indicating high buying pressure and bullish control over the market. Also, we can see the price break the Resistance cloud indicating a trend reversal to a bullish movement. At this point, I placed my buy order. My stop loss is placed below the resistance cloud and the take profit placed so that the risk:reward ratio is 1:2.
We can see the transaction details and proof of transaction in the above screenshot.
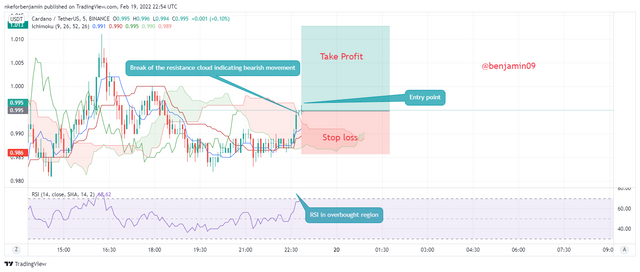
👉🏽Bearish demo trade.
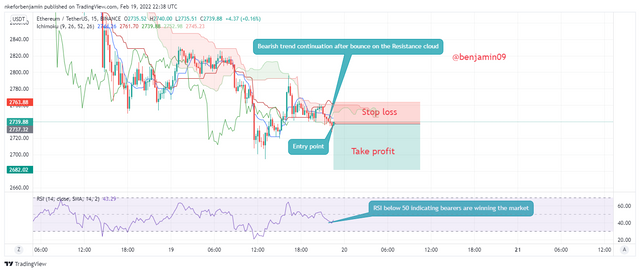
In the image above, we can see how I identified my entry position into the bearish market when I noticed the RSI in the bearish region (below 50). Also, the price just bounced off the resistance cloud indicating a bearish trend continuation. I then placed my trade from this information. My stop loss is placed above the resistance cloud and my take profit is placed such that the risk:reward ratio is 1:2.
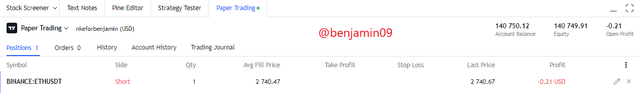
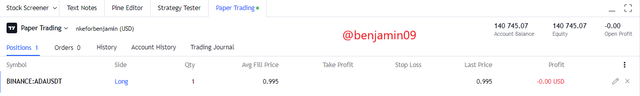
We can see the proof of the transaction in the above screenshot from my paper trading.
Conclusion
The RSI and Ichimoku cloud Strategy is a really good strategy that balances itself out thereby creating a good market position for traders to place their market orders. I am thankful for this lesson from Professor @abdu.navi03.
Thank you for reading.
@abdu.navi03