
1. Explain Rectangle Pattern in your own word.

When the market is no longer in a trend, we can identify the market as ranging. It is at the point of a ranging market when we can identify our rectangle pattern and put it into effective service that can bring us profits. A rectangle pattern, is a market pattern where we can find two horizontal lines with a horizontal flat top and a horizontal flat bottom. The price will just move within this two lines touching them but not breaking them.
For a rectangle pattern to be considered as effective, the price must touch the flat top and flat bottom 2 times. Meaning, the price must touch the flat top 2 times and the flat bottom 2 times.
When the price crosses any of the horizontal lines, there is a breakout. If the price crosses the flat top moving upwards, then there is an upward break out. Meanwhile if the price crosses the flat bottom line, then there is a downward break out.

2. How to identify Rectangles. Explain with Screenshots.

In order to identify rectangles, certain conditions must be met.
- There must be a price trend that will lead to the rectangle being made. This means that, in order to have a bottom rectangle, there must be a downward trend that creates the rectangle. And if there is to be a top rectangle, there should therefore be an upward trend that would lead to the rectangle.
- There must be 2 horizontal lines that are put above and below the price where the price would just bounce of the horizontal lines and remain in the triangle pattern. The price will bounce off the the horizontal lines and this movement will create the rectangle pattern.
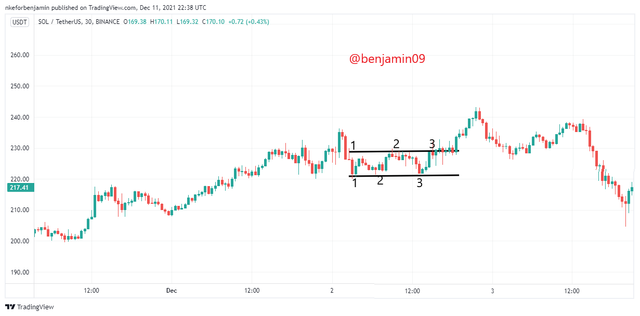
From the above screenshot, we can see that the price was falling and in a downward movement until the price then started moving in a motion that was kind of like a snake. When the two horizontal lines are drawn above and below the price candlesticks, we can identify the fact that this is a rectangle as the price touched the horizontal lines above and below 2 or more times each.
When the price started in the rectangular nature, we can see the price touching the horizontal line below first and then later on rising and touching the horizontal line above. This movement continues until the price finally breaks the horizontal line above and moves upwards above the rectangle.

3. Can we use indicators with this pattern to get accurate results? Explain with Screenshots.

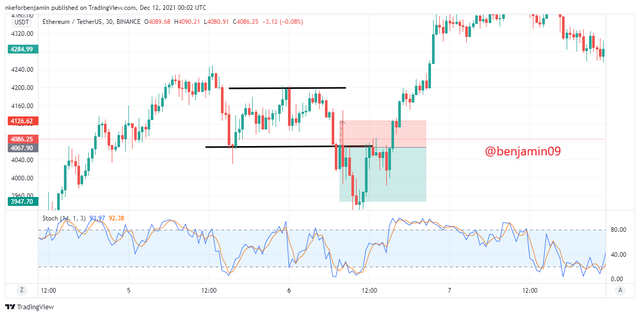
Yes. I believe we can use the rectangle pattern with other indicators such as the Stochastic Oscillator that indicates a signal. An upward cross in the oversold region represents a bullish signal, while a downward cross in the over bought region represents a bearish signal.
In the above chart, we can see that, there was an upward cross in the STochastic chart while in the oversold region meaning a bullish signal, which in turn led to a break in the upper horizontal line of the rectangle pattern. This proves that indicators can be used with the Rectangle pattern.

4. Explain Rectangle Tops and Rectangle Bottoms in your own words with Screenshots of both patterns.

Rectangle Tops refer to a pattern when the rectangle itself is formed after an upward movement. This upward movement will result in the price forming a snakelike pattern that can be seen with the use of horizontal lines as a rectangle.
The above chart is an example of a rectangle bottom as after the downward movement of the price, the rectangle pattern is formed.
Rectangle bottoms are a pattern of rectangles which are formed after a downward movement of price or a fall in price. The price will reside at the bottom and start forming a rectangle-like pattern. With the use of horizontal lines, these can be seen as a rectangle pattern. Such rectangle patterns ae know as rectangle bottoms.

5. Show full trade setup using this pattern for both trends. ( Entry Point, Take Profit, Stop Loss, Breakout)

After the breakout in the rectangle, there is a trade. Take profit is 2.5 time the Stop loss.

Conclusion.

Rectangle patterns are very effective patterns that help the users to get good trading positions and with the help of indicators, it becomes very profitable.
Thank you for reading.
CC: @sachin08


Hello @benjamin09. I’m glad you participated in the 4th week Season 5 of the Beginner’s class at the Steemit Crypto Academy.
Unfortunately, you have submitted your work after the deadline.
Remark: Homework Task Disqualified
Downvoting a post can decrease pending rewards and make it less visible. Common reasons:
Submit