

1. Explain Puria method indicative strategy, what are its main settings. which timeframe is best to set up this trade and why? (Screenshot needed and try to explain in detail)

Explain Puria method indicative strategy
The Puria method indicative strategy is a trading strategy that makes it easier for traders to follow the trend. It is linked to Andrey Perfilov as the strategy became famous in late 2010. The strategy helps traders to make small profits in the market on a regular basis.
It is made up of three technical indicators namely: 2 Weighted Moving Averages (WMAs) and 1 Moving Average Convergence Divergence (MACD). The 2 weighted moving averages WMAs along with the MACD are what traders use together to perform trade with the Puria method indicative strategy.
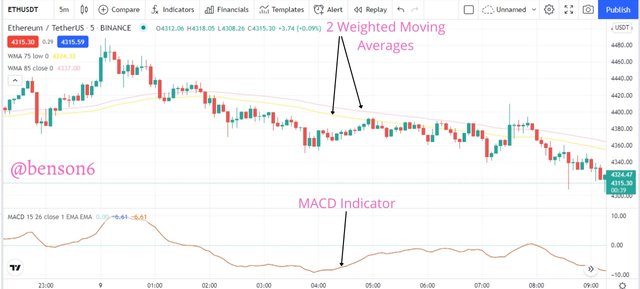
The 2 weighted moving averages act as support and resistance when the market is trending in a particular direction and can also show when a trend reversal is about to occur, while the MACD acts as the market entry signal which gives traders an indication to enter the markets.
The trading strategy is used preferably used in shorter timeframes which is usually between 5 minutes and 1 hour. It helps traders as they can make intraday trading decisions successfully.
What are its Main Settings
The main settings for the 3 indicators are explained below. 2 for the weighted moving averages and 1 moving average convergence divergence.
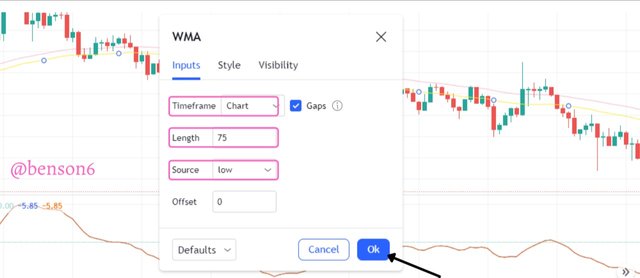
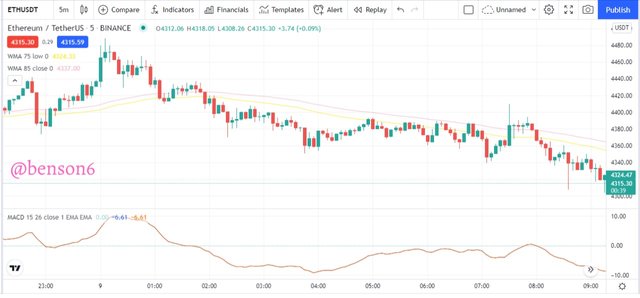
- This is the first Weighted Moving Average indicator displayed below. To achieve the Puria indicative strategy, the Length is set to 75 and the Source is set to Low, while the Timeframe is left at Chart. They are all captured in purple rectangle shape. The color used for this first WMA is yellow and is below the purple line in the indicator.
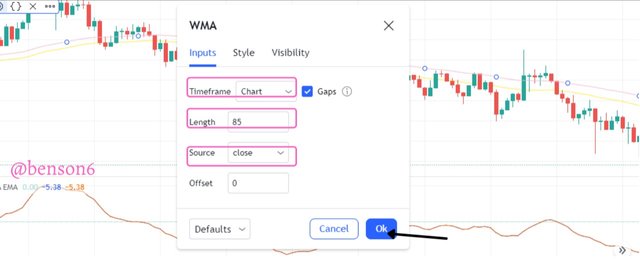
- This is the second Weighted Moving Average indicator displayed below. To achieve the Puria indicative strategy, the Length is set to 85 and the Source is set to Close, while the Timeframe is left at Chart. They are all captured in purple rectangle shape. The color used for this second WMA is purple and is above the yellow line in the indicator.
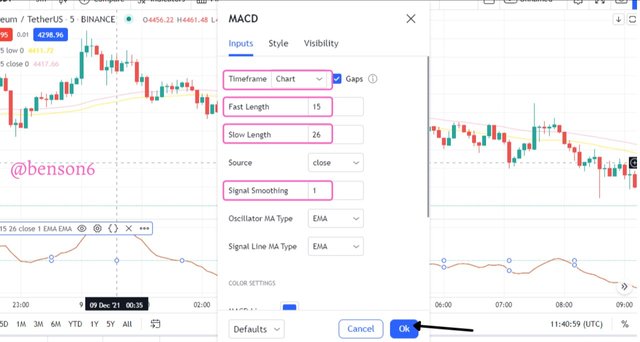
- This is the Moving Average Convergence Divergence indicator displayed below. To achieve the Puria indicative strategy, the Fast Length is set to 15, the Slow Length is set to 26, and the Signal Smoothing is set to 1, while the Timeframe is left at Chart. They are all captured in purple rectangle shape. The color used for this MACD is brown and it is at the bottom of the chart.
- We can see how all the indicators are installed on the chart. It is based on the settings used that bring out the indicator in this way.
Which Timeframe is best to set up this trade and why?
The timeframe that is effective to be used for this strategy is between 5 mins - 300 mins. However, there are certain conditions that must be met to succeed using the Puria indicative method. I shall be going through these conditions while discussing a trade setup for both market Buy and Sell Entries.
Buy Entry
The conditions that must be met in a buy entry are:
i. The MACD line must first rise above level 0 on the indicator and start moving upwards. This gives a signal that a bullish trend is about to begin.
ii. Wait for the candlesticks to move above the 2 WMAs after getting the signal from the MACD.
A buy entry can be placed after these conditions have been met, then the stop-loss and take profit levels are set. They can be in a ratio of 1:1 or 1:2.
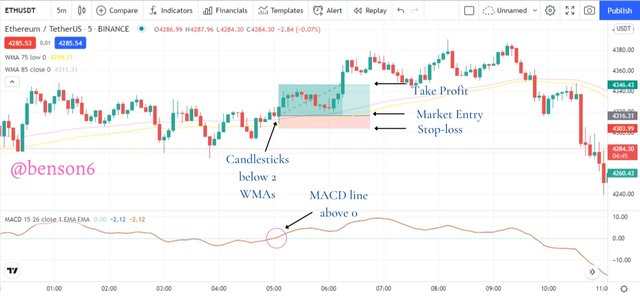
From the chart, we can see that all the conditions were met before a buy entry is placed. As the entry is placed, the take profit level is set which is at the ratio of 1:2, the stop-loss is placed just below the second WMA.
Sell Entry
The conditions that must be met in a buy entry are:
i. The MACD line must first fall below level 0 on the indicator and start moving downwards. This gives a signal that a bearish trend is about to begin.
ii. Wait for the candlesticks to move below the 2 WMAs after getting the signal from the MACD.
A sell entry can be placed after these conditions have been met, then the stop-loss and take profit levels are set. They can be in a ratio of 1:1 or 1:2.
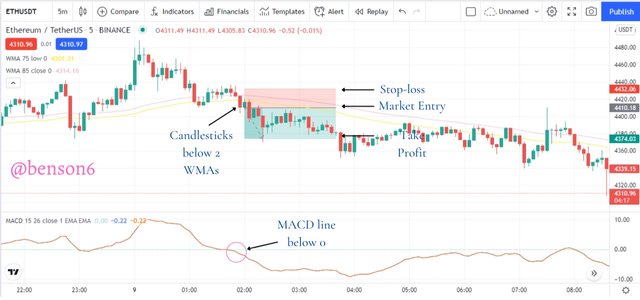
From the chart, we can see that all the conditions were met before a sell entry is placed. As the entry is placed, the take profit level is set which is at the ratio of 1:2, the stop-loss is placed just above the second WMA.

2. How to identify trends in the market using the Puria method. Is it possible to identify trend reversal in the market by using this strategy? Give examples to support your article and explain them. (screenshot needed)

How to identify trends in the market using the Puria method.
To identify a trend you need to look at the common way by which a trend can be identified and that is through its market structure. In addition, we can also look at how the indicators we are using behave in conjunction with the market structure. I shall be explaining in detail how to identify a bullish and bearish trend using the Puria method.
Bullish Trend Using Puria Method
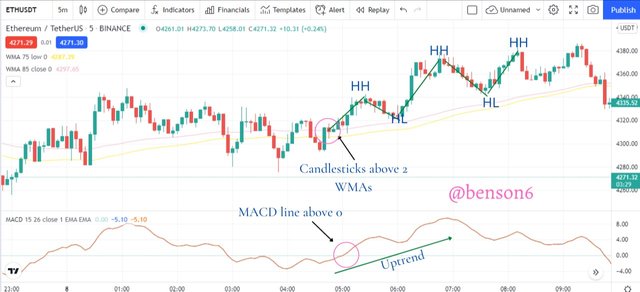
As it is seen on the chart above, the price showed indicated an uptrend as shown by the two candlesticks above the 2 WMAs. At the same time, the MACD line was above the 0 levels.
The price then exhibited an uptrend market structure with a series of higher highs (HH) and higher lows (HL). Also, it was indicated on the MACD indicator as the indicator line moved upwards.
Bearish Trend Using Puria Method
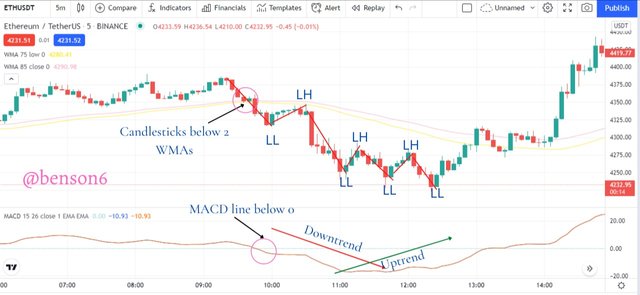
As it is seen on the chart above, the price indicated a downtrend as shown by the two candlesticks below the 2 WMAs. At the same time, the MACD line was below the 0 levels.
The price then exhibited a downtrend market structure with a series of lower lows (HH) and lower highs (LH). Also, it was indicated on the MACD indicator as the indicator line moved downwards.
Note: Please ignore the uptrend with the green arrow, it is an error.
Is it possible to identify trend reversal in the market by using this strategy?
A trend reversal is a situation in the markets when the price starts moving in the opposite direction of the current trend. It is usually triggered by different signals such as Double tops and bottoms, trendline breaks, divergence, etc. So YES it is possible to identify a trend reversal using the Puria method. I shall be explaining in detail how to identify a trend reversal during a bullish or bearish trend using the Puria method.
Trend Reversal During Bullish Movement using the Puria Method
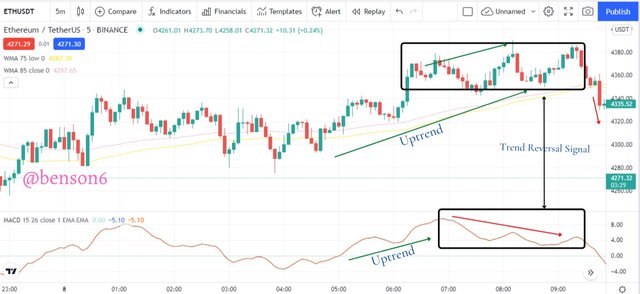
In the image above, the price was in an uptrend as shown by the green arrows with uptrend labeled on it in both the movement of the price and the indicator. Then it got to a point where the price kept going higher, the indicator started going lower as indicated on the black rectangle shapes on both the candlesticks and the indicator. At this point, there was a Divergence between the price of the asset and the indicator.
Afterward, the price broke out of the two WMAs below as shown by the red arrow close to the candlestick and the MACD line crossing below 0 levels.
Trend Reversal During Bearish Movement using the Puria Method
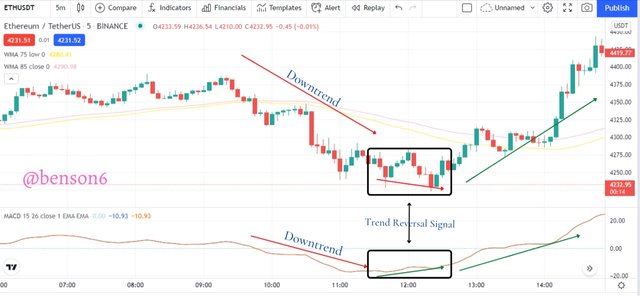
In the image above, the price was in a downtrend as shown by the red arrows with downtrend labeled on it in both the movement of the price and the indicator. Then it got to a point where the price kept going lower, the indicator started going higher as indicated on the black rectangle shapes on both the candlesticks and the indicator. At this point, there was a Convergence between the price of the asset and the indicator.
Afterward, the price broke out of the two WMAs to the top as shown by the green arrow close to the candlestick, and moved upwards, while the MACD line crossed above 0 levels.

3. In the Puria strategy, we are using MACD as a signal filter, By confirming signals from it we enter the market. Can we use a signal filter other than MACD in the market for this strategy? Choose one filter(any Indicator having 0 levels) and Identify the trades in the market. (Screenshot needed).

In this exercise, I would be using a signal filter that is different from the MACD. The indicator is the Rate of Change (RoC) indicator. It is an indicator that gives a comparison of prices from the current price to the previous price of a selected period.
It consists of a line that oscillates between a band of 4 and -4 with 0 being the central level. If the indicator line crosses the zero line above, it signals an uptrend and if the indicator crosses the line below, it signals a downtrend.
Puria method using Rate of Change (RoC) Indicator in a Bullish trend
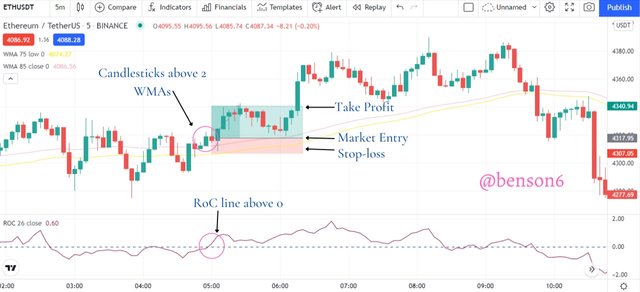
In the chart above, we can see the effect of the RoC indicator in conjunction with the two WMAs. The indicator crossed over the 0 level line above which coincided with the time the candlestick moved above the two WMAs. So a buy market entry is placed with a stop-loss below the second WMA (yellow) line, and the take profit is placed at the ratio 1:1 or 1:2.
Puria method using Rate of Change (RoC) Indicator in a Bearish trend
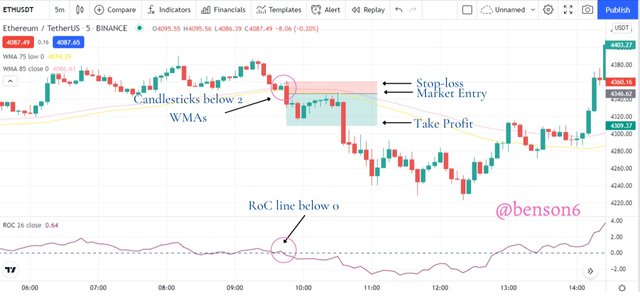
In the chart above, we can see the effect of the RoC indicator in conjunction with the two WMAs. The indicator crossed over the 0 level line below which coincided with the time the candlestick moved below the two WMAs. So a sell market entry is placed with a stop-loss above the first WMA (purple) line, and the take profit is placed at the ratio 1:1 or 1:2.

4. Set up 10 demo Trades (5 buying and 5 selling ) on 5 cryptocurrency pairs using Puria method indicative strategy. Explain any 2 of them in detail. Prepare a final observation table having all your P/L records in these 5 trades.

10 Demo Trades (5 buying and 5 selling) Using Puria's Method
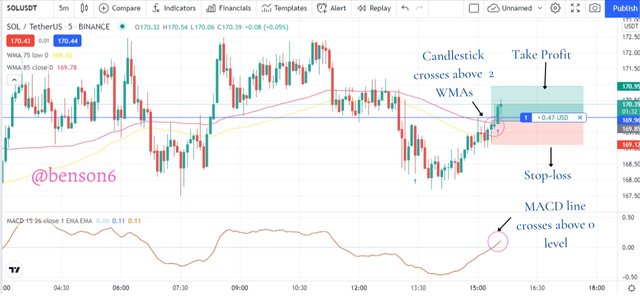
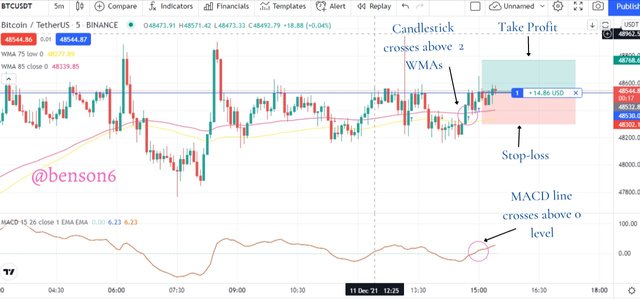
Buy Entry: SOL

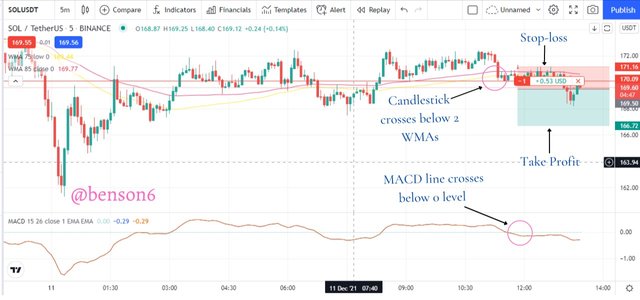

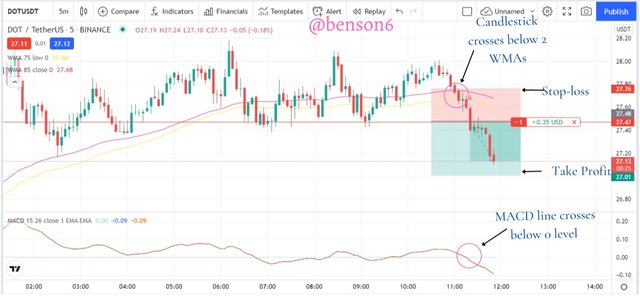
Buy Entry: DOT
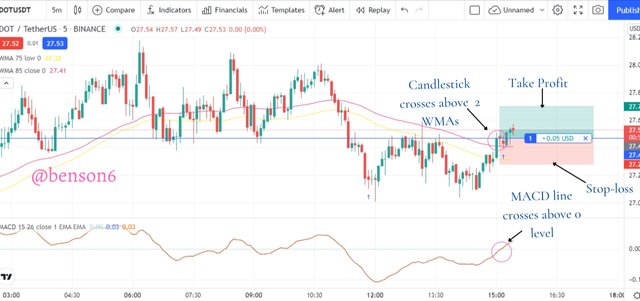

Sell Entry: DOT

Buy Entry: BTC

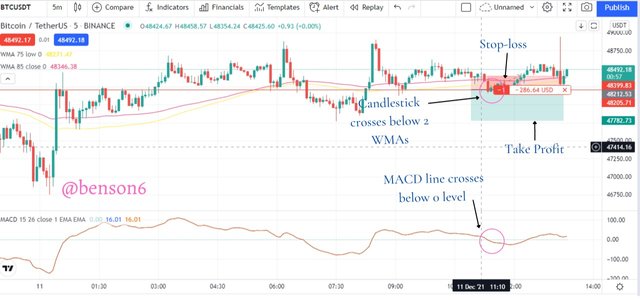
Sell Entry: BTC

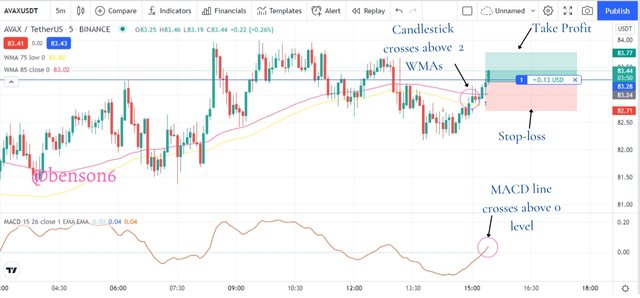
Buy Entry: AVAX

Buy Entry: ETH
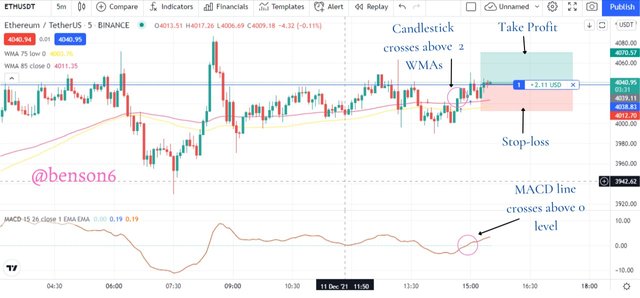

Sell Entry: ETH
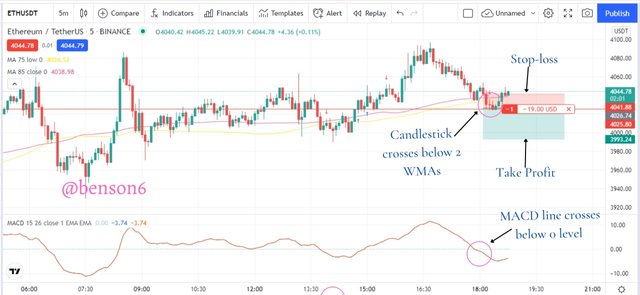

Explain any 2 of them in detail
Sell Entry: DOT

The image above is a 5 mins chart of DOTUSDT on Tradingview. It has 3 indicators in it, 2 Weighted Moving Averages WMAs in yellow and purple line, and the MACD indicator. These indicators are used together to give the Puria indicative strategy.
Based on how the strategy works, we can see that the MACD line crossed over the 0 level line below just as the candlesticks crossed over the WMAs below. At the cross of the WMAs, I placed a Sell market entry at 27.47 USDT. I placed the stop-loss level at 27.76 USDT which is just above the first WMA above. Then I placed the take profit level at 27.01 USDT. However, I didn't wait for the price to hit the take-profit level before exiting the trade.

This is the history of the demo trade. You can see different information about the trade such as side, quantity, average fill price, etc.
Buy Entry: AVAX

The image above is a 5 mins chart of AVAXUSDT on Tradingview. It has 3 indicators in it, 2 Weighted Moving Averages WMAs in yellow and purple line, and the MACD indicator. These indicators are used together to give the Puria indicative strategy.
Based on how the strategy works, we can see that the MACD line crossed over the 0 level line above just as the candlesticks crossed over the WMAs above. At the cross of the WMAs, I placed a Buy market entry at 83.28 USDT. I placed the stop-loss level at 82.71 USDT which is just below the second WMA. Then I placed the take profit level at 83.77 USDT. However, I didn't wait for the price to hit the take-profit levels before exiting the trade.

This is the history of the demo trade. You can see different information about the trade such as side, quantity, average fill price, etc.
Prepare a final observation table having all your P/L records in these 5 trades
| S/No | Pair | Buying Price | Selling Price | Profit | loss | Time Frame |
|---|---|---|---|---|---|---|
| 1 | SOLUSDT | 169.96 | - | 0.51 | - | 5 mins |
| 2 | SOLUSDT | - | 170.09 | 0.54 | - | 5 mins |
| 3 | DOTUSDT | 27.47 | - | 0.06 | - | 5 mins |
| 4 | DOTUSDT | - | 27.47 | 0.30 | - | 5 mins |
| 5 | BTCUSDT | 48,530.01 | - | 12.99 | - | 5 mins |
| 6 | BTCUSDT | - | 48,205 | - | -231.67 | 5 mins |
| 7 | AVAXUSDT | 83.28 | - | 0.12 | - | 5 mins |
| 8 | AVAXUSDT | - | - | - | - | - |
| 9 | ETHUSDT | 4038.83 | - | 2.25 | - | 5 mins |
| 10 | ETHUSDT | - | 4025.83 | - | -19.18 | 5 mins |

5. You have to make a strategy of your own, it could be pattern-based or indicator-based. Please note that the strategy you make must use the above information. Explain full strategy including a time frame, settings, entry, exit levels, risk management, and place two demo trades, one for buying and the other for selling.

Simple Strategy (SS)
In this exercise, I shall make my own strategy called the Simple Strategy. It is called the simple strategy because it makes use of the Simple Moving Averages (SMA) indicator and the Moving Average Convergence Divergence (MACD) indicator.
Market Ideology
The market ideology of the Simple Strategy shows when a new trend is about to begin and when an old trend is about to end. It makes use of 2 simple moving averages and the moving average convergence divergence indicator. The crossing over of the simple moving averages shows when a new trend is about to begin and when an old trend is about to end.
Markets the strategy is Suitable
The Simple strategy is can be used in any of the major markets such as Currency (Forex), Commodities, Stocks, and Cryptocurrency. The markets that are stated here make use of charts that display the price action of the assets found in the markets. This makes it easier for the Simple strategy to be able to work well in these markets.
SuitableTime Frames
The best time frame to use the simple strategy is the M5, M15, M30, H1, H4, 1D, virtually any timeframe. It is suitable for both intra-day traders and swing traders.
Entry and Exit Point of the Simple Strategy
The buy market entry triggers when the 9 SMA crosses the 21 SMA above and the MACD line crosses the 0 level line above. The sell market entry triggers when the 9 SMA crosses the 21 SMA below and the MACD line crosses the 0 level line below.
Risk Management
The risk management system that is employed for this system is a risk to reward ratio of 1:1, however, the reward ratio can be increased to 2.
Indicator to False Signal
There is no strategy that can give a 100% accurate signal. The MACD is there to help give the Simple strategy a helping hand by filtering the noise and trying to give an accurate signal.
Settings for the Simple Strategy
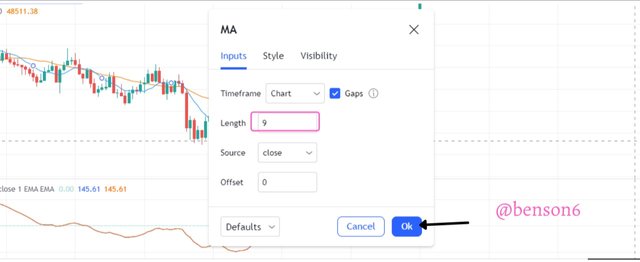
- The settings for the first simple moving average have a length of 9. The other parameters remain the same. Also, I left the color blue.
<center
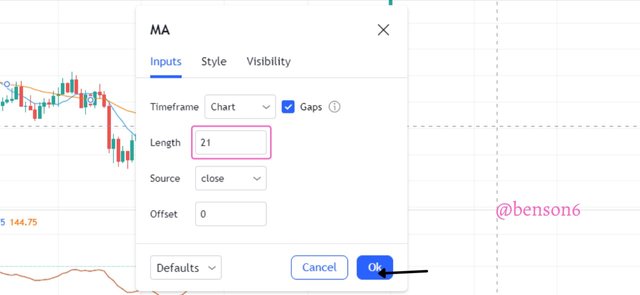
- The settings for the second simple moving average has a length of 21. The other parameters remain the same. Then I changed the color to orange.
- The settings for the moving average convergence divergence is 9, 26, and 1 for fast length, slow length, and signal smoothing respectively. The other parameters remain the same. Then I changed the color to brown.
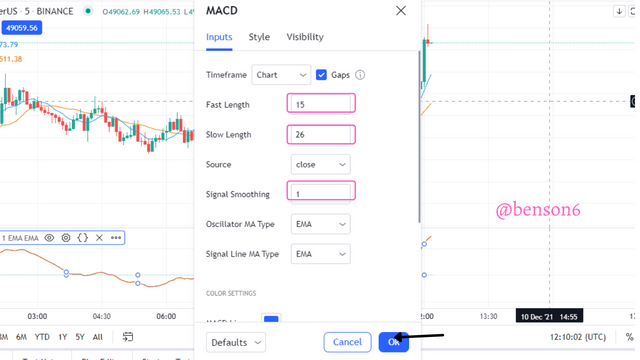
Using the Simple Strategy
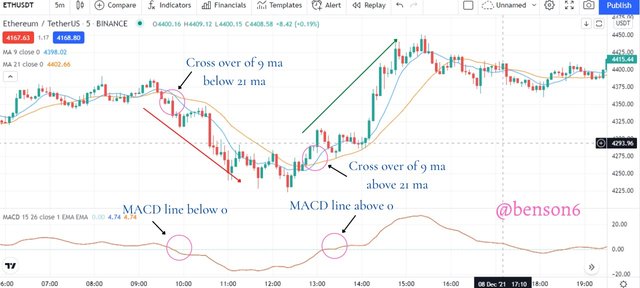
In the image above, we can see the simple strategy in action. There was a bullish and bearish signal that was given by the simple signal.
The bearish signal is the first signal to occur, it is shown on the left side of the chart. There was a crossover of 9 SMA below the 21 SMA and at the same time, the MACD line crossed over below the 0 levels, thus giving a sell signal. Likewise, there was a crossover of 9 SMA above the 21 SMA and at the same time the MACD line crossed over above the 0 levels, thus giving a buy signal. This is the second signal which is bullish and is seen at the right side of the chart.
Bullish Demo Trade using Simple Strategy
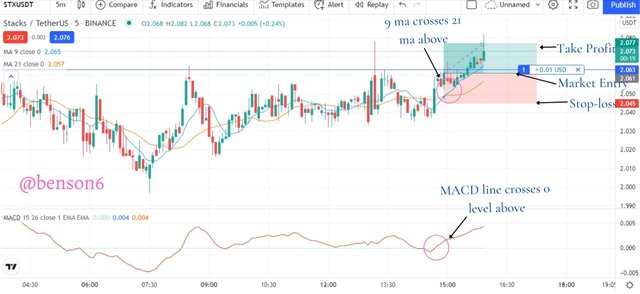
From the chart above, we can see the effect of the simple strategy. There was a crossover of the 9 MA above the 21 MA and at the same time, the MACD line crosses the 0 level line above thus confirming the signal. So I opened a Buy market entry. The stop loss was placed just below the cross-over of the MAs while the take profit was placed at a ratio of 1:1.

This is the history of the demo trade. You can see different information about the trade such as side, quantity, average fill price, etc.
Bearish Demo Trade using Simple Strategy
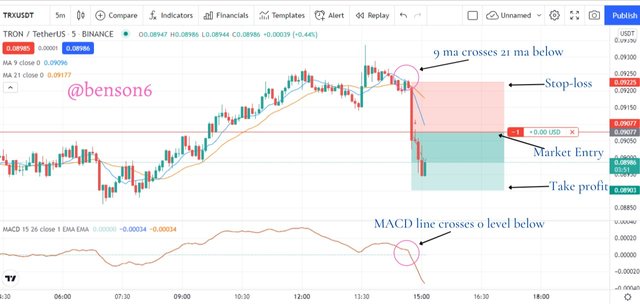
From the chart above, we can see the effect of the simple strategy. There was a crossover of the 9 MA below the 21 MA and at the same time, the MACD line crosses the 0 level line below thus confirming the signal. So I opened a Sell market entry though a little late. The stop loss was placed just above the cross-over of the MAs while the take profit was placed at a ratio of 1:1.

This is the history of the demo trade. You can see different information about the trade such as side, quantity, average fill price, etc.

Conclusion

The Puria Indicative Strategy method is a method that gives a good idea of the movement of the markets when in use. It consists of three indicators 2 of which are the same but with different parameters. The Puria indicative method is very dynamic because it shows when the price of an asset is trending in a particular direction, and it can also give an indicator of when the market is about to experience a trend reversal.
This strategy in my opinion is a stand-alone strategy because it already makes use of more than 1 indicator to help traders have a solid signal for market entry. It has 2 indicators that let traders know when a trend is about to occur when the candlestick crosses over them, then it has another indicator that lets traders have a good entry point to the markets. It can be used in any financial product as long as it has price action within it.
However, it can sometimes give a false signal which can be due to the distance at which the price is coming from before going below or above the 2 WMAs thus not allowing the price to move in the direction that it is expected to even when the MACD crosses over the 0 level below or above. Sometimes it can also be due to the price being in a range, so it is necessary for traders to be aware of such instances.
Downvoting a post can decrease pending rewards and make it less visible. Common reasons:
Submit