Repost of an uncurated post-Candlestick patterns - Steemit Crypto Academy Season 5- Homework Post for [ @reminiscence01 ] Task 10

in hive-108451 •  3 years ago 

My Season 5 assignment post for Prof. @reminiscence01 was reviewed and scored but not curated.
Below is the score sheet

Screenshot_20211124-065400.png

Here is the post link for the home work task
https://steemit.com/hive-108451/@benson6/candlestick-patterns-steemit-crypto-academy-season-4-homework-post-for-reminiscence01-task-10

20211116_223813_0000.png

~INTRODUCTION~

Good Day my fellow steemian I trust you all are doing good I want to submit my homework for task 10 given by professor @reminiscence01.

QUESTION


1A. EXPLAIN THE JAPANESE CANDLESTICK CHART? (ORIGINAL SCREENSHOT REQUIRED)

B. IN YOUR OWN WORDS, EXPLAIN WHY THE JAPANESE CANDLESTICK CHART IS THE MOST USED IN THE FINANCIAL MARKET.

C. DESCRIBE A BULLISH AND A BEARISH CANDLE. ALSO, EXPLAIN ITS ANATOMY.

C3TZR1g81UNaPs7vzNXHueW5ZM76DSHWEY7onmfLxcK2iP9HfWtVKu1afPyjPwCDD8Q338oQgqXz4kj5WTVERczt7b8Q5EAqZpJoqttNuXsaJ3jkGKyMsUa.png

1A. EXPLAIN THE JAPANESE CANDLESTICK CHART ? (ORIGINAL SCREENSHOT REQUIRED)

C3TZR1g81UNaPs7vzNXHueW5ZM76DSHWEY7onmfLxcK2iP9HfWtVKu1afPyjPwCDD8Q338oQgqXz4kj5WTVERczt7b8Q5EAqZpJoqttNuXsaJ3jkGKyMsUa.png

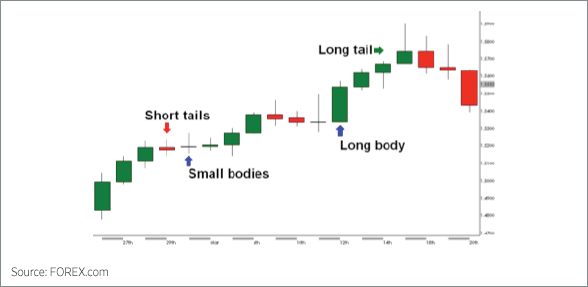
japanese-candlesticks-chart-2.png


screenshot from FOREX.com
The Japanese candle stick is a popular name amongst every Forex, stock and crypto traders. This candlestick is specifically used by traders to trade the financial market. The person who improved this suggestion is a Japanese rice trader recognized as Munehisa Homma. He came up with the theory of using candlesticks to indicate market trends, the candlestick apprehends the market move through an illustrated display of the price actions making use of two coloreds (Red and Green) candles with several shapes or patterns. It is this pattern trader who labors in using technical analysis used to analyze the market trends and come up with production. Examples of the candlestick patterns include Bearish Engulfing pattern, Doji, Bullish Engulfing pattern, Hammer, spinning top, inverted hammer, hanging man, shooting star, moving star, Harami engulfing, etc. We still have a couple of others but these are the outstanding ones being utilized.

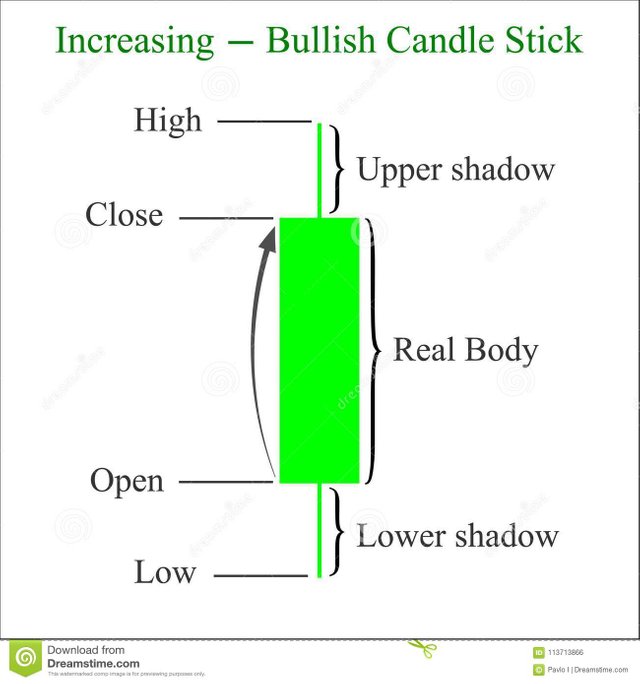
increasing-bullish-candlestick-chart-pattern-candle-stick-graph-candle-stick-graph-trading-chart-to-analyze-trade-113713866.jpg


source
Looking at the screenshot above, we can observe that the candlestick consists of High, Close, Open, and Low points on each of the Bullish and Bearish candlestick respectively. I will briefly talk about what each of them means in the course of this assignment. The Japanese candlestick over time has remained the most used trading tool by Stock, Forex, and crypto traders. The reason behind this will be discussed subsequently. *** **NOTE** *** The Japanese candlestick can be utilized to analyze the market action in any time frame. Besides, If the time frame is set for 30mins, it will take 30mins for one isolated candle to be formed, and if the time frame is set for 15mins, it will take 15 mins for one candle to be formed, the same method is applicable in every other time frame.

C3TZR1g81UNaPs7vzNXHueW5ZM76DSHWEY7onmfLxcK2iP9HfWtVKu1afPyjPwCDD8Q338oQgqXz4kj5WTVERczt7b8Q5EAqZpJoqttNuXsaJ3jkGKyMsUa.png

B. IN YOUR OWN WORDS, EXPLAIN WHY THE JAPANESE CANDLESTICK CHART IS THE MOST USED IN THE FINANCIAL MARKET.

C3TZR1g81UNaPs7vzNXHueW5ZM76DSHWEY7onmfLxcK2iP9HfWtVKu1afPyjPwCDD8Q338oQgqXz4kj5WTVERczt7b8Q5EAqZpJoqttNuXsaJ3jkGKyMsUa.png

Through time, the use of the Japanese candlestick has become more well-known and famous among many money market traders. This is a result of many components which I will be examining here.


  • EASY TO UNDERSTAND

The Japanese candlestick is simple to comprehend provided that they are impressive to make use of because of the use of customer-able colors and the unsophistication of the candlestick.


  • INDICATORS

Indicators are influential trading tools and software that can be possibly be utilized alongside the Japanese candlestick to make better trading decisions and identify good market patterns in real-time by the traders.


  • INTERACTION

This is another implication of the Japanese candlestick, it assists to exhibit the interchange between the forces of demand and supply in the market, and also between the buyers and the sellers as well.

All The listed reasons above are what makes most traders love and use the Japanese candlestick.


  • MARKET PSYCHOLOGY

With the use of Japanese candlestick, sometimes at a glance, the traders can skillfully tell who is in the custody of a market, this is also known as market belief or trading psychology and the various candlestick pattern like the shooting star enables the quick decision-making of the analysis.


  • ACCURACY AND DETAILS

When it gets to accuracy and circumstances, the Japanese candlestick has that, the candlestick provides detailed graphics about the recent market trend and occurrences in clear pictures and images on the different time frames, hence as a result of this, dealers get more valid results.

C3TZR1g81UNaPs7vzNXHueW5ZM76DSHWEY7onmfLxcK2iP9HfWtVKu1afPyjPwCDD8Q338oQgqXz4kj5WTVERczt7b8Q5EAqZpJoqttNuXsaJ3jkGKyMsUa.png

C. DESCRIBE A BULLISH AND A BEARISH CANDLE. ALSO, EXPLAIN ITS ANATOMY (ORIGINAL SCREENSHOT REQUIRED)

C3TZR1g81UNaPs7vzNXHueW5ZM76DSHWEY7onmfLxcK2iP9HfWtVKu1afPyjPwCDD8Q338oQgqXz4kj5WTVERczt7b8Q5EAqZpJoqttNuXsaJ3jkGKyMsUa.png

The Japanese candlestick is basically in two aspects which are the Bullish candle and the Bearish candle. I will be examining them one after the other involving their anatomy.


BULLISH CANDLESTICK

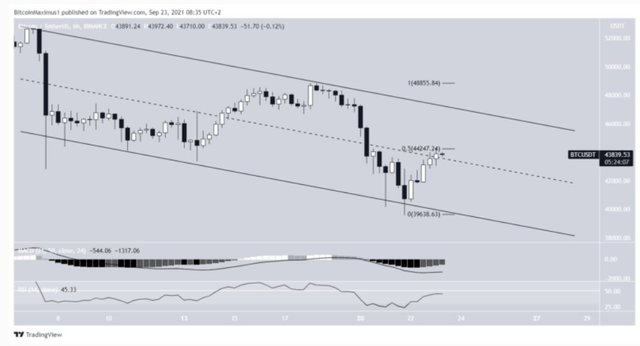
Screenshot_20211116_091534.jpg


screenshot from trading view
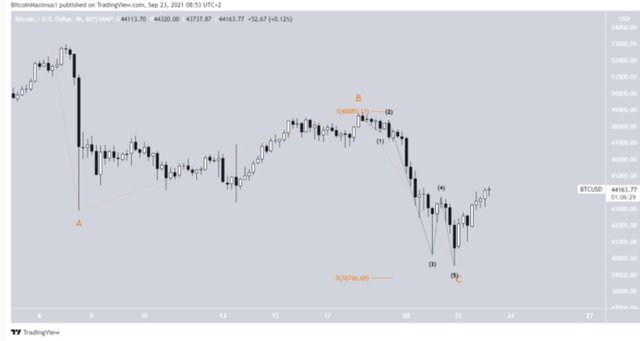
The image above illustrates a procession of bullish candles constructing a Bullish trend in the 30M time frame. The Bullish candle is being used to exemplify an upward trend in the market or notify the traders that the bulls/buyers are bringing over the present market circumstance and are bigger than the sellers. Not only that the bullish candle commonly boosts or pushes up the price of the trading product. Most times, we can see the bullish candle at the bottom of a low trend.

BEARISH CANDLESTICK


Screenshot_20211116_092339.jpg


screenshot from trading view
From the picture uploaded the candles in the red color symbolize the bearish candle. It is being used to exemplify a downward trend on the market chart or it notifies the traders that the bears (sellers) are about to take over or remake the current market situation. Once the market goes bearish or goes on a beer run, the prices of the asset or commodity trading then will automatically fall or reduce. The bearish candle can be seen at the top of an upward trend.

ANATOMY OF THE BULLISH CANDLESTICK


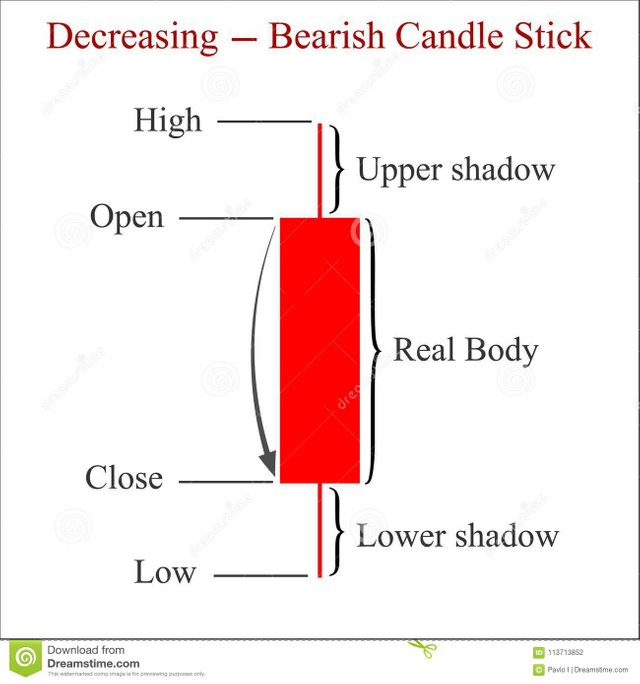
decreasing-bearish-candlestick-chart-pattern-candle-stick-graph-candle-stick-graph-trading-chart-to-analyze-trade-113713852.jpg


source
From the picture Taking Look at the bearish candle image uploaded we can also pick four major elements which are High and Open (Upper shadow), Low and Close (Lower shadow), the anatomy of the bearish candlestick is kind of different from the bullish candlestick based on the upper and lower shadow system. I will be examining the four components shortly below.

HIGH: It symbolizes the highest degree a special asset has reached within a time frame.

LOW:It also implies the deepest part a unique asset has achieved within a period.

OPEN: It is also understood as the opening price, this connotes the opening of price action within a period. For a bearish candle, the opening price can be organized at the top of the candle.

CLOSE: Also realized as the closing price, for a bearish candle, the closing price is constantly at the underside of the candlestick and the closing price commonly falls below the opening price for a bearish candle.


NOTE


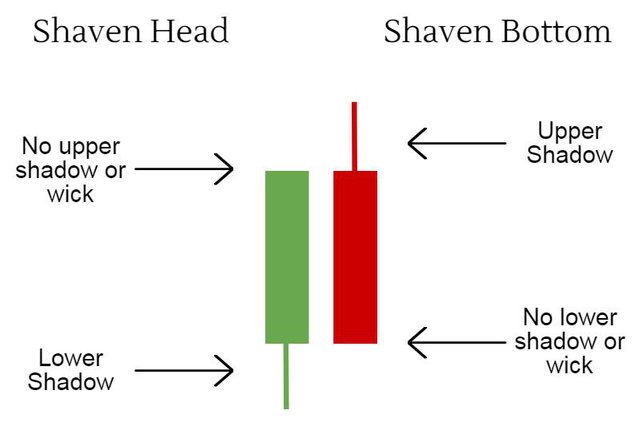
There are some outstanding cases whereby some candles occur to have no wick either on the upper shadow or lower shadow. The candle stick having no upper shadow is commonly cited as 'shaven head' while the candlestick with no lower shadow is naturally cited as 'shaven bottom'. This can be seen in the picture I uploaded.
Japanese-Candlesticks-Copy-1.jpeg.jpg


source

C3TZR1g81UNaPs7vzNXHueW5ZM76DSHWEY7onmfLxcK2iP9HfWtVKu1afPyjPwCDD8Q338oQgqXz4kj5WTVERczt7b8Q5EAqZpJoqttNuXsaJ3jkGKyMsUa.png

CONCLUSION

C3TZR1g81UNaPs7vzNXHueW5ZM76DSHWEY7onmfLxcK2iP9HfWtVKu1afPyjPwCDD8Q338oQgqXz4kj5WTVERczt7b8Q5EAqZpJoqttNuXsaJ3jkGKyMsUa.png

The Japanese candle stick is a valuable trading tool for financial market traders. Its implication cannot be overemphasized as it has renovated the technique of trading. However, this course has encouraged me to privately know more about candle sticks and I will proceed to more research about them and know how to effectively relate them to get reasonable outcomes.

Authors get paid when people like you upvote their post.
If you enjoyed what you read here, create your account today and start earning FREE STEEM!