What Is The Meaning Of Support Can Become Resistance & Resistance Become Support,
This simply means that what is regarded as support or resistance in a particular trend of an asset will automatically eck e resistance and support when the trend reverses. Take for example, when the trend is a bullish trend , the several price limits it gets to and correction is effected before it continues on its buying trend is the resistance. However when finally, the bearish trend sets in, all those resistance turns to support for that asset.
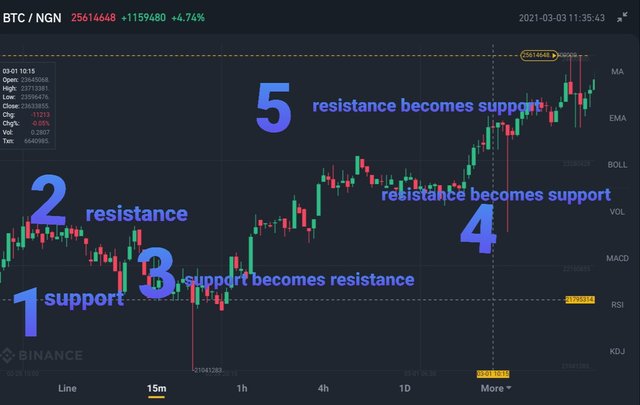
[Example of support <--------> resistance)
From the chart above, you can clearly that the former support 1 turns to resistance3, the resistance 3 and 5 becomes support zones for this asset or vice versa.
When and Where set Buy trade, Chart Example?
From the chart shown above, the buy trafe will be taken at the support numbered 4 while the stop oss will be set the support numbered 3.
What Is A Technical Indicator? (You can explore it as much as you can, like explain its role, show anyone technical indicator from your chart and name of that Indicator.?)
A technical indicator are chart tools that help traders fo better analyse and understand the price movement of an asset thus informing them whether to buy or sell. These indicators can analyze some specific aspects of the pairs ranging from trends, price averages, volatility of the assets and support and resistance.
We have types of indicators
- Trend indicators, this helps traders to confir whether it is trending up or down and to know if a trend do exist.
- Oscillator indicators - this gives traders insight of how a particular asset is gatnering momentum in price.
- Volatility Indicators - this measure the rate of upswings and downswings of a currency pair.
- Support and resistance indicators - This refers to price levels that will be a barrier to a pair moving in a particular
direction.
Exponential Moving Averages
This is a type of trend indicator that helps a trader know whether it is trending upwards or downwards. Like it is shown on the chart below. There ere three lines on the chart, purple, pink and yellow. Once the purple is on top, followed by thr pink and thrn the yellow, it is an indication of a buy trend, however, whe the purple is under, the pink on top and the yellow on top of the pink, it simply means, the trend is a sell trend. However, the are other things to consider before entering the trade depending on the type of trader you are.
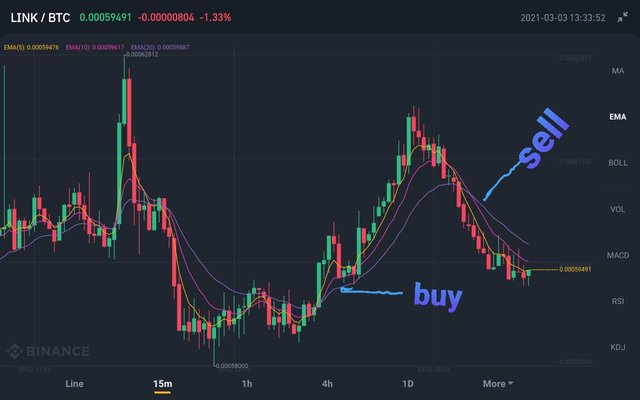
[Exponential moving average]
Provide your view and explore TradingView.
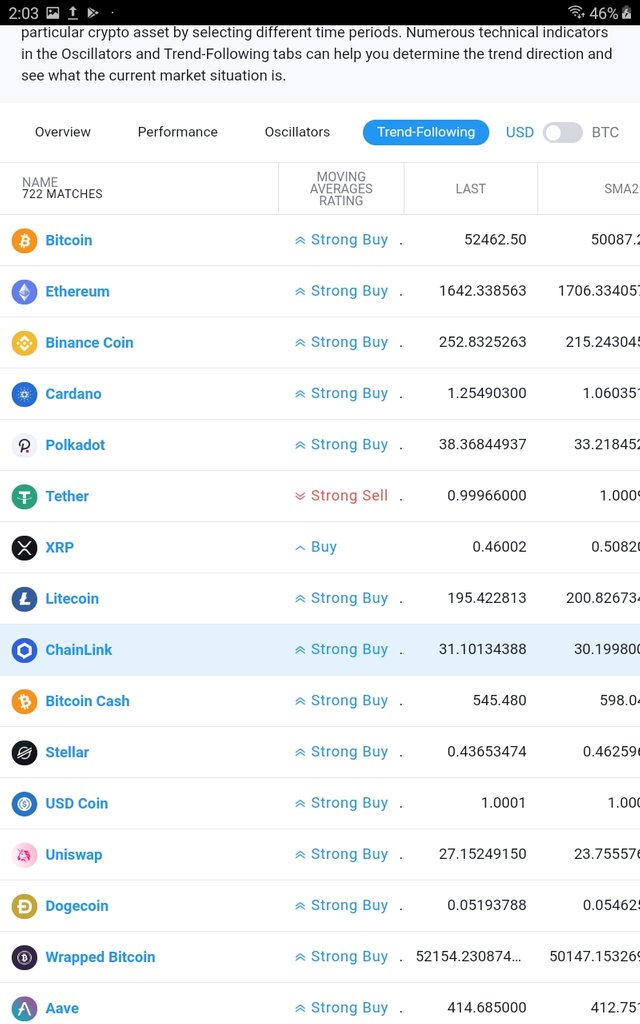
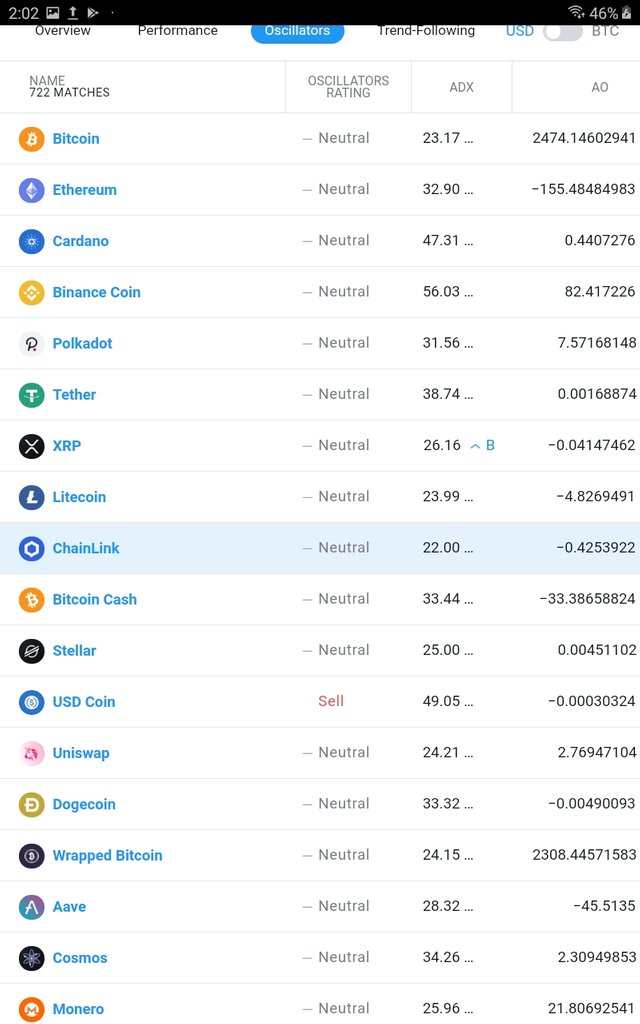
When you log in to trading view.com, click on cryptocurrencies, , it will bring out the various asset pairs that can be traded and the good thing is that, it will also give you insight on the pair is going to be like using the performance, oscillators and trend following pages.
Performance based on trend following
Performanace based on oscillators
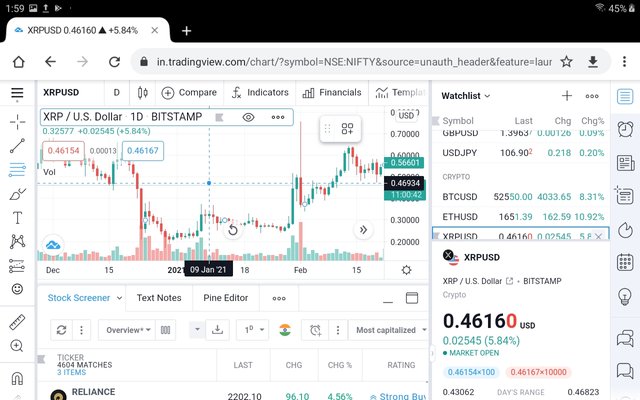
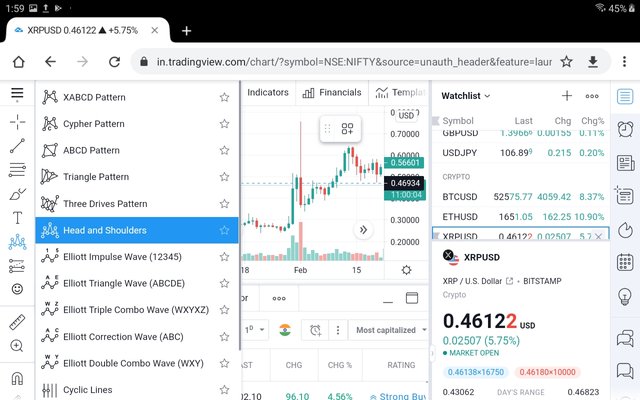
This shows when Inserting the shoulder and header indicator on the chart if there was any, but there was none there.
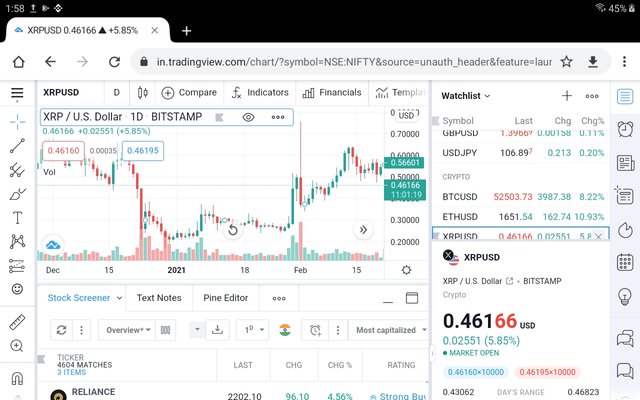
This show when i inserted the range values.
This is a chart of xrp/usd live and direct as at that time.
From my litle exploration, i totally agree with you that trading view platform is one of the best platforms if not the best.it provides 8ne with ideas, overview and other technical details needed to engage in a trade. It also provides chart for so many pairs from there analyst too, all in a bid to make sure of their clients trading success.
What is 200 Moving Average, how and when we can trade/invest with the help of 200 Moving Average? Show different price reactions towards 200 Moving Average
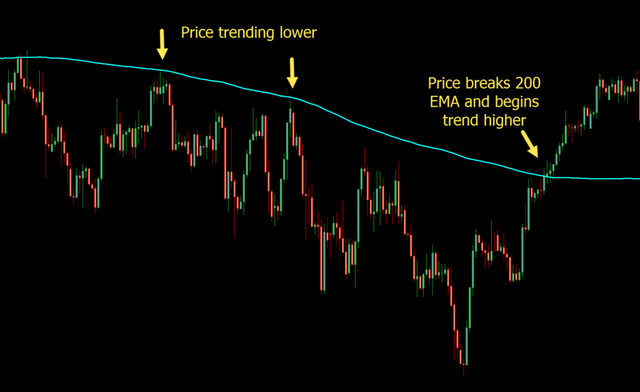
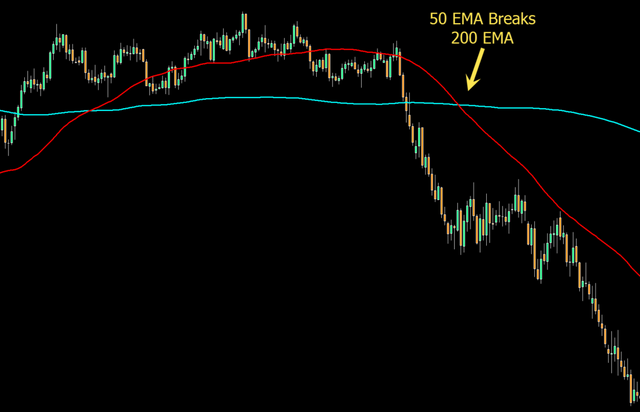
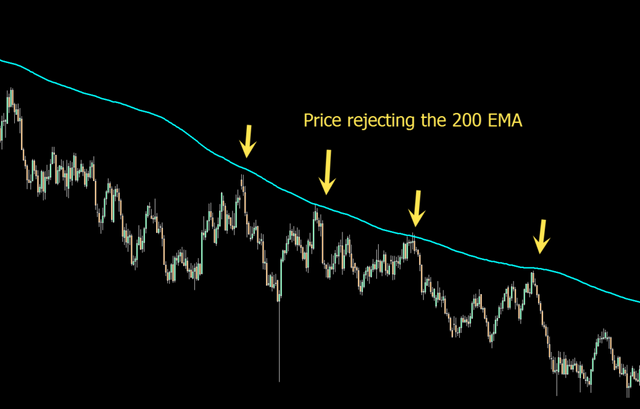
The 200 day moving average is used to analyze and identify longterm trends. It is represented on the chart as a line. When the price of the asset is still moving above the 200 MA , it is an indication of a strong buy, however, when it crosses the 200 MA and goes below, without bouncing back, it is an indication of a sell trend.
Nb. @stream4u, please i don't have a trading app on a device that can give me 200 EMA, that is why I resorted to picking charts from another source, hope you will bear with me until i can get a device that mt4 can run on.
Thanks for your lecture.
Hi @benton3
Thank you for joining Steemit Crypto Academy and participated in the Homework Task 4.
Your Homework task 4 verification has been done by @Stream4u.
Thank You.
@stream4u
Crypto Professors : Steemit Crypto Academy
Downvoting a post can decrease pending rewards and make it less visible. Common reasons:
Submit