What Is A Chart Pattern? Explain with Candlestick Charts.?
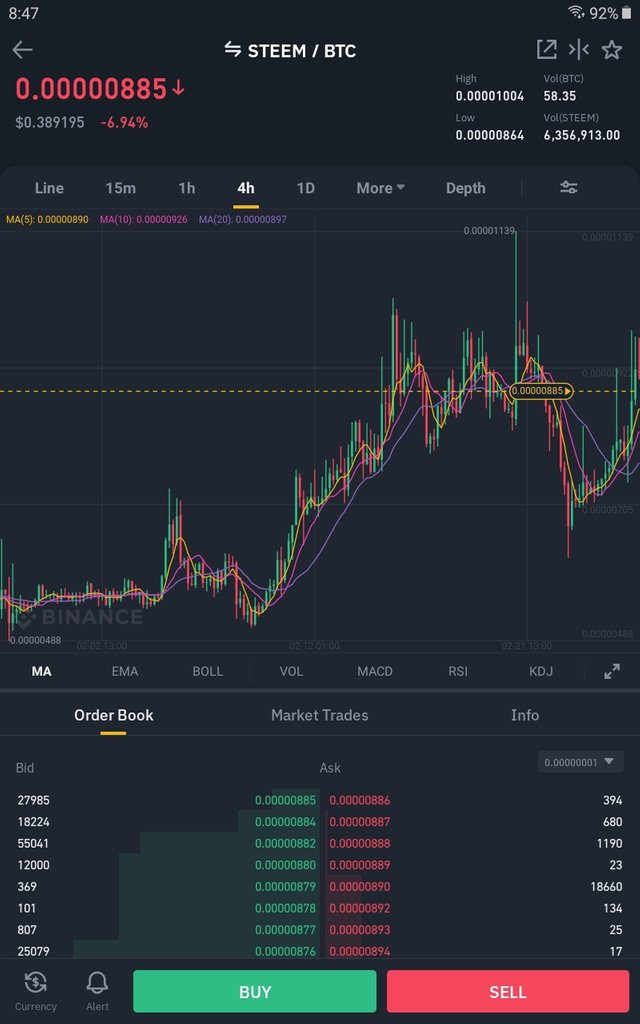
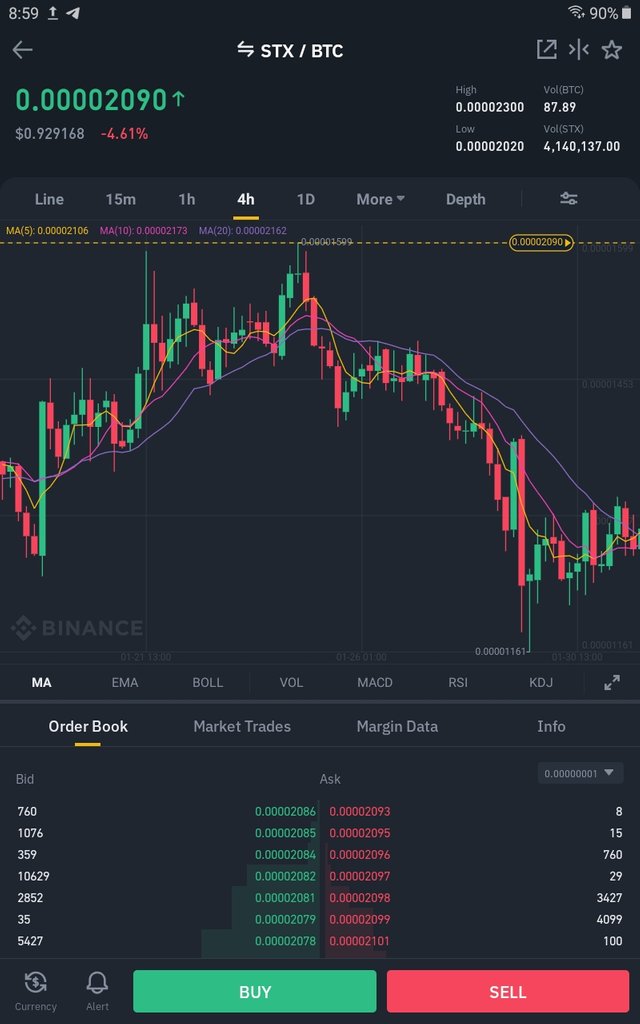
A chart pattern can be said to be the price formations of an asset. This chart patterns indicates points of entry and exit when investing or trading for that particular asset. Chart pattern can also indicate the level of profif a trader or investor can rake in, a particular trade as well as the stop loss level.
This be shown on the chart below,
What Is A Price Breakout? Explain with Candlestick Charts and mention the price levels.
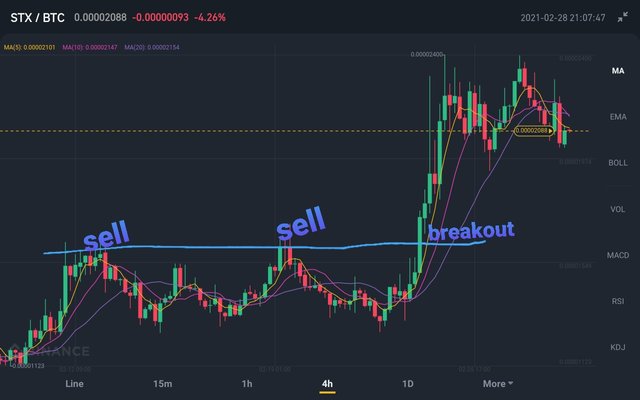
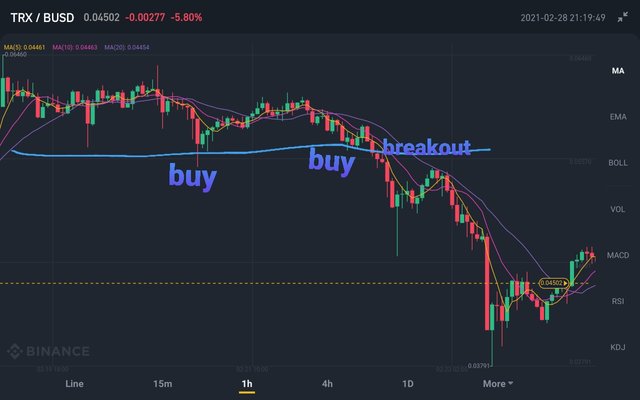
A price breakout is when an assets price moves above a resistance or breaks through a support in a chart pattern.
The chart below shows a resistance breakout
The chart below shows a support breakout
What Is A Continuation Pattern? Explain with Candlestick Charts and mention the price levels.
A continuation pattern is a chart that show that shows that a particular trend of an asset will continue. A correction of the price is done on the chart before the trend continues.
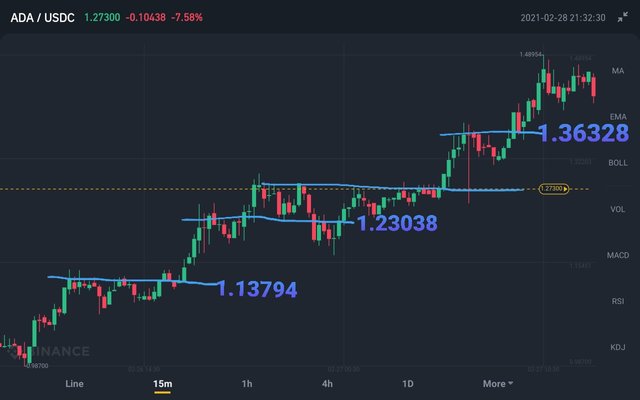
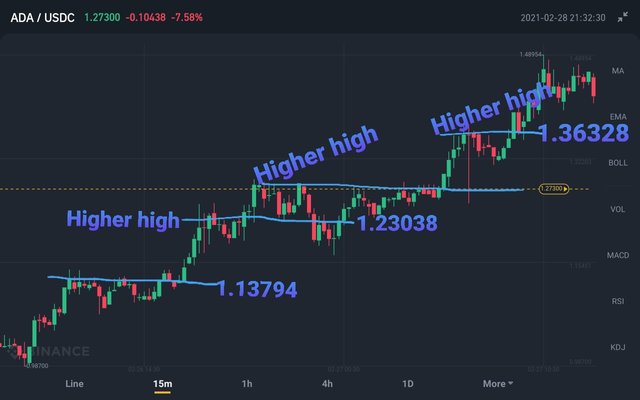
What Is A Higher High Formation? (Explain with one of the crypto coin charts where the Higher High Formation identified.
A higher high pattern takes place when the trend of the asset is on a buy trend. The buyers or bulls have an upper hand in the market and therefore takes the price to a new high level.
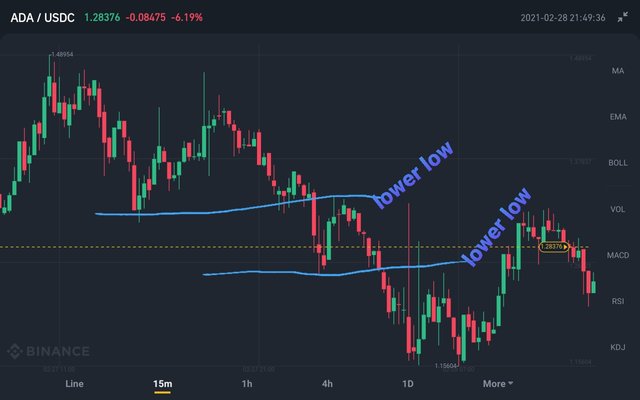
What Is A Lower Low Formation? (Explain with one of the crypto coin charts where the Lower low formation is identified.)
A Lower low pattern takes place when the trend of the asset is on a sell trend. The seller or besrs have an upper hand in the market and therefore pushes the price to a new low level downwards.
What Is A Reversal Pattern?
A reversal pattern is a chart pattern that shows that an existing trend is about to come to an end. This reversal pattern, when noted early provides an entry signal and point for the reverse direction with very minimal stop loss range.
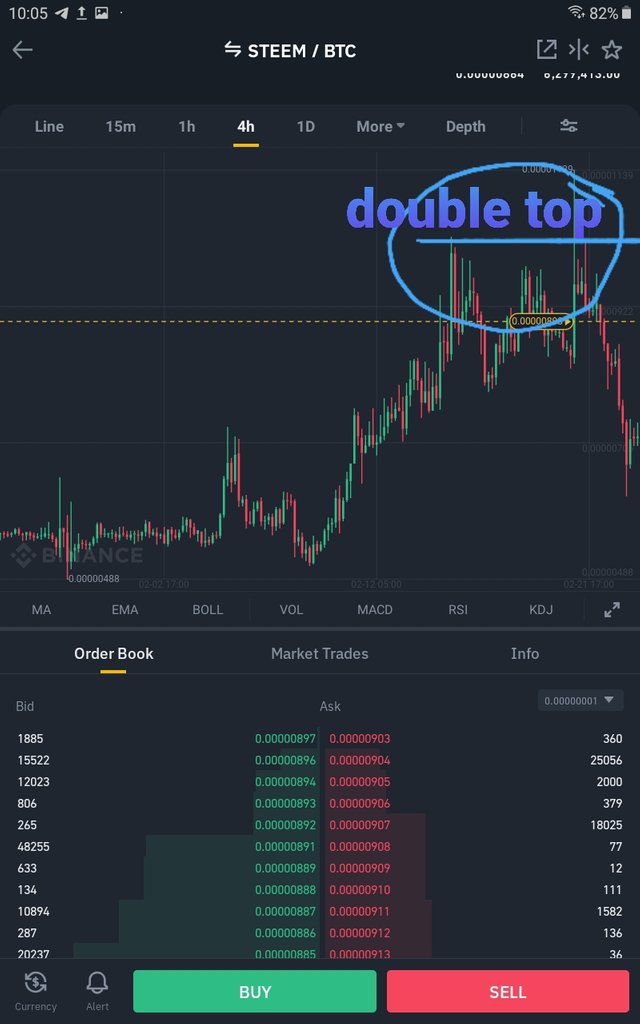
What Is A Double Top Pattern? Explain with one of the crypto coin charts where the Double Top Pattern identified.
Just as the name implies, it means that the price of an asset has reached a high point twice, that is being at the same level, without breaking out. This is an indication that reversal to the downside is very close or imminent . On it forms the double top pattern, those on a buy trend should take their exit.
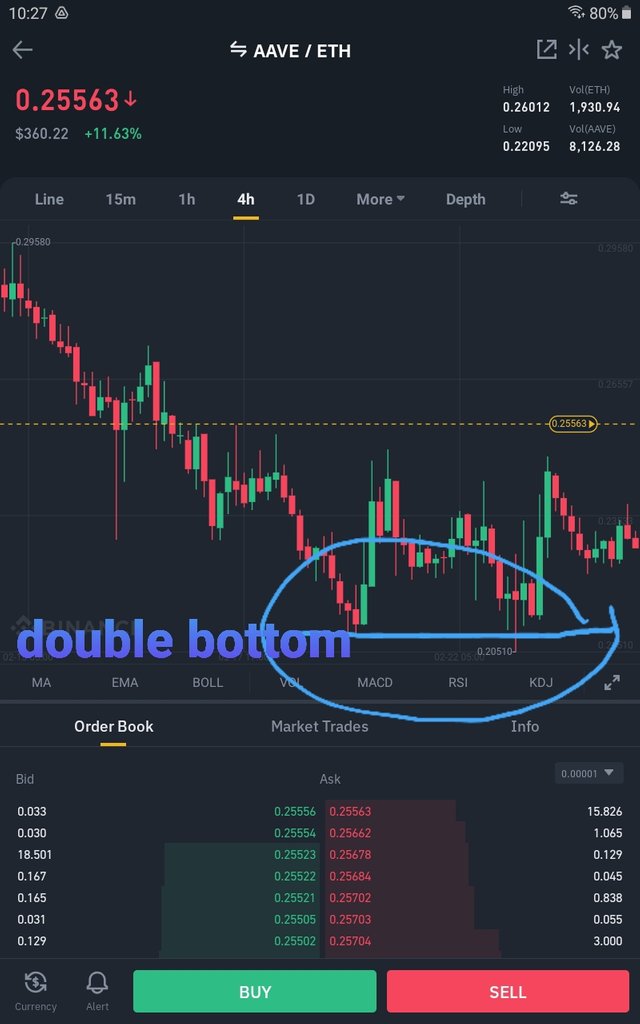
##What Is A Double Bottom Pattern? (Explain with one of the crypto coin charts where the Double Bottom Pattern identified.)
The double bottom formation is when the price of an asset reaches its low point twice after pulling back and being unable to break out of the support down.this indicates that the downtrend is reaching its end and thus the uptrend is about to start. It is a good entry point for a buy market with minimal stop loss range.
In Investing & Trading What Is The Importance of Stop Level(STOPLOSS)?
Stop loss is an order placed by the trader, setting the price at which he wishes to exjt the market to avoid further losses. Sometimes, our technical analysis might be good, but the market makers may decide to change the direction of the market, at that point the stop order reduces the losses to be incurred.
Where To Find & How To Set A Stoploss?
A trader can find where to set his stop loss from the chart pattern by taking nkte of the resistance and supports of the assets history.
To set a stop loss, for example we want to enter a buy trade, we should find the next two supports below where we are entering the trade from. So depending on the size of our equity, we choose the support that suits us and set our stop loss there. Same is applicable when we are taking a sell trade, we need identify the next two or three resistance points, and decide where to place our stop loss depending on equity size.
What Understood From This Course?/ Conclusion.
I should make it a must to always set a stop loss when taking a trade.
Try to enter a trade once i see an indication of a reversal pattern to have a minimal stop loss range and make more profit.
I have also understood price breakouts and know how to take advantage of it.
Identify continuation patterns of a trend so as determine best entry point.
Understood double bottom and double top patterns and their roles in assisting me take a profitable trade.
Thank you for this well prepared lecture.
cc: @steemcurator01
cc: @steemcurator02
Cc: @stream4u
I am a member of @steemalive community

Subscribe:::Discord.
:::Whatsapp :::**[join trail](https://steemit.com/hive-167622/@steemalive/how-to-join-steemalive c
Hi @benton3
Thank you for joining Steemit Crypto Academy and participated in the Homework Task 3.
Your Homework task 3 verification has been done by @Stream4u.
Thank You.
@stream4u
Crypto Professors : Steemit Crypto Academy
Downvoting a post can decrease pending rewards and make it less visible. Common reasons:
Submit
Ok, well taken.
Downvoting a post can decrease pending rewards and make it less visible. Common reasons:
Submit
Congratulations!!!! You have been upvoted by @ngoenyi and I’m voting with the Steemalive Community Curator @steemalive account to support our community members. Keep on making great content and always stay active in the community to recieve further support
Downvoting a post can decrease pending rewards and make it less visible. Common reasons:
Submit