QUESTION 1
In your own words, give a simplified explanation of the CMF indicator with an example of how to calculate its value
The Chaikan Money Flow Indicator
Definition
The Chaikin Money Flow is a technical indicator which is self-defining from its name. The chaikin money flow measures money flow volume over a defined period of time.
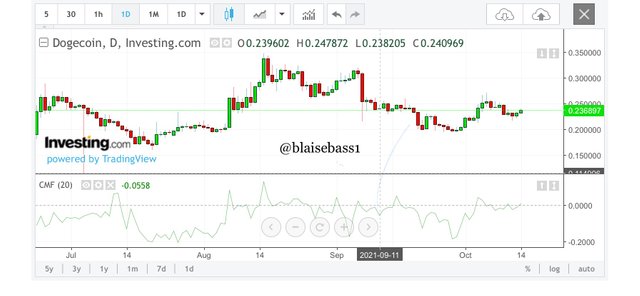
The concept was created by the famous Marc Chaikin which was principally used in measuring the buying and the selling pressures an asset for a single period. The most popular look back period with the chaikin money flow is the 20 or the 21 days. Meaning the chaikin money flow sums the money flow volume over that defined period of 20 or 21 days.
Normally, the chaikin money flow value will fluctuate between the valueess of 1 and -1, which is being used in quantifying the changes in the buying and the selling pressures in the anticipation of future of changes.
Calculation
Lets now dive into the calculation of the chaikin money flow indicator, I will be using 3 steps which are the money flow multiplier, the money flow volume and the calculation of the chaikin money flow. Let’s dive into it.
Step 1
The money flow multiplier (MFM)
[ (close – low) – (high - close) ] / (high - low)
Step 2
The money flow volume
MFM * Volume for the period
Step 3
The chaikin money flow
21 period sum of money flow / 21 period sum of volume
Let’s take for instance the values for a crypto X of 21 periods
Close = $210
high = $215
Low = $204
Period volume = $1400
Total period volume = $10000000
Then, we begin by calculating
The money flow multiplier (MFM)
[ (210 – 204) – (215 - 210) ] / (215 - 204)
6-5 / 11 = 1/11
We then calculate the
The money flow volume
MFM * Volume for the period
1/11 * 1400 = 127.27
And finally
The chaikin money flow
21 period sum of money flow / 21 period sum of volume
127.27 / 10000000
= 0.00
Therefore my CMF = 0.00

QUESTION 2
Demonstrate how to add the indicator to the chart than the trading view platform. Highlighting how to modify the settings of the best period
Adding the Chaikin Indicator to a chart
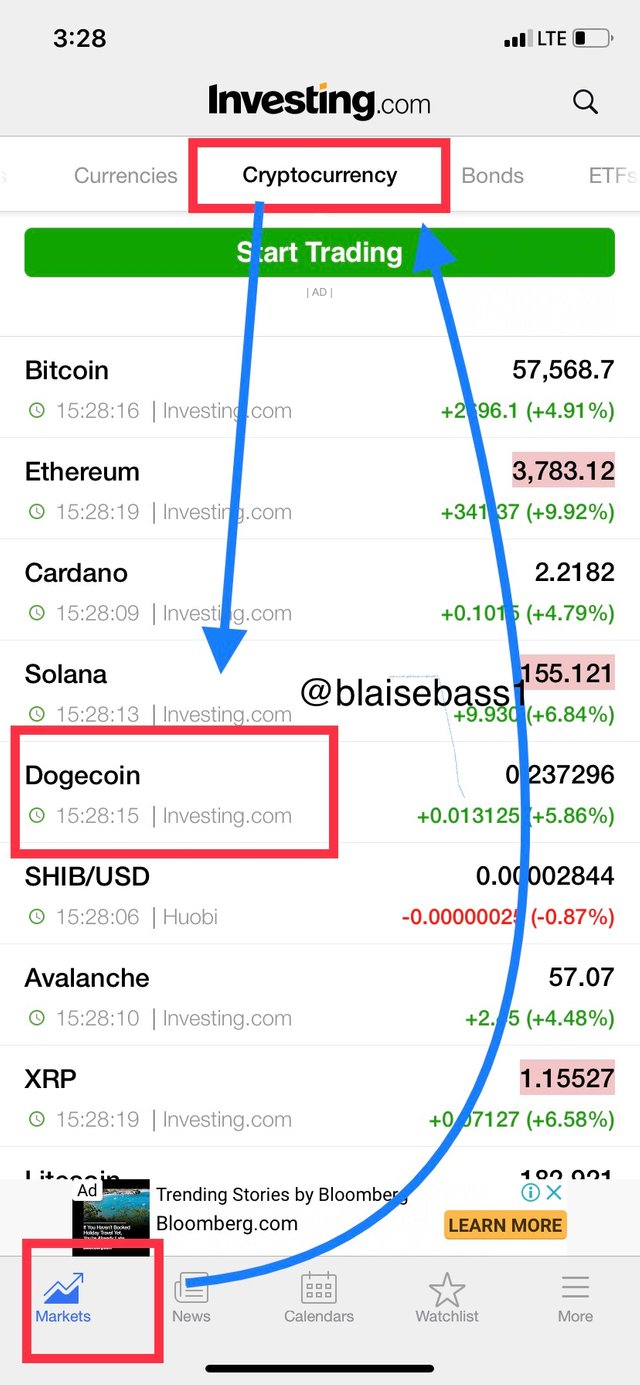
I will be demonstrating using the investing.com platform. We begin by logging into the investment.com platform and on the market tab we click and take cryptocurrency which I will be selecting the dogecoin cryptocurrency to demonstrate with.
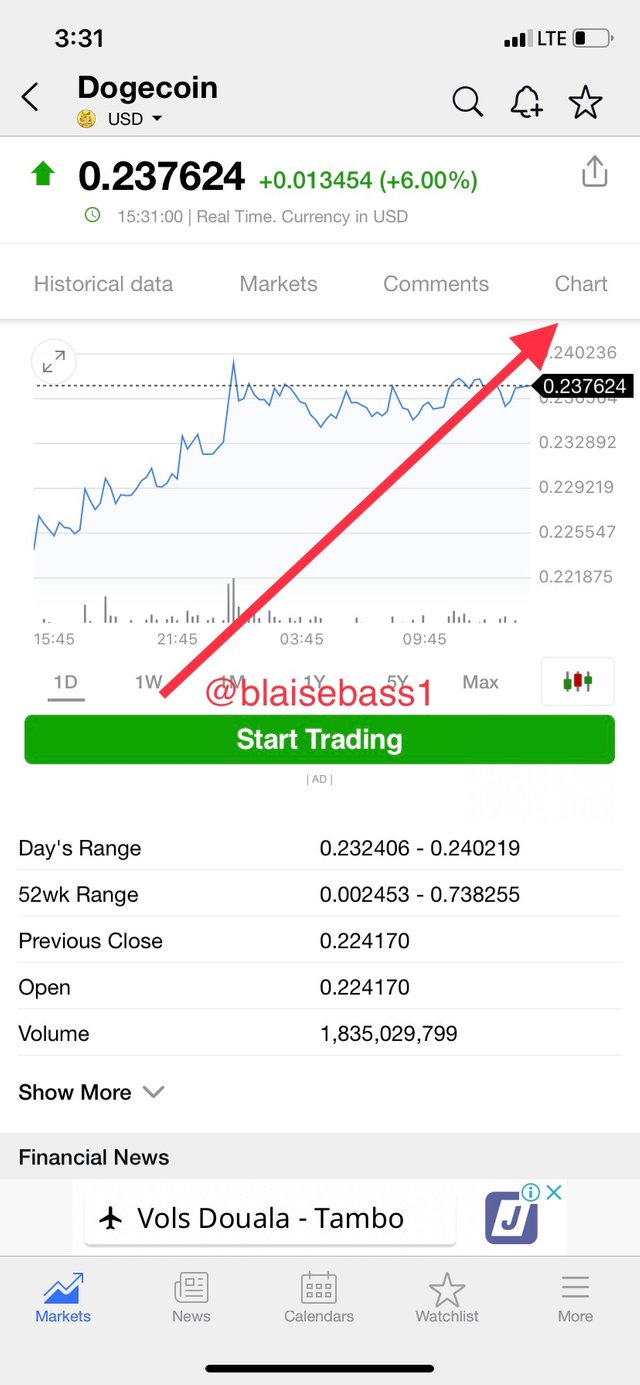
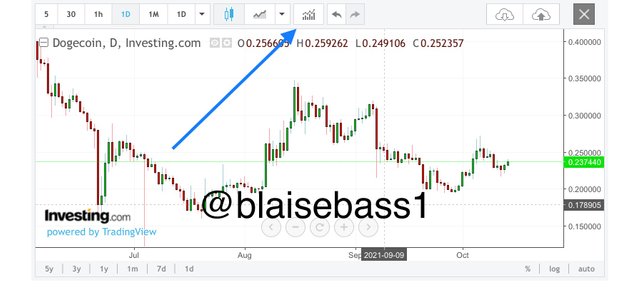
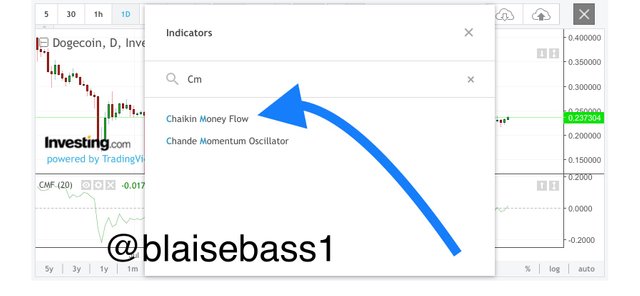
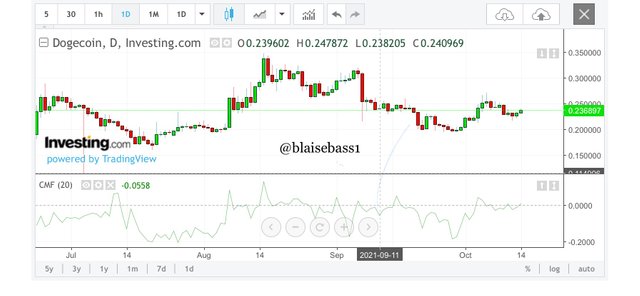
I then click on chart and on the logging I click on the indicator tab which I search the chaikin money flow and click on it. This can be shown in the screenshot below.
Configuration
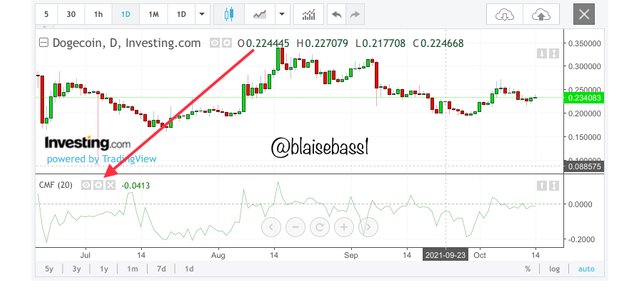
To configure the indicator, I click on the indicator window and take the settings button as shown below.
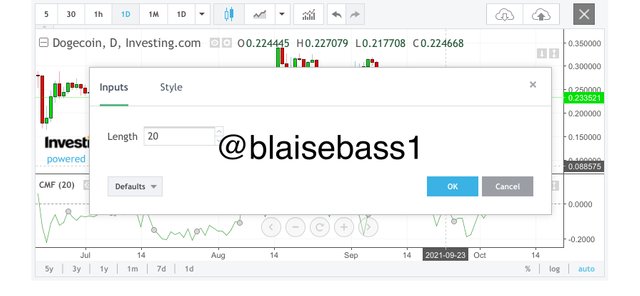
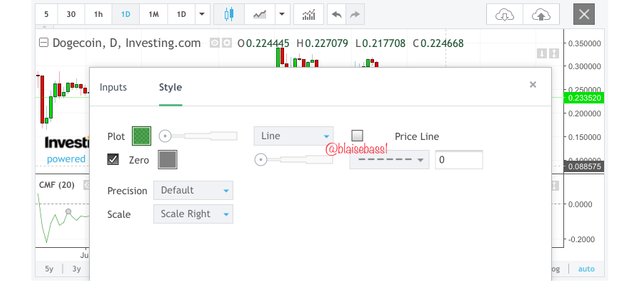
We can then configure the length to whatever we want. Normally, the indicator length is set to default at the value of 20 or 21. This is believe to be the best settings of the indicator as that was set and calculated by the developer of the indicator. However a trader can modify to suit his/he trading by using a shorter period if a scalping trader and a longer period if a day trader.

QUESTION 3
What is the indicators role in the confirmation of the direction of the trend and determining entry and exit points for buy and sell
Confirmation of the direction of trend
As explained above, the chaikin money flow indicator shows the buying and the selling pressure on the money flow volume within a defined period and the value of the indicator ranges between 1 and -1. I will then be explaining the trend confirmation on bullish and bearish season.
Bullish Trend
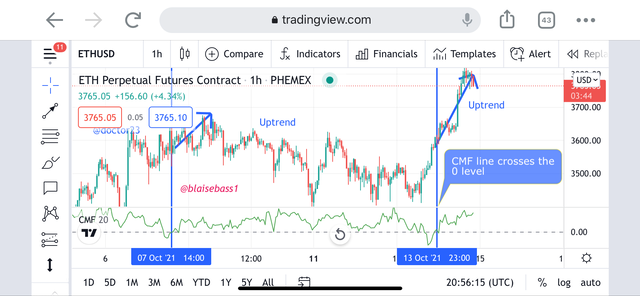
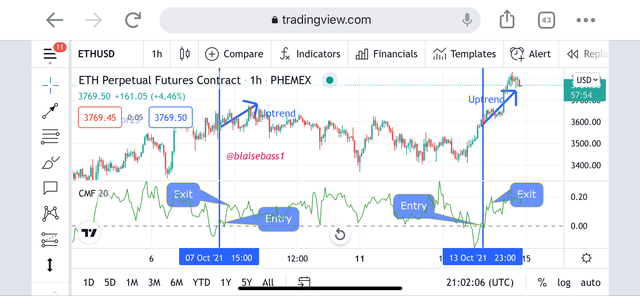
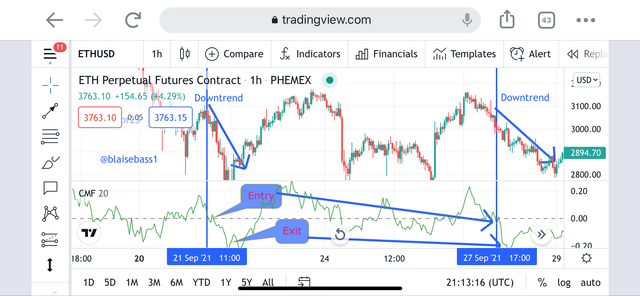
We confirm the bullish trend when the indicator line crosses above the 0 level which is the midpoint and start moving towards the positive values. As it increases it shows the stronger the strength of the trend.
I will be using the eth/usdt to show the various entry and the exit points. As explained earlier above, the buy is shown when the indicator line crosses the 0 level upward and the exit will be portrayed by the line showing a reverse and moving downward.
Bearish Trend
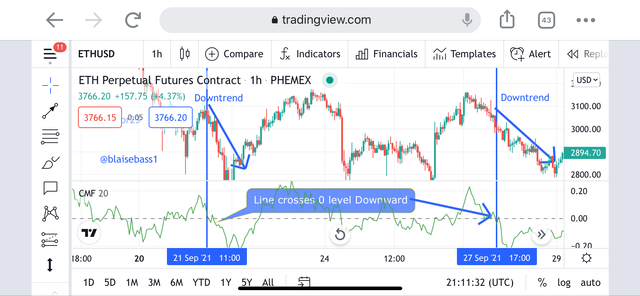
We confirm the bearish trend when the indicator line crosses below the 0 level which is the midpoint and start moving towards the negative values. As it increases it shows the stronger the strength of the trend.
I will be using the eth/usdt as well to show the various entry and the exit points. As explained, the sell is shown when the indicator line crosses the 0 level downward and the exit will be portrayed by the line showing a reverse and moving upward.

QUESTION 4
Trade with a crossover signal between the cmf and wider lines such as +/- 0.1 or 0.15 or 0.2, identifying the most important signals that can be extracted using several examples
Trading with Crossover signals
I will be illustrating the cross overs with the usage of the +/- 0.1 and the +/- 0.15 to illustrate the buy and selling opportunities with the strategy.
Using the +/- 0.1 level
Buying opportunities
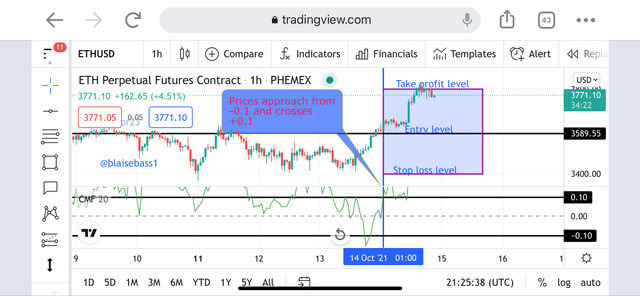
The buy signal is confirmed when we have the indicator line crosses above the 0.1 level which moved from the -0.1 level. The proper entry is done at the close of the current candle after the cross. The exit point is placed below the recent swing point and the take profit can be set to risk to reward ratio of 1:1 as we can see below.
Selling Opportunities
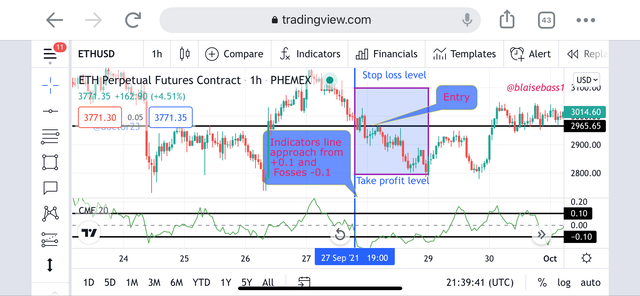
The sell signal is confirmed when we have the indicator line crosses below the -0.1 level which moved from above the 0.1 level. The proper entry is done at the close of the current candle after the cross. The exit point is placed above the recent swing point and the take profit can be set to risk to reward ratio of 1:1 as we can see below.
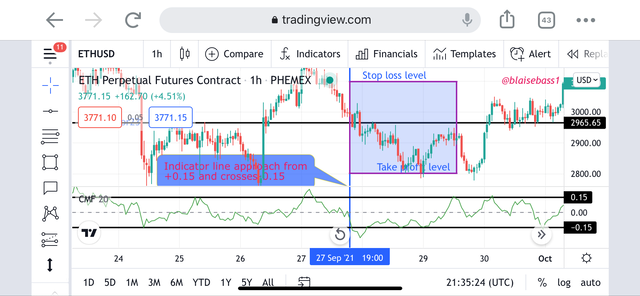
Using the +/- 0.15 level
Buying opportunities
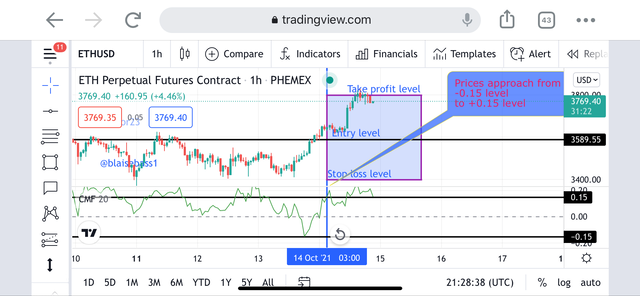
The buy signal is confirmed when we have the indicator line crosses above the 0.15 level which moved from the -0.15 level. The proper entry is done at the close of the current candle after the cross. The exit point is placed below the recent swing point and the take profit can be set to risk to reward ratio of 1:1 as we can see below.
Selling Opportunities
The sell signal is confirmed when we have the indicator line crosses below the -0.15 level which moved from above the 0.15 level. The proper entry is done at the close of the current candle after the cross. The exit point is placed above the recent swing point and the take profit can be set to risk to reward ratio of 1:1 as we can see below.

QUESTION 5
How to trade with divergence between the cmf and the price line. Does this trading strategy produce false signals?
Trading divergence with CMF
Bullish Divergence
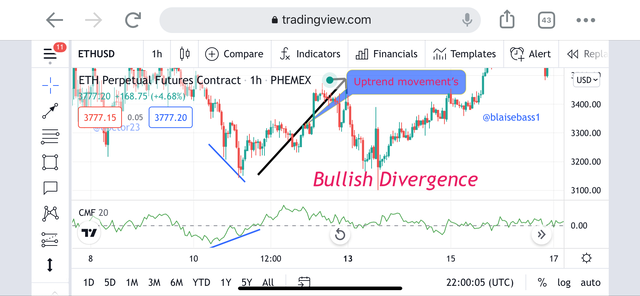
The bullish divergence is a scenario we see in trading in which the indicator line shows a bullish move with the formation of higher highs and higher lows while the prices simultaneously forms a downtrend with the formation of lower highs and lower lows. This divergence comes about with a trend reversal which is a proper entry for a buy order.
Bearish Divergence
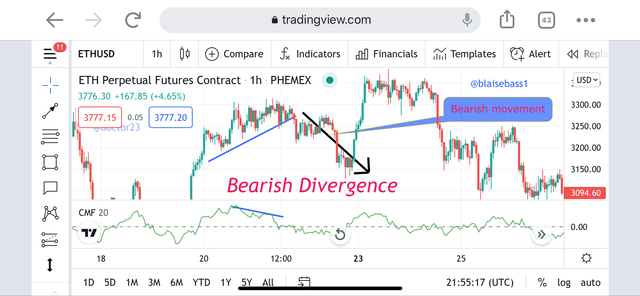
The bearish divergence is a scenario we see in trading in which the indicator line shows a bearish move with the formation of lower lows and lower highs while the prices simultaneously forms an uptrend with the formation of higher lows and higher highs. This divergence comes about with a trend reversal which is a proper entry for a sell order.
false signal with the trading strategy
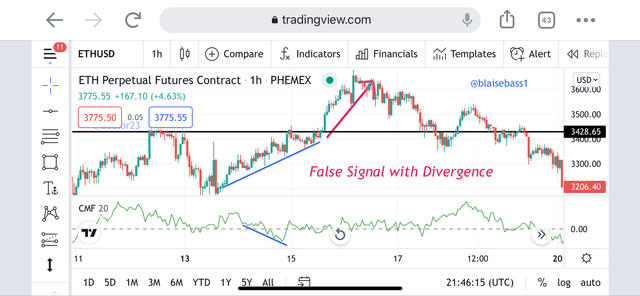
Normally, no trading strategy is 200% accurate. This is the main reason we have the aspect of confluence in the whole of trading to confirm signals from multiple indicators. It is for this reason that the strategy of the divergence itself can generate false signal as we have the interaction of liquidity levels by whales and big institutions, this is further explained in the screenshot below.

Conclusion,
The chaikin money flow is a technical indicator that used in measuring the money flow volume over a defined period. The indicator can be used to determine the strength of the strength of using its 0 level. A cross above the 0 level indicates a bullish trend and a cross below indicates a bearish trend.
We can also increase the strategy with the usage of +/-0.1 level, +/-0.15 level and +/-0.2 level.
Another great strategy with the chaikin money flow indicator is the usage with bullish and bearish divergence to determine trend reversals.
Unfortunately, after our checks and investigations, we found that you have many accounts. There are similarities in content between users - @blaisebass1 & @doctor23; In addition to several transfers between them.
Total|0 /10
Operating an alternate account to earn a disproportionate reward is a flagrant violation of Steemit Cryto Academy. Hence, you are now blacklisted.
Thank you.
Downvoting a post can decrease pending rewards and make it less visible. Common reasons:
Submit
Thank you sir
I’ll ensure I do better in the days ahead
Downvoting a post can decrease pending rewards and make it less visible. Common reasons:
Submit