
Introduction

Question 1
The Bichi Strategy
The Bichi Strategy is a trading strategy that is discovered by our own professor @utsavsaxena11. This strategy involves the use of two different indicators simultaneously that is the Bollinger bands and the Ichimoku Clouds. I Predict its name is gotten from the "B" in Bollinger and "ichi" in Ichimoku. I think that is where we got the name Bichi from.
These two indicators are used in measuring the strength and momentum of crypto assets as has been discussed previously in some of the lectures given by other professors. Bollinger bands indicator is used in measuring and identifying the resistance and support of the price level of an asset whilst the Ichimoku clouds are used in identifying or predicting the price movement of an asset.
The combination in use of these two indicators is what is termed the Bichi Strategy. This strategy is about 80% or more accurate and I think traders should implement this trading because its success rate is really amazing. This strategy can be utilized in different time frames in identifying trends and patterns of crypto assets.
Identifying Trends Using the Bichi Strategy
We would be looking at how to identify the various types of trends using the Bichi Strategy, i.e. bullish trend, bearish trend, and sideways trend. We would look at the Bullish trend or the Uptrend.
Uptrend:-
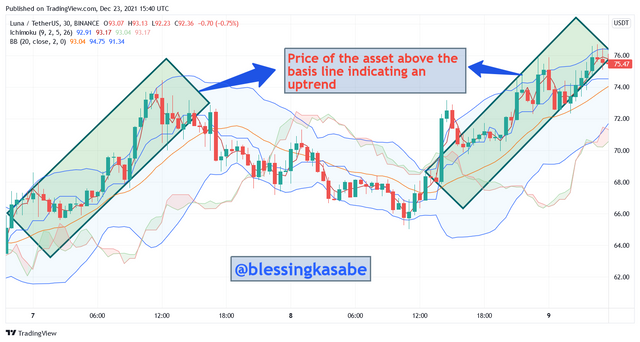
An uptrend is indicated when the price of an asset is moving in an upward direction and creating new higher highs during the trend. To identify an uptrend using this strategy, first of all, we look at and analyze the Bollinger Bands indicator to identify the point where it provides support and resistance to the asset's price. When this is confirmed, we then wait for the breakout of the second indicator i.e. the Ichimoku Clouds in an upward direction.
Immediately when the price of the asset breaks the Ichimoku Clouds in an upward direction, the Bollinger Band's basis line serves as the support level of the asset's price and therefore confirms the commencement of an uptrend or a bullish trend. A good illustration is shown below using a crypto chart.
Downtrend:-
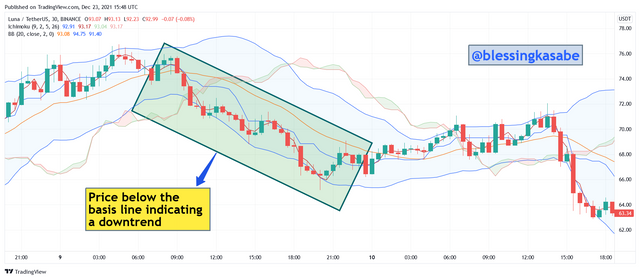
A Downtrend is indicated when the price of an asset is moving in a downward direction and creating new lower lows during the trend. To identify a downtrend using this strategy, first of all, we look at and analyze the Bollinger Bands indicator to identify the point where it provides support and resistance to the asset's price. When this is confirmed, we then wait for the breakout of the second indicator i.e. the Ichimoku Clouds in a downward direction.
Immediately when the price of the asset breaks the Ichimoku Clouds in a downward direction, the Bollinger Band's basis line serves as the resistance level of the asset's price and therefore confirms the commencement of a downtrend or a bearish trend. A good illustration is shown below using a crypto chart.
Identifying Trend Reversals Using the Bichi Strategy
Trend reversal as we all know, do mostly occurs in trades and traders must be more vigilant to them during trades. Trend reversal as the name suggests is a sudden change in the direction of the price movement of an asset either from a downtrend to an uptrend or changes from an uptrend to a downtrend. They are sometimes good for traders and also bad sometimes as well. Now let's look situation whereby a trend reversal occurs from a downtrend to an uptrend.
Downward Trend Reversal:-
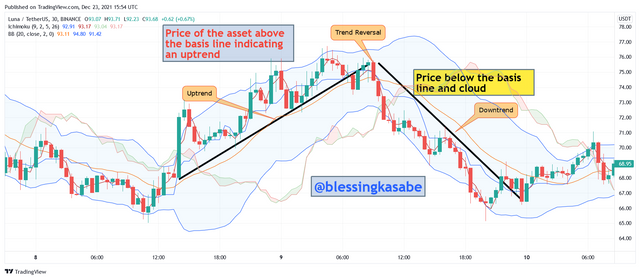
This type of trend reversal is identified using the Bichi Strategy through the aid of the Bollinger Bands and Ichimoku clouds indicators. To identify this, we look at the price movement of the asset and the Bollinger Bands to see if they are both in a downward movement, and immediately after that the asset's price moves sideways leading to the breakout of the Ichimoku Cloud severally by the asset's price.
Immediately when this happens, there is a signal or confirmation of a trend reversal to occur and the asset's price is later seen to change in direction after the sideways trend. A good illustration of this is shown on a crypto chart below.
Upward Trend Reversal:-
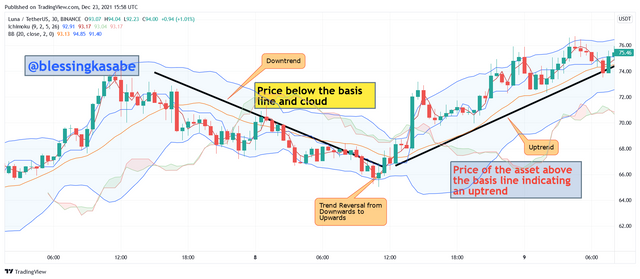
This type of trend reversal is identified using the Bichi Strategy through the aid of the Bollinger Bands and Ichimoku clouds indicators. To identify this, we look at the price movement of the asset and the Bollinger Bands to see if they are both in an upward movement, and immediately after that the asset's price moves sideways leading to the breakout of the Ichimoku Cloud severally by the asset's price.
Immediately when this happens, there is a signal or confirmation of a trend reversal to occur and the asset's price is later seen to change in direction after the sideways trend. A good illustration of this is shown on a crypto chart below.
Trading using the Bichi Strategy
Buy Trade:-
To place a buy order using the Bichi trading strategy, the following steps must be followed in order to place a buy trade;
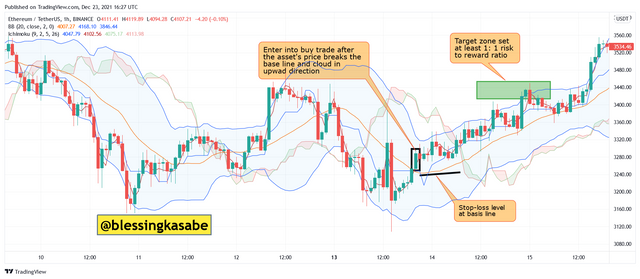
First of all, we navigate and identify an uptrend in the price of the asset
We then check to see if the asset's price is moving above the basis line or not. If it does, then the basis line serves as the support for the asset's price.
We then wait for the asset's price to break the Ichimoku Cloud indicator in the upward direction.
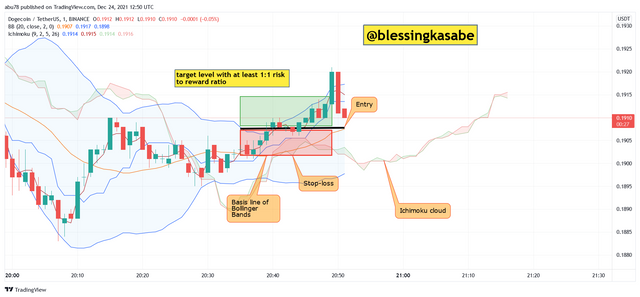
Immediately this occurs, we then execute our buy entry and this is done on the candle just after the breakage of the Ichimoku Cloud indicator.
Stop-loss is placed at the basis of the Support level of the Bollinger Bands indicator. We also set our risk to rewards ratio at 1: 1 and set our target level as shown on the chart.
Sell Trade:-
To place a sell order using the Bichi trading strategy, the following steps must be followed in order to place a sell trade;
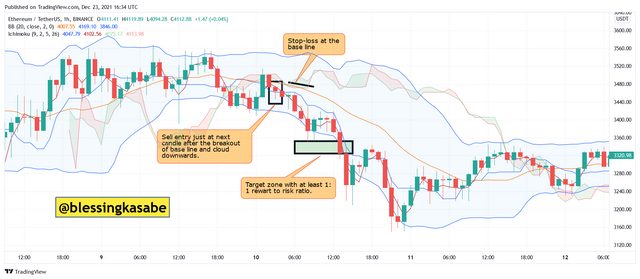
First of all, we navigate and identify a downtrend in the price of the asset
We then check to see if the asset's price is moving below the basis line or not. If it does, then the basis line serves as the resistance for the asset's price.
We then wait for the asset's price to break the Ichimoku Cloud indicator in the downward direction.
Immediately this occurs, we then execute our sell entry and this is done on the candle just after the breakage of the Ichimoku Cloud indicator.
Stop-loss is placed at the basis of the Resistance level of the Bollinger Bands indicator. We also set our risk to rewards ratio at 1: 1 and set our target level as shown on the chart.
Demo Trade Using the Bichi Strategy:-
I would be trading a buy order using the Bichi Strategy. The following steps are followed;
First of all, we navigate and identify an uptrend in the price of the asset
We then check to see if the asset's price is moving above the basis line or not. If it does, then the basis line serves as the support for the asset's price.
We then wait for the asset's price to break the Ichimoku Cloud indicator in the upward direction.
Immediately this occurs, we then execute our buy entry and this is done on the candle just after the breakage of the Ichimoku Cloud indicator.
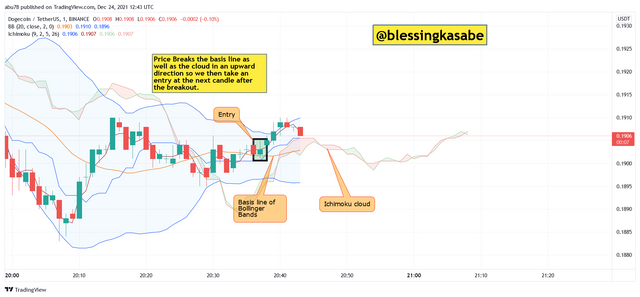
From the above chart, we can see that the price of DOGEUSDT breaks the baseline and also breaks the Ichimoku cloud in an upward direction and this is a clear indication of a possible uptrend and therefore we take a buy entry at the next candle immediately after the breakout.
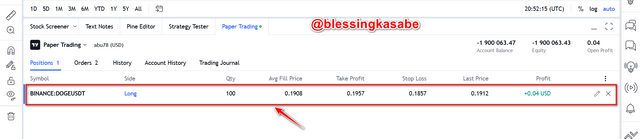
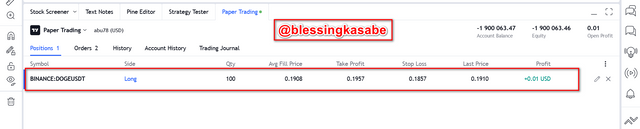
The above screenshot shows some details of my trade after entry, we can see that a profit of $0.04 has already been made. Also, the stop-loss is placed at the baseline of the Bollinger bands, and the target is placed at a 1: 1 risk to reward ratio.
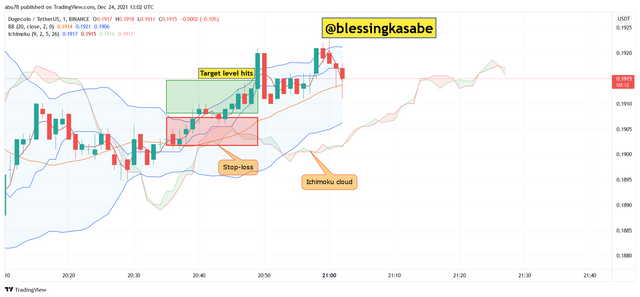
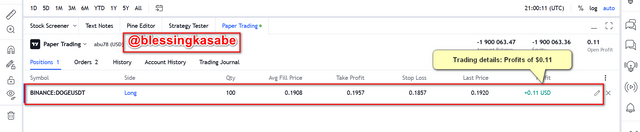
From the above screenshot, the target level for my trade has hit and a profit of $0.11 was made to the initial $100 entry I executed. This shows how we can equally sure the Bichi strategy to make huge profits in the market.
Opinion:-
This trading strategy can be used in trading using smaller time frames such as 1 minute, and 3-minute time frames.
The Bichi strategy is somehow risky but provides huge profits when setup goes in the right manner.
During trading, signals are cleared and this makes it very easy to use.
The success rate of this trading strategy to me personally can say 80% and above.
Question 2
The Crypto IDX
Crypto IDX is just an index combination of four cryptocurrency assets, that is it is the average price of four cryptocurrencies. These four cryptocurrencies include; Bitcoin, Litecoin, Zcash, and Ethereum.
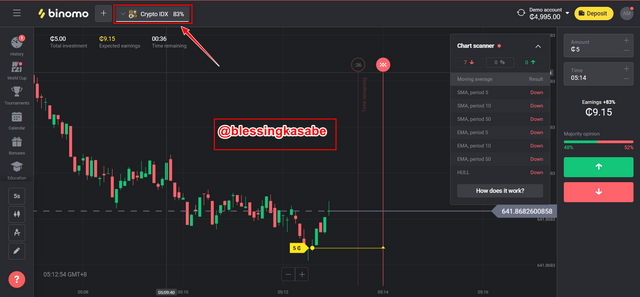
The Crypto IDX index can be found on the Binomo trading platform. The Crypto IDX calculation is done with the aid of software because its calculation is complex and complicated.
The Binomo platform is currently available to approximately more than 130 countries around the globe and also has more than 890, 000 users. Prediction trading can be done using the Crypto IDX in the Binomo platform. To do this, we first predict the price of an asset to either go up or down, and if the prediction goes right then we earn. The Binomo platform is mainly meant for traders who are fully active in trading for long positions. This platform is not recommended for novice traders.
The ALT IDX
The ALT IDX is just like the Crypto IDX but in this case, the four index cryptocurrencies are the top 4 altcoins. Its calculation involves the use of the four altcoins and they include, Litecoin, Monero, Ripple, and Ethereum.
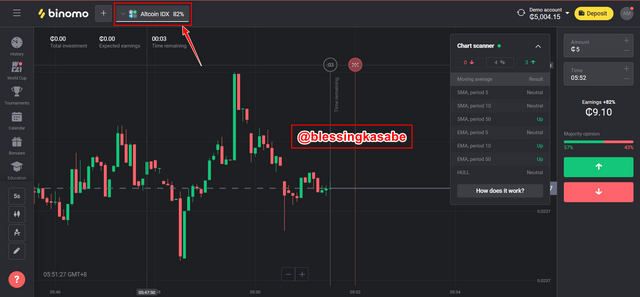
Similarly, the ALT IDX is also calculated with the aid of software, and with this not only the asset's price is calculated but also the demand and supply of the asset are calculated as well. The ALT IDX index is also found on the Binomo platform just like the Crypto IDX. Similarly, with the ALT IDX, we cannot perform spot trading but rather prediction trading can be done.
The Benefits of Trading with IDX Index
The following includes some of the benefits of trading the IDX index;
IDX index is suitable and favorable for short-term trades. IDX index makes it possible for 5-second candle charts to be drawn.
The IDX index is available 24 hours which means one can trade with it at any time
The IDX index provides a higher profits margin which is approximately between 75 to 85% for every accurate trade executed.
Signal Prediction Trading:-
Signal prediction trading is a type of trading whereby a trader does not buy or hold any asset but rather predicts the price of the asset to either move upwards or downwards for a specific given time. Signal prediction trading is quite different from spot trading whereby a trader buys and holds an asset in his/her wallet and later sells it at a higher price so as to make a huge profit. In signal prediction trading, when trades go in the right way, a good profit of approximately 75% can be obtained.
Legal or Illegal:-
The Crypto IDX being an index of the Binomo platform is legal in our country here. The Binomo platform provides a reliable and trustful platform for its users to perform short trades in order to earn some profits.
The Crypto IDX is legit here in Ghana and we can even see positive feedbacks from their platform through their website. As proof of its services to its users, it is being regulated by the International Financial Commission and also it possesses different registered offices addresses which one can locate. The Binomo platform has many achievements which including an award for IAIR and FE award for excellence in the financial global market.
Question 3
What is Penny Cryptocurrencies?
Penny cryptocurrency as the name suggests is any digital coin that has a value of approximately $1 or less. Penny cryptocurrencies are like the stock but with lower prices and this is where the name "penny" is gotten from. Investing in penny cryptocurrencies has a high chance of earning huge profits.
Creating my IDX
In doing this the following are taken into consideration;
Check the circulating supply of the currency to be at least 10 million or above.
Check if the coin is listed on popular exchanges such as Binance.
Check the liquidity of the coin is good or not
Check to see if the team of the coin are experience people or not.
Through the analysis of these four main factors above, the following are the four coins that I would choose for my IDX; Stellar Lumens (XLM), Ravencoin (RVN), VeChain (VET), and Ripple (XRP).
Stellar Lumens (XLM):-
The Stellar Lumen provides a cross-border payment platform for users and it is also popular in the crypto market and has recorded more than $530 million trading volume per day. It has been ranked at 13 as one of the valuable cryptocurrencies in the crypto market.
The Stellar Lumens coin is managed and controlled by the Stellar Development Foundation which is a non-profit foundation. The foundation was first launched in 2014 by Jed McCaleb. The Stellar Lumens coin is to provide a platform that would be an open financial system that can provide access to all levels of income to perform transactions at a higher and faster speed and at a low cost as well.
The XLM provides services such as; micropayments, mobile branches, mobile money, remittances, etc.
Ravencoin (RVN):-
The Ravencoin coin is also a popular coin listed on almost all platforms with a good level of liquidity and also an experienced team behind it. The Ravencoin also has a strong blockchain network (third-generation blockchain) that operates on scalability and interoperability.
The founder of Ravencoin is no other person than Bruce Fenton. The Ravencoin is like the BTC currency just that it has a low price.
VeChain (VET):-
The VeChain coin is a blockchain-based supply chain that focuses on lessening the financial issues of the real world. It does this by solving issues regarding supply chain management. The VeChain blockchain has two different coins and they are; VET and VTHO.
The VTHO is awarded as a reward for staking VET on the blockchain network. The VET is one of the popular penny cryptocurrencies which has a supply of about 86 billion in the crypto market. VET also has a good level of liquidity and is also almost available on all platforms.
The VeChain network or blockchain is supported by the PwC and over 500 other companies which include; H&M, BMW China, etc.
Conclusion
To conclude, I would like to provide a summary of what has been done so far in this article. First of all, we discussed the Bichi trading strategy which was founded by our own professor @utsavsaxena11. We looked at how to identify trends using the Bichi strategy. We also used this strategy to identify trend reversals using crypto charts in the market. We again used the Bichi strategy to identify entry and exit points in the market. We also performed a buy demo trade using the Bichi strategy.
Furthermore, we discussed the Crypto IDX and the ALT IDX and also looked at what signals prediction trading is and how is different from spot trading. We discussed the legality of crypto IDX in my country and we found out that it is legal here in Ghana.
Moreover, we defined penny cryptocurrency and provided four different penny assets that I will choose if I want to create my own Penny IDX. Finally, I provided reasons for choosing the above penny currencies for my IDX.
I would like to say a very big thank you to professor @utsavsaxena11 for this wonderful lecture. I have really understood the concept of "Bichi Indicative Strategy".
Thank You.