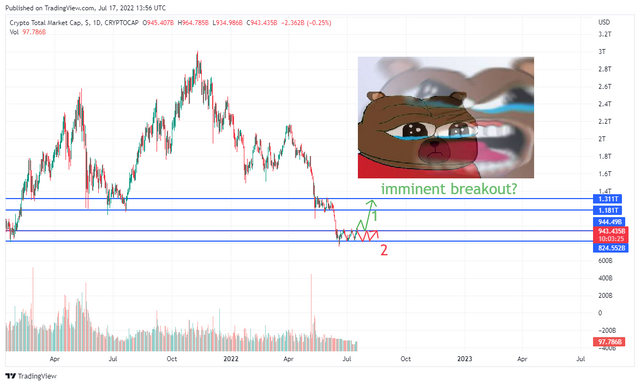
Yesterday was a good day for the bull. After all this time, crypto has finally retested the same resistance for the third time. I don’t usually draw technical analysis charts, especially not during this time, as Jerome Powell can easily invalidate any TA charts in existence. But if the FED stays silent for a while and lets the free market play out, this chart will have value. In the end, a TA chart can only do so much; no wonder most traders lose money in the long term.
The chart sets out 2 possible scenario of TOTAL crypto price action.
TOTAL will breakout the resistance and retest the support (past resistance now become support), then go higher until it hits another resistance.
TOTAL will fail to break out again and continue to consolidate in the current zone.
Note that the more times support and resistance are tested, the weaker they become. This is now the third time TOTAL hits the resistance; if it fails, the fourth time will have a higher chance of success.
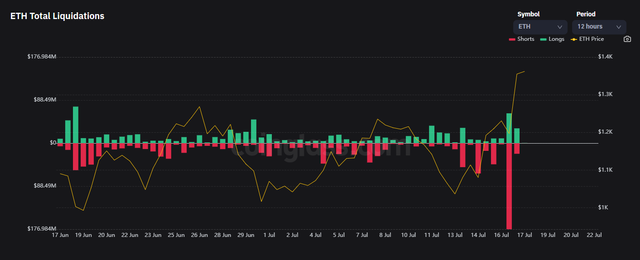
A good day for one man is just a bad day for the other, especially for bears. Yesterday 176m of ETH short position was liquidated. The highest short liquidation since June 15, resulting a short squeeze sending ETH to $1420.

[Source: coinglass.com]
Your post was upvoted and resteemed on @crypto.defrag
Downvoting a post can decrease pending rewards and make it less visible. Common reasons:
Submit