Let's imagine you are planning to take a road trip. Before embarking on this road trip, you decided to check the weather forecast for the upcoming days as it's usually highlighted based on a prediction scale. Why are you checking this weather forecast? So as to be certain of which day to go so as not to be affected by changes in climate.
As you're examining the weather forecast, the noticed all observed some regular patterns of rain on weekends and sunny week days. This information allows you to make informed decisions as to when to make this road trip that will be suitable for you based on the forecast you previewed.
So in this context, the weather forecast earlier mentioned represents historical price charts and you need to make decisions based on this historical price patterns in order to place a buy or sell order. This is done by chartist. Who is a chartist?
What is chartist analysis? And the importance of chart patterns. |
|---|
A chartist is the Trader who uses technical analysis such as chat or graphs of an asset or security historical price to forecast its future trends. Chartist look for price patterns or movement based on the assets historical performance to get a signal or signals used for trading.
So following the illustration giving, chartist analysis is also known as technical analysis although technical analysis is a subset of the chart analysis. This chartist analysis is also called chart analysis. It is a method of evaluating the movement of future price in the crypto ecosystem using historical price charts, patterns and trading volumes.
Chartist rely solely on historical price patterns and trends to predict potential future price movements of an asset bin the crypto market unlike fundamental analysis that focuses on the health of an asset or instrument. To understand chartist analysis, you must understand the following terminologies;
Trends: This is an important term used when describing chartist analysis. It is used to identify or recognise movement in prices such as the upward and the downward movements.
Chart patterns: are used to predict changes in market sentiment, patterns such as head and shoulder etc.
Support and resistance: These levels points to stop or reverse position in prices which helps traders identify entry and exit points.
Importance of chart patterns
Chart patterns provides Traders with visual representations of psychology in the market and potential price movement. It also helps traders make inform decisions about placing buy and sell other in an asset. Let's take another importance in terms of;
- Trend reversal and continuation: chart patterns help Traders identify trend reversals or continuations. It's just like reading a book and at the end of a particular chapter there is a signal that the story line is about to change. This will give the reader a clue same with trading. The chat pattern like double tops or bottoms shows potential reversals while the flags shows continuation of existing trends.
Support and resistance: chart patterns help Traders make informed decisions about entering and exiting trades. For example, you observe the price of an asset repeatedly reaching a particular level and forming and horizontal line. This will make the Trader make informed decisions on when to buy and went to sell.
Price target estimation: chart pattern provides a price target estimate which help Traders identify potential price movement. Chart patterns like triangles offer price target estimates based on the size of the pattern. In a symmetrical triangle pattern, a potential price movement occurs when the distance from the pattern's base to the converging point. If there's a breakout, traders can use this to estimate the target price.
What is the shoulder head shoulder pattern? Show screenshots using the BTC/USDT pair. You can use another cryptocurrency pair if you wish. |
|---|
The shoulder head shoulder chart pattern is reversal pattern in chartist analysis. It's occurs after an uptrend which signals a potential trend reversal to the downside that is from bullish to bearish market sentiment. To understand this chart pattern well, let's take the following illustrations. Light imagine discharge pattern as a road map that indicates a change in direction during a road trip or journey.
Left Shoulder: this left shoulder is like the first hill on a roller coaster. It's more like a roller coaster climbing its first hill which is similar to the upward movement in an asset price. This left shoulder is a peak before a change in price. It actually represents the end of a previous upward trend.
Head: This position is actually the highest point in the chart pattern and resembles the tallest peak on a roller coaster climb compared to the left shoulder. This is actually a . When the asset price reaches its peak after a short lift recovery signaling a possible shift in market sentiment.
Right shoulder: this right shoulder is like the second hill on the roller coaster which is a bit lower than the head. This is a period that represents the downward movement in the price of an asset. It shows that the attempt to continue the upward trend is losing its strength or not compatible with the movement.
A sharp decline in the price of an asset signifies the right shoulder which shows that the upward movement is weakening always in strength. In Trading, they shoulder head shoulder pattern alerts investors or Traders to a potential trend reversal.
Traders can make inform decisions about potential entry or exit points in the market if they understand and recognize the shoulder head shoulder pattern. It also enhances their ability to navigate changing trends in the market.
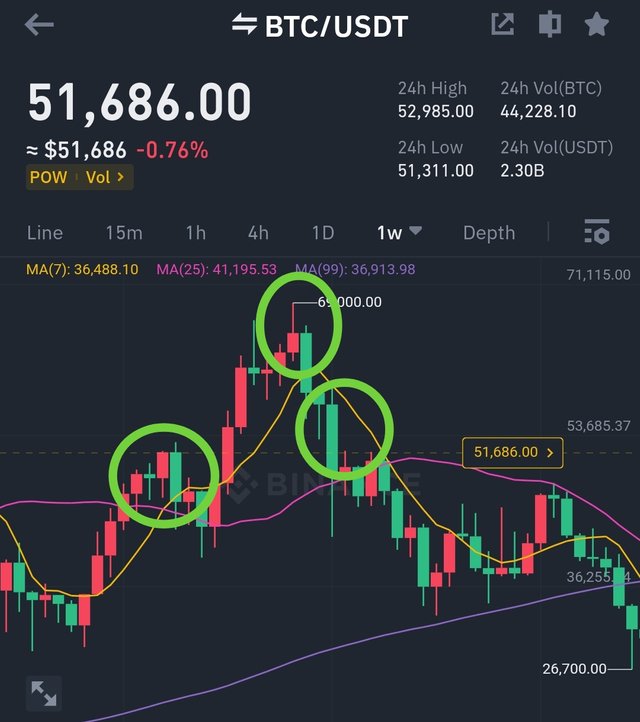
There are three peaks in this graph which is the Left shoulder - Head - Right shoulder as explained in my illustrations. This graph shows an increase in price or an uptrend in the movement of an asset to its peak which is the head and then a sharp decline in the price of bitcoin which shows at that point, its strength was wearing.

In comparison to the other two, the middle peak is higher pointing $69k of BTC which serves as the head. The two shoulders on the Left and right are slightly the same size but not the same. The highest peak formed in the pattern touched $69,000. The breakout from an uptrend took place immediately after the pattern closed, almost near the price of $35k.
So combining these together, we have it that during an uptrend, the price of an asset increases which signifies the left shoulder. It increases before reaching a peak which happens to be the head.
Explain the formation of the inverse head shoulders pattern. Show screenshots of a cryptocurrency pair that displays this pattern. |
|---|
Considering the inverse head and shoulders pattern is more like a reverse as the shoulder head shoulder pattern. To understand this pattern clearly, let's take this illustration. Let imagine your planning a farm in your yard. At some point, due to unfavorable climate, your plants begin to face challenges such as stunted growth and wilting.
This challenges it faces is known as the left shoulder. As you make some adjustments in its growth and application of fertilizer, the plant begins to show sign of improvement which is considered as the head. As the plant continue to improve due to favorable conditions of climate the plants will flourish reaching its full potential which is considered as the right shoulder. So in application,
the head is a situation whereby the price of an asset start facing challenges or depreciating. It will go into a downtrend, reaching a low which may cause panic selling.
Left shoulder: this is actually a point that proceeds the head and brings about a sharp decline in the price of an asset.
Right shoulder: this is a situation whereby buyers game control due to the awkward movement in the price of an asset and a trend reversal may be unlikely considered.
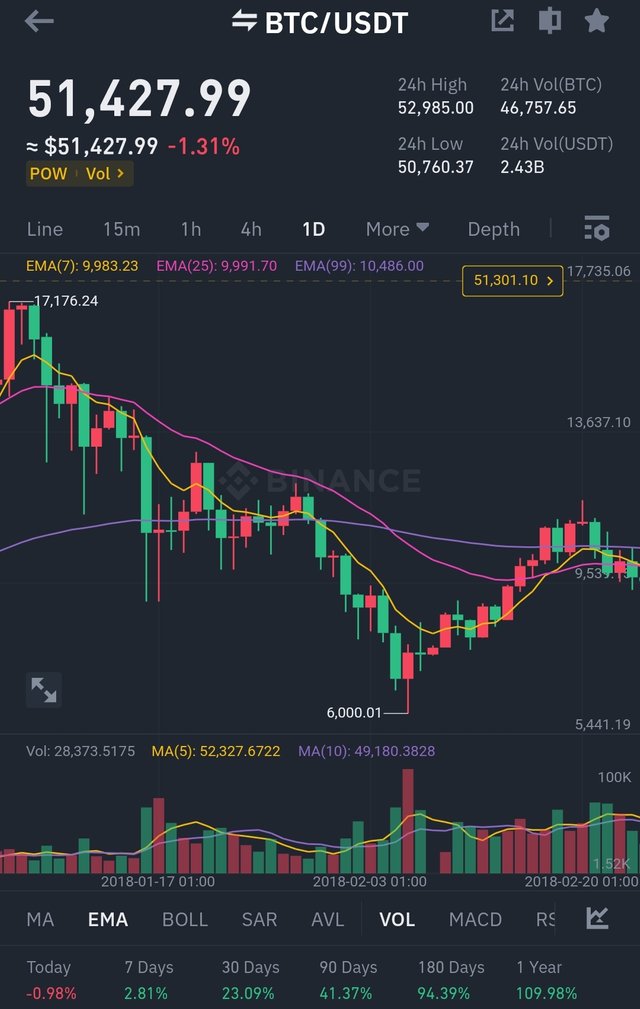
So relating it to the crypto ecosystem, the left shoulder brings about a downtrend of which the price of an asset experiences a decline. It's experiences this decline before reaching a low point which is the head. Then brings about a rise in the price of that asset of which buyers gains control.

So considering the chart above, we can see a point where bitcoin was experiencing serious downtrend or fall till it gets to a point then it started recovering.
For the technical analysis of the Steem, would you use chart patterns? Explain your answer |
|---|
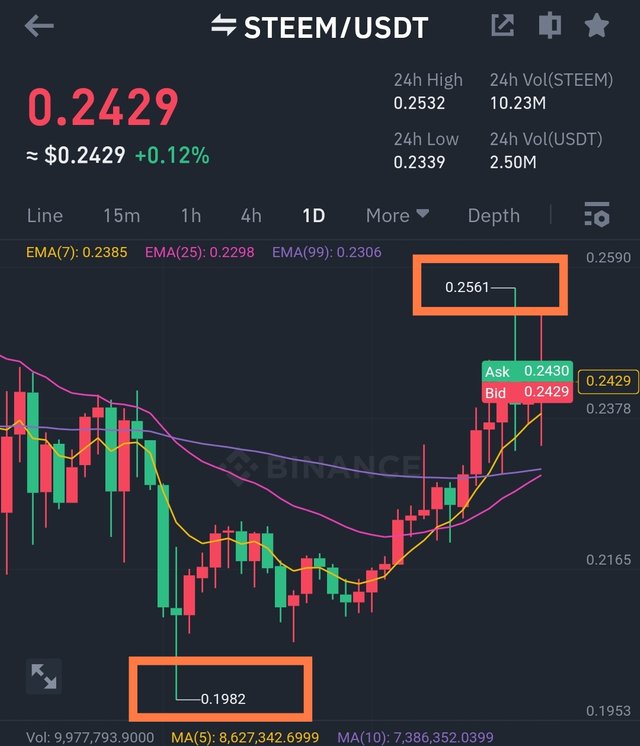
For steem technical analysis, I would use the chart patterns even though steem doesn't move in a speed as bitcoin and other coins. Why is this chart pattern important in analyzing the price of Steem? Chart patterns help identify trends of bullish and bearish meaning that If steem has been experiencing higher highs and lows, the ascending triangle chart pattern can indicate a bullish trend.

If steem has been experiencing series of downtrends, the formation of inverse head and shoulder patterns can indicate a possible shift or reversal to an uptrend movement. So it would actually give me some information regarding the trade I want to place on steem. I invite @basil20, @johnmitchel and @jbeecom
Disclaimer :Any financial and crypto market information provided in this post was written for informational purposes only and does not constitute 100% investment advice. It's just basic knowledge every crypto trader or investor should have
All screenshots are from my binance


Your post gives a very good example to understand the importance of technical analysis. You have explained extreme market conditions through chart patterns and the contrasting Head and Shoulders pattern. It was very clear and useful. Thank you.
Downvoting a post can decrease pending rewards and make it less visible. Common reasons:
Submit
Thanks dear for this comment. I learnt a great deal as well
Downvoting a post can decrease pending rewards and make it less visible. Common reasons:
Submit
Your most welcome dear brother ❣️
Downvoting a post can decrease pending rewards and make it less visible. Common reasons:
Submit
!upvote 40
💯⚜2️⃣0️⃣2️⃣4️⃣ Participate in the "Seven Network" Community2️⃣0️⃣2️⃣4️⃣ ⚜💯.
This post was manually selected to be voted on by "Seven Network Project". (Manual Curation of Steem Seven). Also your post was promoted on 🧵"X"🧵 by the account josluds
Downvoting a post can decrease pending rewards and make it less visible. Common reasons:
Submit
the post has been upvoted successfully! Remaining bandwidth: 40%
Downvoting a post can decrease pending rewards and make it less visible. Common reasons:
Submit
Your post has been rewarded by the Seven Team.
Support partner witnesses
We are the hope!
Downvoting a post can decrease pending rewards and make it less visible. Common reasons:
Submit
https://twitter.com/bossj23Mod/status/1760060736674390508?t=Wc5aqUhNpOOTUb0awm2_5g&s=19
Downvoting a post can decrease pending rewards and make it less visible. Common reasons:
Submit
Your post has been successfully curated by @𝐢𝐫𝐚𝐰𝐚𝐧𝐝𝐞𝐝𝐲 at 35%.
Thanks for setting your post to 25% for @null.
We invite you to continue publishing quality content. In this way you could have the option of being selected in the weekly Top of our curation team.
Downvoting a post can decrease pending rewards and make it less visible. Common reasons:
Submit
Chart analysis is very important for every traders it gives us an idea about the future price so that we can enter the market and make profit Head and Shoulders screenshot is nicely presented by you.Everything is well understood thank you very much God bless you.
Downvoting a post can decrease pending rewards and make it less visible. Common reasons:
Submit
Thank you so much for your comment. I understand this more better now.
Downvoting a post can decrease pending rewards and make it less visible. Common reasons:
Submit
Upvoted. Thank You for sending some of your rewards to @null. It will make Steem stronger.
Downvoting a post can decrease pending rewards and make it less visible. Common reasons:
Submit
Saludos cordiales gran amigo bossj23, un gusto para mi saludarte y leer tu participación.
El chartistas o análisis chartista es una herramienta sencilla de utilizar, de ver y de intuir, por ello es bastante utilizada para ver cambios de tendencia y así tomar una buena decisión de entrar o salir de una operación.
Te deseo muchos éxitos, felicidades por el apoyo que ya llego.
Downvoting a post can decrease pending rewards and make it less visible. Common reasons:
Submit
Greetings brother,
Your post was absolutely fantastic in highlighting the significance of technical analysis. The way you explained extreme market conditions through chart patterns, and specifically mentioned the contrasting Head and Shoulders pattern, was incredibly clear and insightful. It really helped me grasp the concept better. Thank you so much for sharing such valuable information, your expertise in this area is truly impressive. Keep up the great work.
Downvoting a post can decrease pending rewards and make it less visible. Common reasons:
Submit
Head and shoulder pattern and with clear explanation of the neckline is giving true meaning of the definition and I must say you have spent really good time to make post.
The chart analysis are main indicator for analysis
Downvoting a post can decrease pending rewards and make it less visible. Common reasons:
Submit
Hey fantastic breakdown of chartist analysis! Your clear explanations make it easy for everyone to grasp the importance of chart patterns. The shoulder-head-shoulder pattern and its inverse are brilliantly illustrated. Real-life analogies add a nice touch to make it more relatable. Excellent use of screenshots to demonstrate these patterns in the crypto market especially BTC/USDT. The insights on Steem's technical analysis showcase your comprehensive understanding. Best of luck in your trading journey and may your charts always be bullish!
Downvoting a post can decrease pending rewards and make it less visible. Common reasons:
Submit
You have clearly explained what chartist pattern is and how it helps traders to make informed trading decisions.
The head and shoulder pattern is always unique. It works almost everytime it appears on the chart.No wonder it is the toast of many trades.
You have also done your best in using charts to show that even though it is not clear.
You have put in great effort to write this article. Wish you the best in this engagement.
Downvoting a post can decrease pending rewards and make it less visible. Common reasons:
Submit
You've contributed well. Thanks for the little insight
Downvoting a post can decrease pending rewards and make it less visible. Common reasons:
Submit
Hey bro I really love what did he article he shows you are such a creative and innovative individual and I must say I appreciate everything you've done, you article has really filled me with quality knowledge and idea to keep moving especially in the crypto ecosystem
Thanks for sharing wishing you success please engage on my entry too https://steemit.com/hive-108451/@starrchris/steemit-crypto-academy-contest-s15w6-chartist-analysis
Downvoting a post can decrease pending rewards and make it less visible. Common reasons:
Submit
I love this commentary. I'll check up your post now
Downvoting a post can decrease pending rewards and make it less visible. Common reasons:
Submit