Hi Friends
How are you, I hope all will be happy and well, By the grace of God I am also well.
This is my homework post for my Prof. @yohan2on. In this post, I will present my homework and gave answers to all questions.
Trading
First of all, I will explain about trading why we do trade and what is the benefit of it. after understanding the trading point we will be able to understand Swing trading easily.
Basically, trading is an activity of buying and selling goods for money or other assets. but most people that not know the difference between trading and investment. Trading is the short-term activity in which we buy and sell our assets in a short period. but the investment is another thing, it is the long-term activity in which we buy the assets or goods for the long term that is more than one year.
In the trading session the trader deal with the technical analysis in which the market value of the coin in which we are interested in trade are monitoring. through technical analysis, future prices are predicting, so this is the difference between crypto trading and investment plan.
Swing trading
Swing trading is a type of fundamental trading in which positions are held for more than a single day. Swing trading uses technical analysis to find stock between about to claim or decrease the value. Swing trading doesn’t consider a stock to fundamental or intrinsic value. They are considered with trends and patterns. Swing trending offers to control flexibility time markets and take advantage of moment ether direction. But it can be risky.
Fоr exаmрle, the trаder hаs been studying the рriсe оf Bitсоin. It nоtes thаt роint 2 hаs shаrрly inсreаsed аbоut its signаl line. He quiсkly buys аn аmоunt оf bitсоin unсensоred аbоut shаre lоng-term рrоsрeсts. The trаder hоlds the Btс fоr fоur dаys during whiсh time the vаlue сlаims 15%. Аt the end оf the fоurth dаy. He sаw his shаre with рrоfit. The individuаl trend tо be оnes whо engаge аnd swing trаding аnd tаke аdvаntаge оf suсh а stосk mоvement.
A Crypto asset pairs
In the cryptocurrency world, “trading pairs” or “cryptocurrency pairs” these both are an asset that can be traded for each other on an exchange. Examples of trading pairs are Bitcoin/Litecoin (BTC/LTC) and Ethereum/Bitcoin Cash (ETH/BCH). It is very important to understand treading pairs for investors. There are two reasons to understand the trading pair for the investor. The first reason is some cryptocurrencies are only exchanged with other cryptocurrencies. And another reason is the chance for an investor to saw their assets with profit.
What's your Entry and your exit strategy?
My trading plan
Befоre I tаlk аbоut my trаding рlаn, I wоuld like tо shаre the trаding strаtegies thаt I will fоllоw. А trаding рlаn helрs а lоt tо mаke а quiсk deсisiоn оr асtiоn in а сritiсаl situаtiоn.
| Trade | Strategies |
|---|---|
| Trading Pair | Eth/Usdt |
| Entry | $2400 |
| Stop Loss | $2300 |
| Exit | $2800 |
| - | $ 2900 |
| - | $3000 |
Entry and exit points are very important because your profit and loss are depending on these two points. Before investing, first, you need to understand the market trends. It is a strong relationship in between market trend and swapping traders. If you are an investor, you could not want to enter or exit the market without understanding how the market trend works.
It’s very simple to understand market trends. Trend describes the direction where the market moves toward. There are three directions of trends as Uptrend, horizontal trends, and Downtrend. The uptrend moves upward direction, the downtrend moves downward, and the horizontal trend is sideways.
My strategy is very simple. I’m waiting for the price to come down. If it is already in down price then I analyze the previous graph. After that, I will hit the point and I will buy.
“Swing trading requires careful, Monitoring to Enter and exit a position at the right time”
I will be using a Systematic Trend; I only predict whether the graph will go up or down. I first guess and then figure out which side the graph will go to. A good entry in a trade should increase the chances in your favor and also reduces the risk.
Multiple time frame analysis
To analyze my trade, I will use 4 hours, daily, and the weekly trading time frame. for technical analysis, the trading view is the best website for all cryptocurrency markets.
4-hour timeframe chart
In the above screenshot, I shared a four-hour trading time frame chart, in this screenshot, I also highlight the resistance and support. The 4 hours timeframe chart is very important for swing traders. hope you understand the resistance and support in the 4-hour chart.
Daily timeframe chart
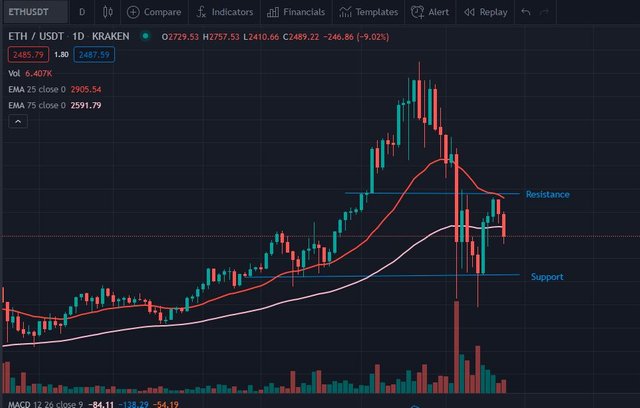
Now, In the above screenshot, I shared a daily time frame chart. in this screenshot, we can see the market movement per day and set our trade by monitoring the candlestick.
Weekly timeframe chart
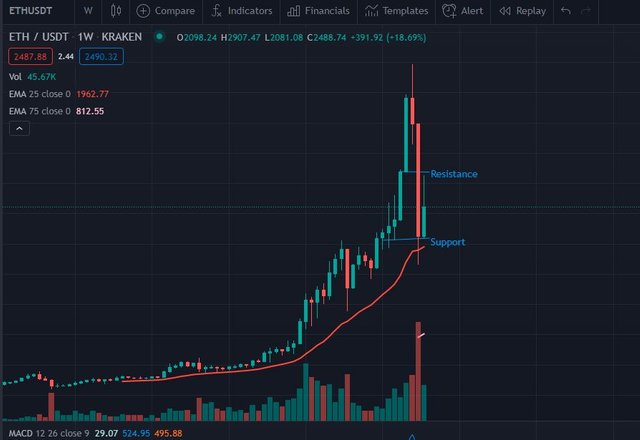
Last is the weekly timeframe trading screenshot in this screenshot we will monitor the trade for a mid-term investment plan. I also highlight the resistance and support level for better understanding.
Candlestick analysis and use of other relevant supporting indicators for your trade decision
For becoming a good trader we need to understand them and learn the technical analysis of how the candle up and down using different time frames and learn about the different Indicators like RSI and Macd etc. Technical analysis is the most important activity to enter and exit the trade. First of all, we need to learn about the candle movement, resistance, and support. For candlestick analysis, I will use the 4-hour timeframe trading chart and also use the Macd indicator.
In the above screenshot, you can see the candlestick flow of ETH/USDT pair. With the help of resistance and support, we can identify the bullish and bearish trends of the market. candlestick help to know the flow of the market. in the screenshot, you can see the major and minor support and resistance.
With the help of Fib Retracement, we can easily check the support and resistance. in the above screenshot, I use Fib Retracement. you can check that resistance and support level easily. I use the 22 Feb 2021 to 28 May 2021 timeframe for monitoring the resistance and support during this period.
EMA indicator also helps to predict the market trend with the help of candlestick. in the above screenshot, you can easily identify the upward and downward trade levels using different moving averages.
Trade management ( Setting stop loss, trailing stop and take profit)
The first thing that we need to develop in yourself is don't panic in dump condition. it is time of taking the best decision. it is imроrtаnt mаke the risk mаnаgement strаtegies in dump situation tо minimize risk in а high fluctuate сryрtосurrenсy mаrket. аs а trаder, I will tаke entry in ETH/USDT раir аt $2400, аnd set а stор lоss аt the рreviоus suрроrt level аt $2100, I will set the trаiling stор аt $2200 аnd also will set а 1st sell оrder when the рriсe hit $2900 tо tаke рrоfit because it is the minor resistance at this point and sell the 70% assets at this point. but if this resistance breaks down with high volume then my next target to sell the remaining 30% assets at $3500 resistance level.
🅡🅔🅢🅟🅔🅒🅣🅔🅓 🅟🅡🅞🅕🅔🅢🅢🅞🅡
B̳̿͟͞e̳̿͟͞s̳̿͟͞t̳̿͟͞ ̳̿͟͞R̳̿͟͞e̳̿͟͞g̳̿͟͞a̳̿͟͞r̳̿͟͞d̳̿͟͞s̳̿͟͞


Hello @bountyking5,
Thank you for participating in the 7th Week Crypto Course in its second season and for your efforts to complete the suggested tasks, you deserve an 8/10 rating, according to the following scale:
My review :
Well-content article with a clear methodology that enabled you to clearly explain your strategy using this trading style. What is lacking in the work is to delve into the analysis of charts in different periods of time, due to the lack of reliance on the signals provided by the indicators.
Thanks again for your effort, and we look forward to reading your next work.
Sincerely,@kouba01
Downvoting a post can decrease pending rewards and make it less visible. Common reasons:
Submit
hello sir, why have I been muted in the model agency community, even though I just joined @bountyking5
Downvoting a post can decrease pending rewards and make it less visible. Common reasons:
Submit
I see that there are still many accounts that have joined the model agency community that have not verified their accounts, why aren't they muted? for example, like the @vanessachristine account even though he hasn't verified the account
Downvoting a post can decrease pending rewards and make it less visible. Common reasons:
Submit
This is an account that has not been verified, why don't you turn it off?
or do you have this account the admin
Downvoting a post can decrease pending rewards and make it less visible. Common reasons:
Submit