Hi Friends
How are you, I hope all will be happy and well, I am also well.
This is my homework post for my Prof. @cryptokraze. In this post, I will present my homework and gave answers to all questions.

What do you understand about Market Structure?
First of all, I will explain what is market then I will move on to the market structure. basically market is the place where buyers and sellers interact with each other to buying and selling their goods. So in the cryptocurrency market structure is the graphical representation of markets flow and its behaviour. The word flow and behaviour mean to check that where the market is going to uptrend way or downtrend way And graphical interface mean charts where different lines and candlestick show the market behaviour so the combination of all these things create a market structure.
Market structure helps the trader to take entry at the best suitable and also tell what is the exact time to exit step from the market. It provides the different options to identify the market behaviour that it is in uptrend or downtrend and it also helps to identify that Market is moving in consolidation trends or not.
The market structure just shows the market flow and behaviour but it will not provide us entry and exit points for trading. we need to do our own technical analysis for finding the best trading points by looking at the market structure.
Now I will explain the three different market structures.
Uptrend Market Structure.
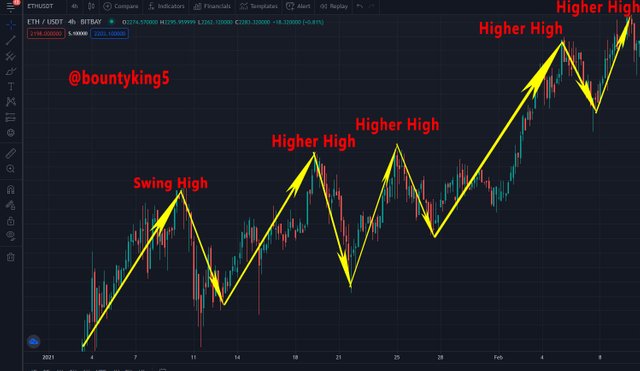
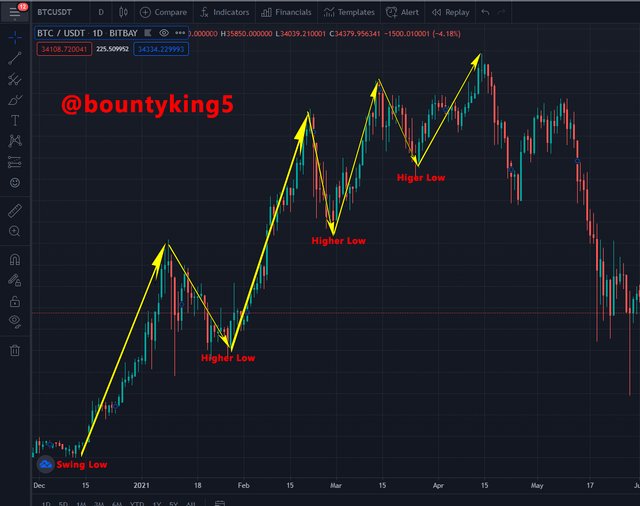
When the market is going to upward with make a higher high and higher low candlestick then we said that the market is in an upward trend. This is the time when traders trade their goods and make high profits. Now I will share a screenshot with help to understand the upward trend. In this trend, candles made with a sequence of high and low but the current higher candle make higher as compare to the previous higher point.
Downtrend Market Structure.
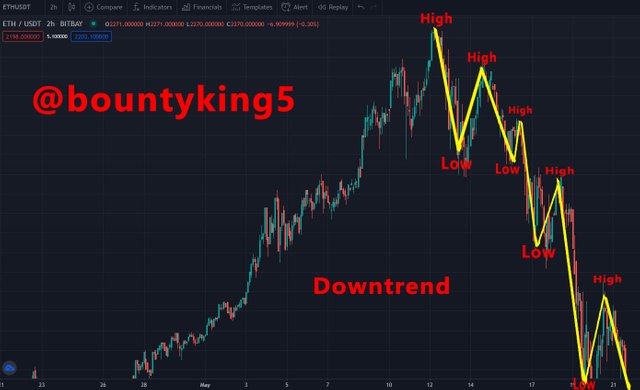
When the market is going downward we can see that the upcoming high level will be lower as compared to the previous high point. Downtrend market structure representation the bearish market. In this trend Price impact will be on every Token and coin.
Sideways Market Structure
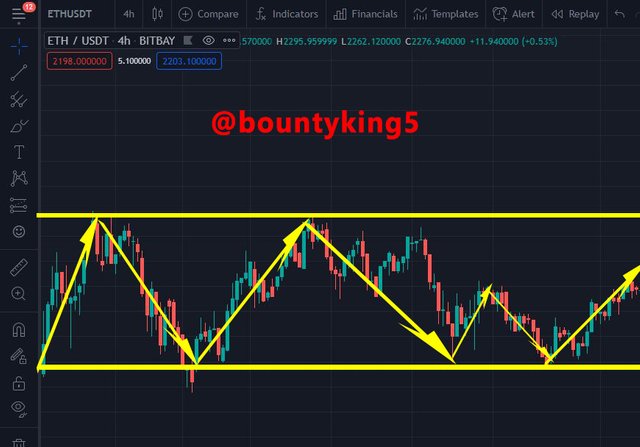
Sideways Market Structure represent the correction mode. it means that the market price will move in a specific area. Sometimes it will at peak of this area and sometimes it will at a minimum level of this specific area. This market structure is called consolidation.
What do you understand about Lower High and Higher Low? Give Chart Examples from Crypto Assets.
To understand the lower and higher point, first of all, we need to understand the resistance and support level. Support is the level from where the market will defiantly bounce back. It means that the price will more likely bounce back to this level rather than break through it. Resistance is the opposite level of support. it the level where the price hit this upward point again and again but when it will break then this resistance point will make the support point and the market will find the new level to make resistance point. hope everyone understands it well.
Higher highs:
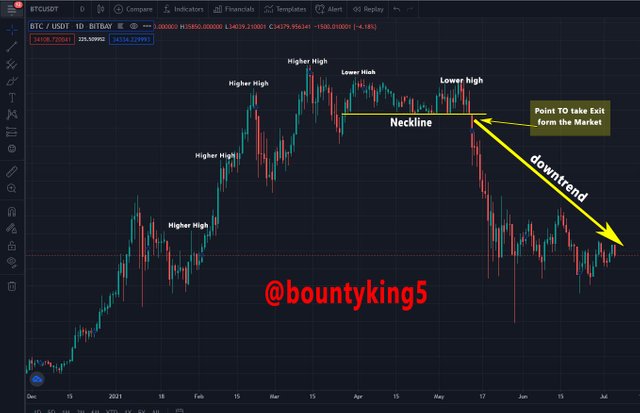
It is the type of upward trend market structure where the price makes swing movement candles. it creates a high candle as compared to the previous higher candlestick point. the new high will be higher than the previous high. we can understand it with a screenshot in which you can easily understand what I want to say.
Lower high:
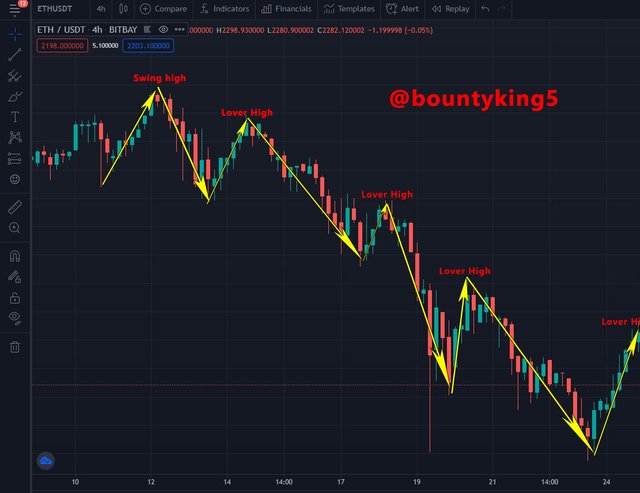
Lower high is a downward trend of market structure where the price will down and it will come toward the support level. In this market structure, the swing movement of price creates a high point that will be lower as compared to the previous high created. This Structure shows that the market is moving to downward trends.
Higher Low
Higher Low represent that no more downtrend will continue and it indicates the upward trend market structure. basically, It creates a swing low point that will be formed at bottom of a downward trend. In this market structure, the current higher low point will higher as compared to the previous low point. This market structure shows that the market is again going to upward trends.
How will you identify Trend Reversal early using Market Structure Break? (Screenshots Needed)
First of all, I will explain what is trend reversal then we can easily identify that trend reversal is the change in the price movement from upward to downward or vice versa. It means when the Trader change their mind to buying good to selling goods so then the market will be in downward to upward trends or vice versa, so this strategy is known as Trend Reversal.
If we have the basic knowledge about higher low and lower high market structure techniques then we will easily find the trend reversal using market breakdown structure. There are two market trends reversal that I will explain in detail.
- Uptrend reversal Early
- Downtrend reversal Early
Identify uptrend Reversal Early:
In this situation, the market goes to an upward trend but suddenly makes a reversal trend, and then and the market starts to move in a downward trend. To identify Uptrend Reversal we need to find the support or neckline and also we need to see the formation of a lower high and a lower low at the top of an upward trend. When the neckline break then it will go in the upward reversal trend. So to identify this trend we need to spot the breakage of the neckline.
Downtrend reversal Early
In this situation, the market is in a downward trend but suddenly makes a reversal trend, and then the market starts to move in an upward trend. To identify Uptrend Reversal we need to find the neckline and also we need to see the formation of a higher low and higher at the bottom of a downward trend. When the neckline break then it will go in a downward reversal trend. So to identify this trend we need to spot the breakage of the neckline.
Explain Trade Entry and Exit Criteria on any Crypto Asset using any time frame of your choice (Screenshots Needed).
There are many ways to choose the best entry and exit point for crypto trading. But at this time we will talk about just market structure break strategy for indicating the best entry and exit point.
Buy entry criteria:
Every trader wants to enter the market when the price of the coin is low and then they can sell it at the exact time when the price will pump. But for taking the exact enter points, we need to remember some rules for crypto trading.
First thing that we need to check that the markets should in downtrends. Then we need to choose a time frame, if you are an intraday trader then you will choose 1 mint, 3 mint, 5 mint or one-hour timeframe, but if you want to invest as a long term and earn more profit then you need to choose the 1 hour, 2 hours 4-hour timeframe for trading.
The market creates lower Highs and lower lows chart but when we take an entry it is very important to check that market are making Higher Low patterns after Lower Lows patterns or not.
Find the best suitable level for drawing a neckline.
Wait for breakage of the neckline when the candlestick breaks it and it is the best time to take an entry. Check the screenshot below, you can easily understand what I am trying to say.
Sell entry criteria:
The first thing that we need to check that the market should in Uptrends.
For taking an Exit from the trade it is very important to check that markets are Forming Lower high patterns.
Place the exit point when the bearish candlestick breaks the neckline.
there are two situations in which we exit from the market one is hit the stop loss and the second one is Hit the book profit.
Exit from the market from the closure of the first bearish candlestick. You can check the below screenshot where is clearly seen that after the first bearish candle. the market starts downward.
Place 2 demo trades on crypto assets using Market Structure Break Strategy. You can use a lower timeframe for these demo trades (Screenshots Needed)
Buying trade for ETH/USDT at $2190.
Selling trade for ETH/USDT at $2328.
In the above two screens shorts, I share my demo buying and selling point. First I find the neckline then take an entry at $2190 because it is the best place to take an entry. At this point, the price is bouncing back to making the bullish trend. we can see that at $2190 the price is going up and I take the sell entry at $2328. I also share the two screenshots above to indicate the selling and buying point.
🅡🅔🅢🅟🅔🅒🅣🅔🅓 🅟🅡🅞🅕🅔🅢🅢🅞🅡`
@cryptokraze
B̳̿͟͞e̳̿͟͞s̳̿͟͞t̳̿͟͞ ̳̿͟͞R̳̿͟͞e̳̿͟͞g̳̿͟͞a̳̿͟͞r̳̿͟͞d̳̿͟͞s̳̿͟͞





Dear @bountyking5
Thank you for participating in Steemit Crypto Academy Season 03 and making efforts to complete the homework task. You got 6/10 Grade Points according to the following Scale;
Key Notes:
We appreciate your efforts in Crypto academy and look forward for your next homework tasks.
Regards
@cryptokraze
Downvoting a post can decrease pending rewards and make it less visible. Common reasons:
Submit
Ok Sir, i will try to best in the next homework @cryptokraze
Downvoting a post can decrease pending rewards and make it less visible. Common reasons:
Submit
Have a nice day
Downvoting a post can decrease pending rewards and make it less visible. Common reasons:
Submit
Downvoting a post can decrease pending rewards and make it less visible. Common reasons:
Submit