Hello professor @lenonmc21, I hereby present to you my homework post for the lecture about Trade with "Simple and Exponential Moving Averages" + application of "Fibonacci Retracements" on the chart that you laid out to steemians.
Introduction
Moving average is a technical indicator that refers to an average price for a particular trading instrument over a specified period. Moving averages are utilized by traders to spot and trace trends by leveling normal day-to-day price movements. There are various moving average lengths, that is, a 20-day moving average, for example, calculates the average price of a specific instrument over the past 20 days. A 20-day moving average can be represented in a blue line which is used by investors as a support or resistance level indicator and base trades around it. Moving averages are calculated by adding up the previous x number of periods and dividing that sum by the total number of periods, for instance, a 5-day moving average is calculated by totaling the previous 5 days price data and dividing it by 5 that means each time a new period occurs, the moving average moves forward dropping the first data point and adding the newest one. A moving average emerges as a curving line that gives a visual presentation of a stock’s longer-term trend.

Define in your own words what are simple moving averages and exponential moving averages.
Simple Moving averages:
Simple moving average (SMA) is perhaps the oldest and the most widely used technical indicator. What makes it a favorite of investors is the “simple” signals it gives. SMAs are calculated by summing up the different prices and dividing the sum by the number of duration, for instance, a 15-day SMA would total up the closing prices for the previous 15 days, then divide the total sum by 15.
SMAs are reactionary indicators meaning that they don’t predict future price movements, that is, they react to current markets. The shorter the SMA the more sensitive the signal because you would be calculating the most recent data. Normally, short-term moving average scopes from 5 to 25 days, an intermediate-term from 25 to 100, and long-term 100 to 250 days.
Exponential moving averages:
Exponential Moving Averages (EMA) is the second most widely used technical analysis indicator when it comes to moving averages and stock charts. EMAs accord extra weight to current prices and these are calculated by pertaining a percentage of today’s closing price to yesterday's moving average. It is more reactionary moving a little bit quicker with the market thus it will factor recent market moves higher in weight.
The advantage of using EMAs is that they are able to pick up short-term volatility moves quicker. The simple moving average doesn’t show much movement in the indicator because there is still lag in the market but with exponential moving average, it is going to factor in today’s move at a much higher rate or percentage of the overall average. A typical short-term moving average ranges from 5 to 25 days, an intermediate-term 25 to 100, and long-term 100 to 250 days.
Explain how simple and exponential moving averages are calculated.
Simple moving averages:
The indicator formula is just taking the previous closes of a given period and then dividing with what the number of the period is, for example, we have a 4 day moving average with the closing price of $24, $26, $28, and $25 which we will add giving the sum of $103 divided by 4 which is the number of days giving an average of $25.75.
$24+$26+$28+$25=$103/4=$25.75
Let us say, the next day comes and the closing price is $27. So what we do is take those next 4, we drop out the previous day which was $24, and divide the sum by 4 giving a rise to the average number because in this case, the closing price is $27 which is $2 higher than the previous which was $25.
$26+$28+$25+$27=$106/4=$26.50
So if we add another closing price, we drop the last two and keep moving using the most recent data which will continuously keep increasing the number of the moving average. These numbers will then be plotted on the chart of the stock.
Exponential moving averages:
The exponential percentage is going to be 2 divided by the time period plus 1 which will give the percentage that we are going to factor in. so on a 50-day moving average, 3.9% exponential period or percentage would be 2 divided by the time period which is 50 plus 1 giving us .039. This means that the most recent day will be weighted 3.9% of the value of the EMA.
Exponential percentage = 2/Time Period + 1
50-day EMA = 3.9% exponential average (.039 = 2/50 + 1)
Briefly describe at least 2 ways to use them in our trading operations.
There are 2 major ways to use moving averages in trading which include;
What is the difference between simple moving averages and exponential moving averages (Explain in detail)?
On the trading charts, the simple moving averages look back at the closing price of each candle creating a line to represent the average price, for example, if we create a 50-period moving average on our value trades MT4 chart on a daily chart, the moving average is calculated by looking back at the closing price if the last 50 days of price action. If we change the time frame to the 1-hour charts for example then the simple moving average is calculated in the same way but looks back at the last 50 hours of the price action.
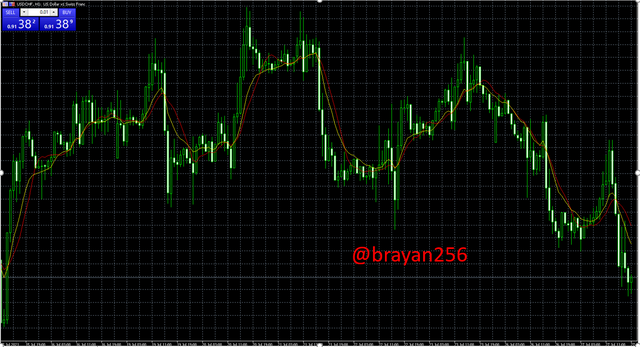
A 200-day moving average is also used to determine bear versus the bull market in equities, commodities, and indices which also be used with a 50-day moving average to create what is called the death cross to indicate a severe change from a bullish to a bearish market. Like many indicators, the moving average is a lagging indicator, so to give more importance to the most recent data, we use the exponential moving average which calculates and puts more emphasis on newer data points which can be illustrated by plotting a simple moving average on any chart and then plotting an exponential moving average in a different color. Here, we can see that the EMA follows the price action more closely as more emphasis is placed on the closing price of the current candles.
Define and explain in your own words what “Fibonacci Retracements” are and what their gold ratios are.
Fibonacci Retracements are parallel lines that lay down where resistance and support will occur based on Fibonacci numbers and coupling with a percentage. Fibonacci retracements are preconceived using special ratios that take place clearly in nature to forecast some points of resistance. This is done through adding the earlier two numbers and then going sequentially in line, for example, when you add 1+1=2, 2+3=5, 3+5=8, 5+8=13, 8+13=21, 13+21=34, 21+34=55, and so on, the main ratio that is applied is 0.618 gotten by dividing one Fibonacci number into the following in the sequence.
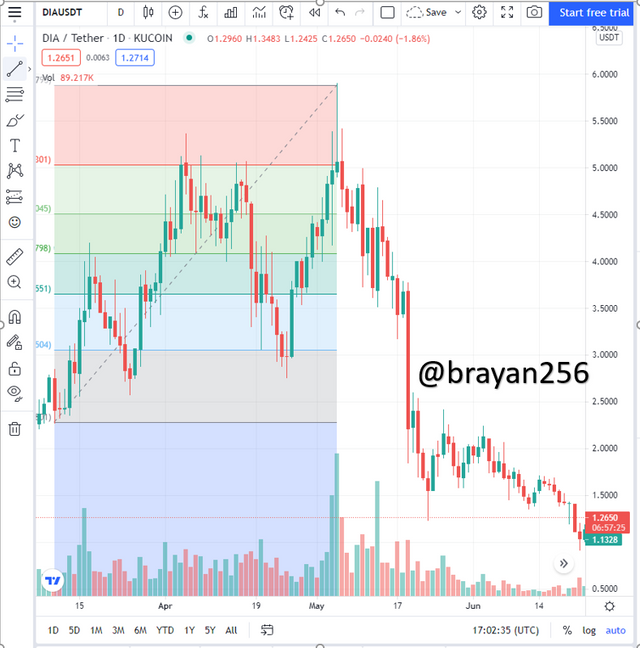
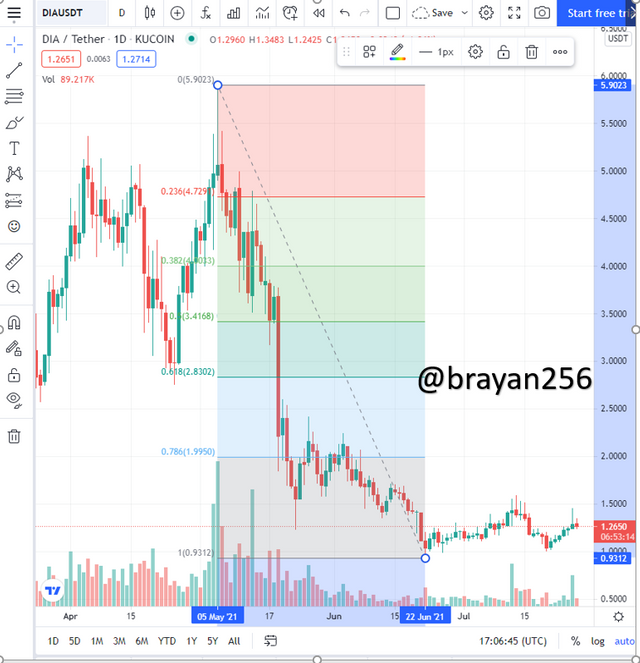
Fibonacci Retracements are the mainly used Fibonacci tool. Its theory states that prices should retrace the preliminary variance, that is, low to high or high to low by a correlation of the Fibonacci sequence. The major sequence levels are generally 23.6%, 38.2%, 50%, 61.8% and the 76.4% retracement.
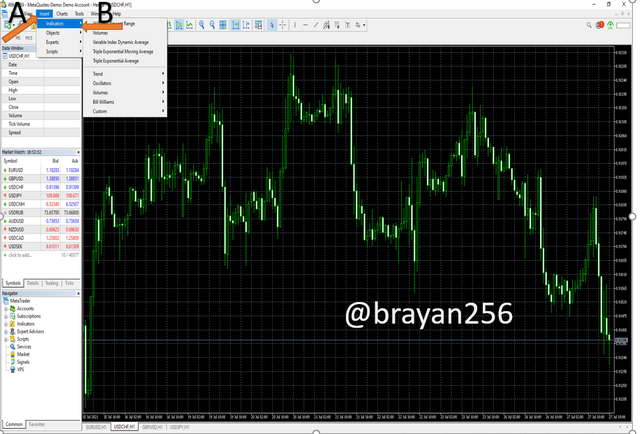
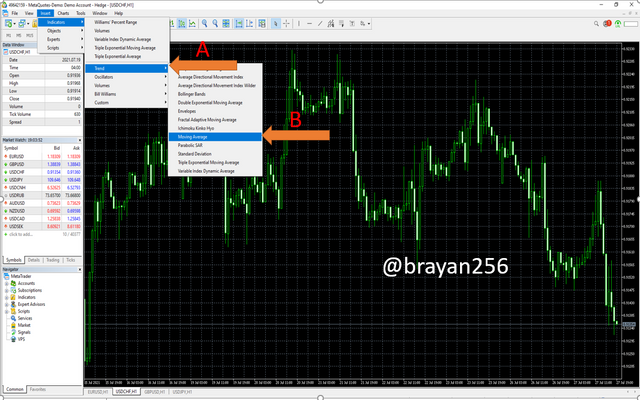
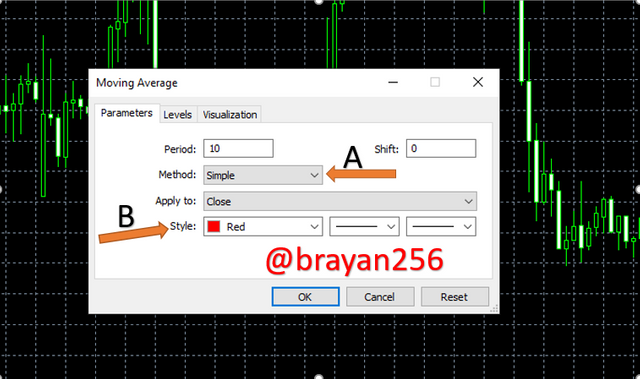
Show step by step how to add a “Simple and Exponential Moving Average” to the graph (Only your own screenshots- Nothing taken from the Web).
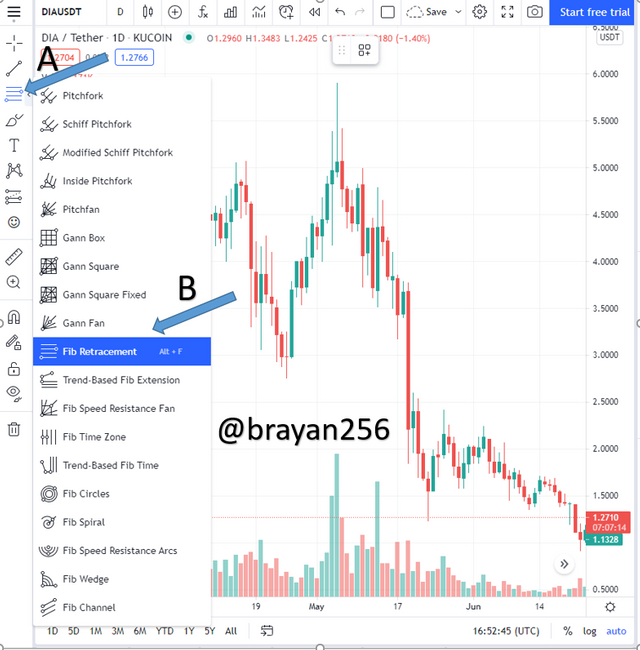
Use “Fibonacci Retracements” to chart a bullish and bearish move (Own screenshots only - Nothing taken from the web).
In conclusion
Moving averages and Fibonacci retracement tools play a great role in the financial markets giving a clear view to the traders about the current trends of the markets. Therefore I would like to thank professor @lenonmc21 for such an interesting lecture which has broadened my view about moving averages and Fibonacci retracements.
You have been curated by @yohan2on, a country representative (Uganda). We are curating using the steemcurator04 curator account to support steemians in Africa.
Keep creating good content on Steemit.
Always follow @ steemitblog for updates on steemit
Downvoting a post can decrease pending rewards and make it less visible. Common reasons:
Submit