Hello professor @reddileep, I am humbled to be part of your class about the Heikin-Ashi trading strategy and I present to you my assignment task that you provided to the steemians after the lecture.

Define the Heikin-Ashi Technique in your own words.
The Heiken-Ashi methodology adjusts the open-high-low-close sequences that the majority of candlestick charts utilize thus making trends vivid and easier to spot. While it is constructed like a regular candlestick, the technique’s formulae are close-open-high-low that is to say, the user defines the time series depending on the type of chart desired. Down days are filled bars while up days are normally hollow.
Heiken-Ashi charts provide five high primary signals that identify trends and buying opportunities; hollow candles with no lower shadows indicate a strong uptrend and a time to let profits ride. Hollow candles signify an uptrend which is a good time to add to long positions and exit shorts. When upper and lower shadows surround one small candle, it indicates a trend change, and risk lovers may place a trend on buy or sell while others may wait for a confirmation. Filled candles with higher shadows indicate a downtrend which means it’s time to add to short positions and exit longs while filled candles with no higher shadows indicate a strong downtrend.
Make your own research and differentiate between the traditional candlestick chart and the Heikin-Ashi chart. (screenshots required from both chart patterns)
The difference between the Heikin-Ashi Chart and the Traditional Candlestick charts.
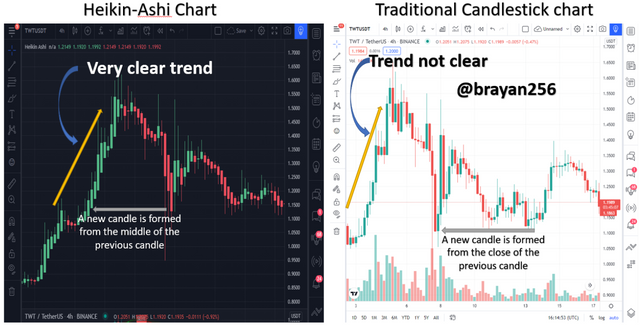
| Heikin-Ashi Chart | Traditional Candlestick chart |
|---|---|
| 1. The candles clearly show the trend on all timeframes. | The candles clearly show the trend on large timeframes. |
| 2. These charts hardly show a clear market trend. | These charts show a clear picture of the trend. |
| 3. The candles start from the closure of the previous candle. | The candles start from the middle of the previous candle. |
| 4. Gaps are formed when an asset’s price opens lower or higher than the previous close. | There are no gaps formed. |
| 5. Trends are determined based on the candlestick pattern. | Trends are determined based on a particular group of candles. |
| 6. Candlesticks open where the proceeding candlesticks close. | Candlesticks are produced by computing the proceeding candlestick data. |
Explain the Heikin-Ashi Formula. (In addition to simply stating the formula, you should provide a clear explanation about the calculation)
The formula for the Heikin-Ashi technique:
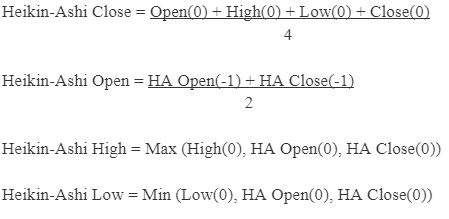
Where:
Open(0) etc. = Values from the current period
Open(-1) etc. = Values from the prior period
HA = Heikin-Ashi
Graphically explain trends and buying opportunities through the Heikin-Ashi Candle. (Screenshots required)
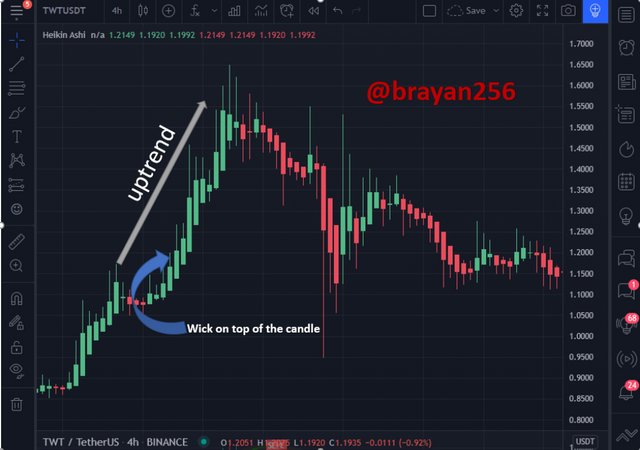
UPTREND.
When we are in a strong uptrend, there are two major things that we look out for on the Heikin-Ashi candles; that is to say, a large green body which is the thicker part of the candle, and the wicks which are the very thinner part on the top and bottom of the body. So when we spot an enormous green body on the Heikin-Ashi candle it shows that we are in a vigorous uptrend. The second thing that we will look out for is there should be no lower wicks on these green candles hence both of these criteria occurring together indicate a strong uptrend.
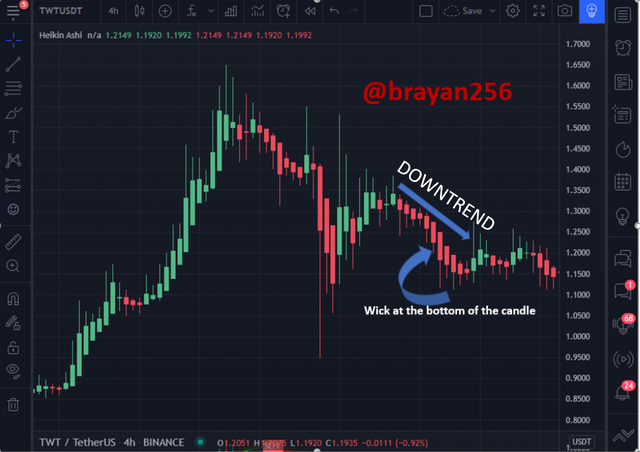
DOWNTREND
Similarly, when looking for a downtrend on a Heikin-Ashi chart we shall look out for large red candle bodies and no upper wicks on these candles. Both of these criteria occurring together indicate a strong downtrend.
Buying opportunities.
When entering a trade using the Heikin-Ashi chart we need to see a candle with a large green body and no lower wick. On the chart below, we see our first larger-bodied green candle formed with no lower wick which is the first signal of bullish pressure entering the market. Depending on the level of risk tolerance, a trader may wish to enter on the close of this candle because the body of this candle is larger than the majority of the candles that are formed since touching support. However, it is not overly large so you may wish to wait for a stronger bullish candle before entering the trade. Price begins moving further up and we see two more large-bodied green candles form with no lower wicks and finally, we see a massive green candle form that breaks above the short-term level of resistance we see on the left which is a very bullish signal.
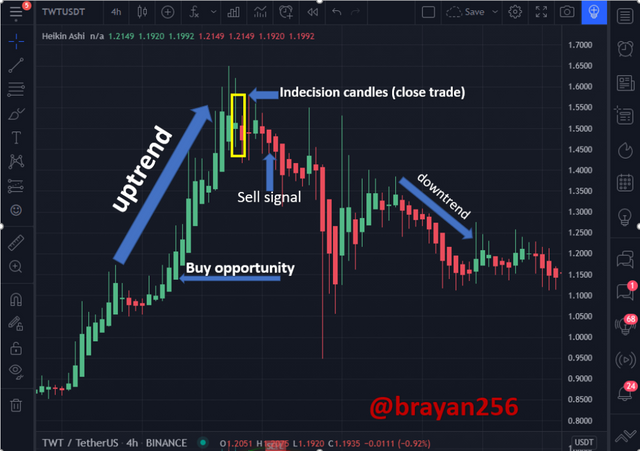
We have broken above resistance, and we have a large-bodied green candle with no lower wick which is an excellent place to enter a buy trade. We then see strong upwards momentum come into the market as price surges up and eventually it hits a level of resistance and the size of the candles once again gets smaller. When we see the first red candle form, this would be our signal to close the trade position. At this point in time, there is a possibility that the price will pull back and continue even higher but it is recommended that a trader should close at least some positions of the trade on the first pointer of bearish constraint coming into the market.
Is it possible to transact only with signals received using the Heikin-Ashi Technique? Explain the reasons for your answer.
Cryptocurrencies have a very volatile market, that is to say, there is no single strategy or indicator that can give a trader a 100% accurate signal to get into a trade. With this said, the signal given by the Heikin-Ashi candle are good but are still not 100% accurate so it is advisable to always use other strategies and indicators to give you a coherent view of the market trend, for instance, a trader could make use of the relative strength index, moving averages, bears power, bulls power, force index, among other indicators.
By using a Demo account, perform both buy and sell orders using Heikin-Ashi +55 EMA +21 EMA.
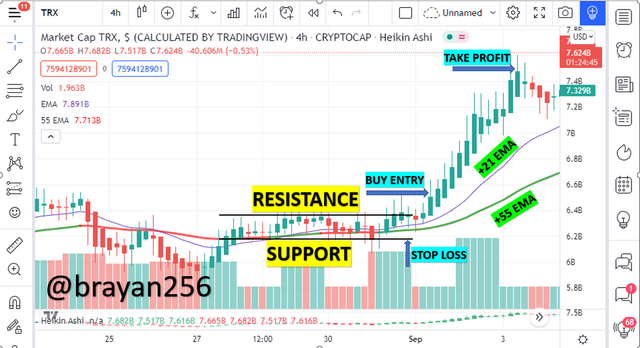
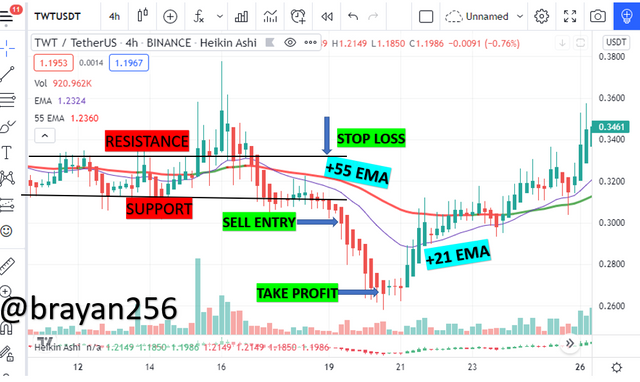
Moving averages help to pinpoint locations of a market trend and traders can use simple price action patterns to decide on a trading opportunity. With this said, I have the 21 EMA and the 55 EMA on the Heikin-Achi chart that I used to execute trades on Trust wallet token and Trox.
BUY
Considering the direction of the 21 EMA crossing over on the 55 EMA after support and resistance level, I spotted my buy signal on the pair TRX/USDT and executed a trade at $0.10462 then later set my take profit at $0.1230 after I had put my stop loss at $0.0987.
SELL
Considering the direction of the 55 EMA crossing over the 21 EMA showing a downtrend moving coming up in the market after the support and resistance level, I spotted a sell signal on the pair TWT/USDT where I executed a trade at $1.449 then later set my take profit at $0.95 after I had put my stop loss at $1.51.
Conclusion.
The Heikin-Ashi candles are typically used to smooth out price action, eliminate noise and make it much easier to identify trends in the market but a trader should also use other indicators to view the market as the signal given is not 100% accurate but just makes it easier to understand the market. Therefore I would like to appreciate professor @reddileep for such an awesome lecture about the Heikin-Ashi trading strategy which has introduced me to a new trading skill.
You have been curated by @yohan2on, a country representative (Uganda). We are curating using the steemcurator04 curator account to support steemians in Africa.
Keep creating good content on Steemit.
Always follow @ steemitblog for updates on steemit
Downvoting a post can decrease pending rewards and make it less visible. Common reasons:
Submit