
Hello to everyone. I am happy to be in Season 4 of Crypto Academy. Let's continue to work together to improve this community.
In this assignment, I will talk about the Exponential Moving Average and how this indicator can work when combined with a trend breakout. I wish you pleasant reading.

¿Defina y Explique en detalle con sus propias palabras, que es la Estrategia de la EMA + Ruptura de la línea de Tendencia?
¿Explique en detalle la función de la EMA de 100 periodos en la Estrategia de EMA + Ruptura de línea de tendencia?
¿Explique en detalle la función de la "Línea de Tendencia" en la Estrategia de EMA + Ruptura Ruptura de línea de tendencia?
¿Explique el paso a paso de lo que se debe tener en cuenta para ejecutar la estrategia de EMA + Ruptura con línea de tendencia correctamente?
¿Cuáles son los criterios de entrada y salida comerciales de la estrategia de la EMA + Ruptura de Línea de Tendencia?
Practica (Solo Uso de imágenes propias)
- Realice 2 entradas (Una Alcista y otra Bajista) en cualquier par de "Criptomonedas" utilizando la "Estrategia EMA + Ruptura de Línea de Tendencia "(Utilice una cuenta Demo, para poder realizar su entrada en tiempo real en cualquier temporalidad de su elección, preferiblemente temporalidades bajas)

Moving averages, called lagging indicators, show the average value of prices over a given period. In this way, the trader analyzes past price averages and uses these indicators as a helpful tool to enter the trade.
There are different types of moving averages, they are moving average, weighted moving average and exponential moving average. The trader can enrich his analysis by finding the most suitable moving average variant to use with his own analysis.
First I'll show you an example of the simple moving average, and then I'll start talking about the exponential moving average.

In the example above, price action above the 50-day moving average creates an uptrend. Traders who open trades using this indicator wait for the price to retest the 50 or 200 day average. As we can see in the chart, the asset in the uptrend tests both the trend line and the moving average prices and continues on its way. When the price falls below the 50-day average, it makes a rapid rise after testing the 200-day average. This is an example of the use of the simple moving average.
Now let's move on to the exponential moving averages.
Exponential moving averages, like other moving averages, are a type of indicator created by calculating an average of past price movements. This indicator gives the trader some data about the general trend of price action and allows him to make predictions. It is especially popular with day traders. Because it reacts to prices faster than other moving averages.
There are some points to consider when using this indicator for help.
Example; The trader, who wants to open a buy trade, waits for the price to rise above the EMA indicator used or to receive a reaction from that strip.
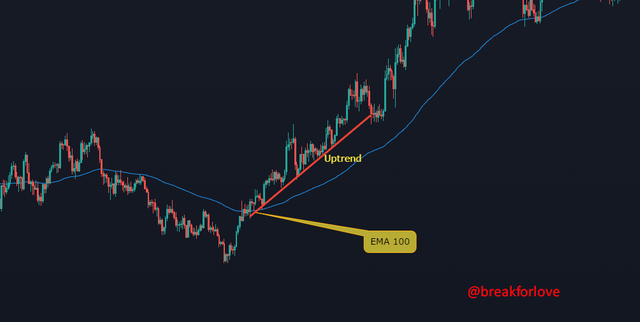
In the chart above, an asset in a downtrend is trading below the EMA 100 average. If the trader, who is waiting to open a buy trade, sees that the price has gone above the EMA and changing its direction, this indicator will be of great help to him.
Since we have briefly mentioned the EMA, let's talk about the EMA + Breakout of Trend Line strategy, which is one of the most useful methods of this indicator.
We learned what the exponential moving average is. However, it is possible to obtain more efficient results by blending this indicator with a different strategy. For this, I will talk about one of the most used, EMA + Breakout of the Trend Line.
Trend Breakouts are one of the most potential analysis methods for traders. When a trader sees a bullish or bearish trend, he starts chasing a position according to the current market. Although these breakouts are not always 100% succesful (fakeouts), they usually have a high success rate.
So how can we combine these two methods?
The working principle of exponential moving averages is simple. Past price movements are calculated with the calculation system of the exponential moving average and continue with the price on the chart as a strip. They are diversified as short, medium and long term exponential moving averages. Choosing these depends on the strategy of the trader. Let's combine the trend breakouts with this average.
The EMA period we use, for example the EMA 50, gives us a chance to predict the direction of the price, while at the same time we should watch the price movements on the chart. If the price is in a downtrend, the extreme points of the drawn trend line are the regions where the price will react. The key point here is to know if the price is above or below the EMA 50 average (if we are expecting an uptrend breakout).
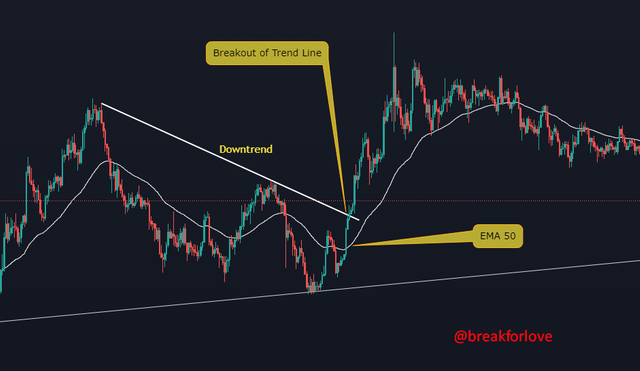
In the graphic above, I simply exemplified this strategy. A trader following the asset in a downtrend expects to take a position using the EMA 50 and Breakout of the Trend Line strategy. After seeing the price is above the EMA 50, it follows the trend breakout and enters the trade. Bingo! The price continued to rise and a successful trade took place.

Now I will talk about the role of the EMA 100-day period in the strategy of EMA + Breakout of the Trend Line. For this, I add the EMA 100 period to my chart.
EMA 100 is a data type created by calculating the exponential moving average over a 100-day period. It is an average of past price movements. The EMA is often preferred by traders as it reacts more quickly to price movements.
EMA 100, which we will use while applying the EMA + Breakout of the Trend line strategy mentioned in the above question, allows us to have an idea for the trade we will enter. If the price is below the EMA 100, this tells us to look for a bearish trade, and if it is above it, we should look for a bullish trade. We know that a price will not rise or fall forever. Therefore, it is extremely useful to use the EMA 100 indicator when chasing an opportunity to enter the trade.
So what is the correct use of EMA 100 EMA + Breakout of the Trend Line?
It is perfectly natural to expect an asset in a downtrend to breakout. But it would be more logical to wait for it at the right place at the right time with the help of some indicators. EMA 100 is one of these useful indicators.
Now I will talk about the use of the EMA 100 indicator in the buy direction on an asset pair.
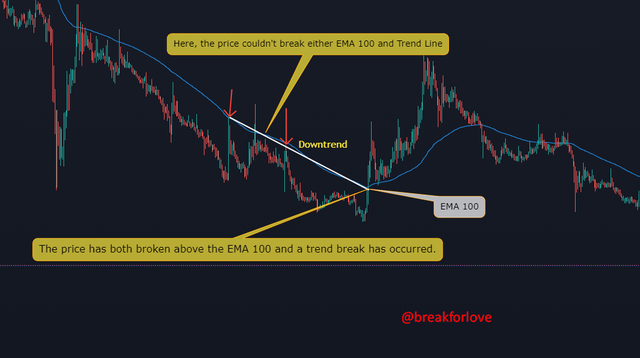
In the chart above, you see an example of the EMA 100 in this strategy. The region where the price failed to breakout above the EMA 100 before is also the regions where the downtrend has been confirmed. This means that the price has yet to breakout through. When we continue to monitor the price movements, we see that the price shows an upward sign. The most important point here is that both the place where the price breaks the trend and the place where it goes above the EMA 100 are the same place. The price may have gone above the EMA before, but I chose this because what I wanted to tell on this chart was happen. The rise in price makes the downtrend breakout. One of the important points here is the function of the EMA 100. We check if the EMA goes above 100 to see if the breakout is a fakeout. After the rise, an EMA 100 test occurs again and the price continues to rise.

The Trendline is as important as the EMA, as we feed this strategy both ways. The trendline tells us about the direction of the market. If an asset is in an uptrend, the price will test the uptrend and show an uptrend again. If it is in a downtrend, the price will make a downward move from the trendline. The important point for us is to both follow the trendline and enter the trade using the EMA period.
There are some tips for determining the trendline. For example, in order to determine the trend of an asset in a downtrend, the tops it creates must be lower than the previous one. Likewise, lows and highs formed by an asset in an uptrend should be higher than the previous one.
In the example I will now give, I will explain the importance of the trend line in this strategy.
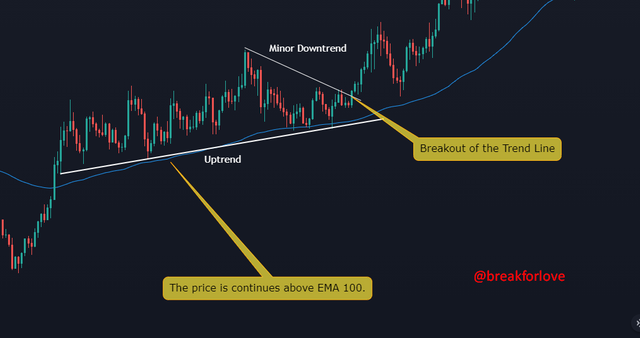
In the chart above, we see that the price is hovering above the EMA 100. This is positive for a buy-side position. Assuming our chart is a 4h period, we see that the main trend is an uptrend. The price tested the trend line 4 times and continued its rise. This major uptrend gives us information about the continuation of the price. So, first of all, we understand the importance of the trend line in this strategy.
Continuing, we see that the price is in a minor downtrend and is waiting for a breakout. While following the breakout of this minor downtrend, we also pay attention to the fact that the price is above the EMA 100. The breakout occurs and the price continues to rise.
To summarize briefly; We identify the main trend of the price, then we check if the price is above the EMA 100. If the price is both on the uptrend line and above the EMA 100, we take a buy position. On the contrary, if it is on the downtrend line and the EMA is below the 100 average, we are looking for a sell position.
Thus, we touched on the role of both the trend line and the EMA 100 in this strategy.

With all that we have learned, it is also important that we use this strategy correctly. The first thing we need to do is to determine the direction of the market. A good technical analysis brings good results.
- First, we add the EMA to our chart and set it to 100-days. Since we covered adding indicators in previous lessons, I do not show them again.
- Next, we look at the price movements that our chart has created to determine its trend. For example, if the price is in an uptrend, it should make higher lows and highs.
- If we have determined the direction of the trend, the next thing we need to do is see if the price is above or below the EMA.
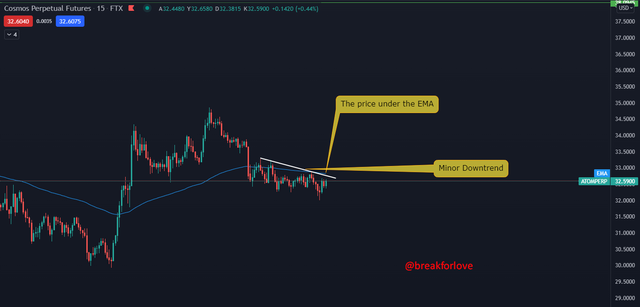
- For example, in the above Atom/USDT pair, the price is both in a downtrend and below the EMA average. What needs to be done here is to wait for the price to both break the trend line and rise above the EMA 100 to apply what we have learned.
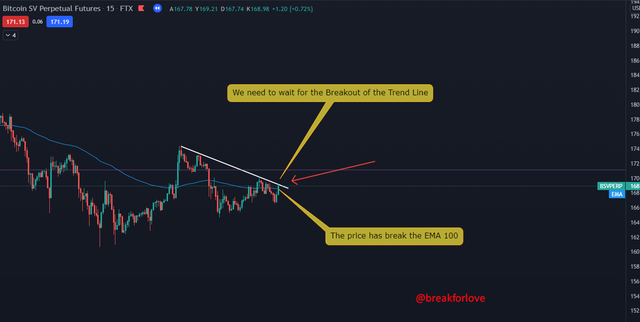
- In another example, the scenario we want is about to happen. The price has both risen above the EMA 100 and the downtrend is breaking.
I would like to summarize what I said in the graphics. The data we have in order to use this strategy with the most accurate method;
- To determine the direction of the market. Looking for a position in the direction of buying if it is up and selling if it is down.
- Determining the direction of the trend and creating the trend line according to its rules. We cannot apply this strategy if we do not know the trend direction.
- Place the EMA 100 indicator on the chart and find out if the price is above or below the EMA 100 indicator
- After understanding the trend direction and the course of the EMA 100, trade according to the direction of the asset.

I mentioned that there are some criteria for opening a trade using this strategy. I will try to be more descriptive in this question. First of all, the first thing we will do is determine the direction of the price movement and find out whether the price is above or below the EMA. After determining the direction of the price, we will observe the price movement that it creates.
Example; If the price is in an uptrend, it will make higher highs and lows. In a downtrend, on the contrary, lower highs and lows are expected.
The first thing we will create in this case is to draw the trend line. If the price is in an uptrend, it will continue to rise by testing the uptrend, and if it is in a downtrend, it will react from the trendline and continue its downward movement. One of the key points here is to use the EMA indicator with the trendline. If we expect an asset in a downtrend to breakout the trend, the price should either be above the EMA or start to breakout above it. If we are waiting for an uptrend asset to breakout through the trendline, the price should either be below the EMA indicator or start to drop below it.
Now, let's determine our entry-exit places using this strategy on a chart.
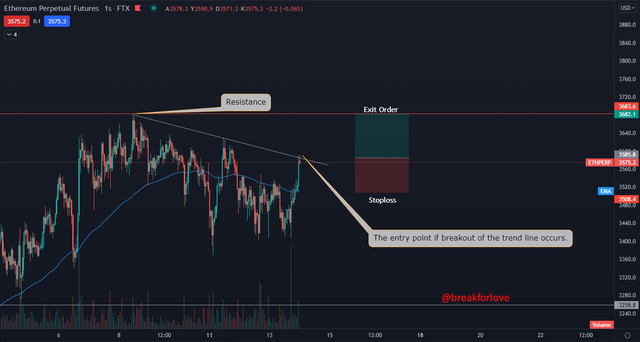
As you can see in the chart, the ETH/USDT pair, which is in a downtrend, is trying to break this trend. When we look at the price, it continues above EMA 100. If a breakout occurs, it would be logical to enter a buy trade. What we need to do here is to watch the price action. Our trading entry point is the breakout zone at $3585. Before opening a trade, I also determine my exit zone and stop loss zone. The region I will exit is the 3682 region, which can work as a resistance. My stop loss zone is where the EMA 100 is. I chose this zone because the price could receive an upside reaction from here. If my trade results in profit, my profit will be 2.68%, if it results in loss, my loss will be 2.15%.

Now, with the information we have learned, I will enter both buy and sell orders and talk about my entry and exit criteria.
I will make my transactions through Tradingview. After looking for a while, I saw that the KAVA/USDT pair is suitable for this entry. I noticed that the price is above the EMA 100. I also identified a minor downtrend line and started waiting. All I had to do was watch the price action, as I had pre-determined my entry and exit places. After first making a fakeout, the trend line was broken in the second attempt and I entered the trade. As you can see in the chart below, my trade was successful.
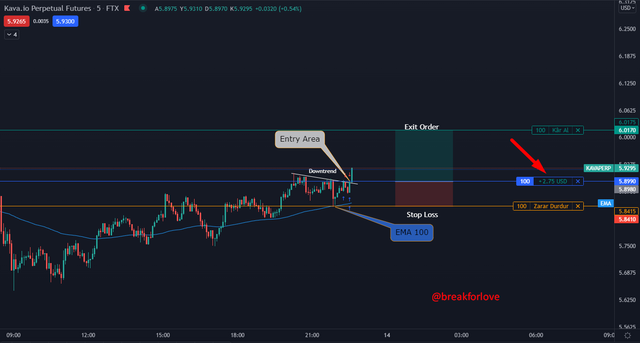
In this transaction, I looked for a sell-side breakout and saw the AVAX/USDT pair and started to examine the price. The first thing I saw was that the price was below the EMA 100. The price seemed to continue to fall by making a harmonic formation. After determining my trend line, I started to wait for the breakout. Of course, I also determined my stop loss and take profit zones from the region where I will enter the priority trade. I entered the trade in the direction of selling with the breakout. As you can see on the right side of the chart below, this transaction continues profitably.
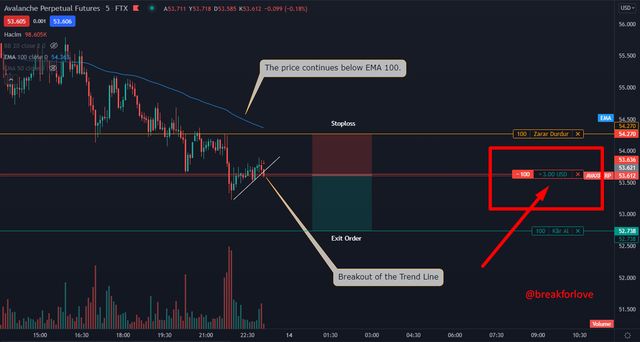

In this assignment, I talked about the exponential moving average that day traders often use. Using this average as an auxiliary indicator, I explained what we should do to enter the trade. In the rest of the assignment, I talked about how to support this indicator with a trend breakout strategy, explained and illustrated its use as a technical analysis tool. I can safely say that I will try to execute my own trades using this indicator and this strategy. Both of my transactions, which I have shown as an example, resulted in profit. So I believe I will make successful trades using this method. I hope it was a useful writing.
Thank you for reading.
CC: @lenonmc21