Image designed in PixelLab

Introduction
Steemit greetings to all professors and students of the steemitCryptoAcademy. It is a privilege to be part of this awesome lesson and to take part in this task. I am indeed excited because the tasks deals with indicators which is one of the tools i have been longing to have an in dept knowledge on . This is because i intend to be a real crypto trader and a successful one for that matter.
Indicators are signs or symbols that are configured on a trading platform which gives a trader glimpse about market trends and how he can perfectly execute
trades. Thus most indicators try to relate most prices and volumes within particular time frames. There are numerous indicators out there which a trader is free to use . Some good examples of symbols include the relative strength index(RSI),Moving average ,volume indicator etc.

1
What is your understanding of the TRIMA indicator?
TRIMA stands for triangular moving average .TRIMA is one of the technical indicators which is the same like other moving averages which shows the mean price of a particular market asset plotted on specified positions . It is established that TRIMA is considered to be the smoothed version of simple moving average .TRIMA is set in such a way a way that it simplifies the trends in market situation. Thus it could be the average of an average ,reason why it is said to be the smoothed version of the simple moving averages .
TRIMA however does not react quickly especially for very volatile markets .This explains why we may combine with others indicators to be able to to carry out executions in the market.

2
Setup a crypto chart with TRIMA. How is the calculation of TRIMA done? Give an illustration. (Screenshots required)
To set up TRIMA on my crypto chart i head straight to my analysis app known as trading view. You can know more about Trading view Here.
Once i open my app i head straight to the top bar where i will see indicators. I will see a aeries if indicators and i will search for triangular
Moving average then enable it.
Then i will actually change the the indicator length to 20 periods and i choose a suitable colour which is quite visible .
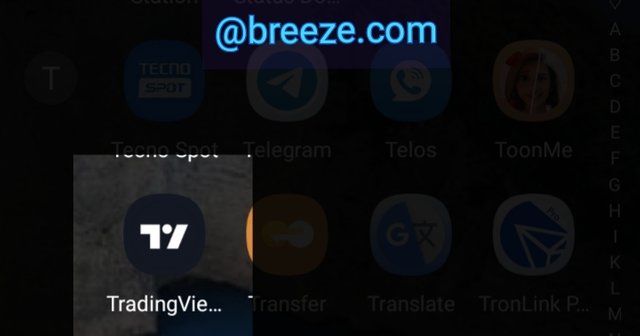
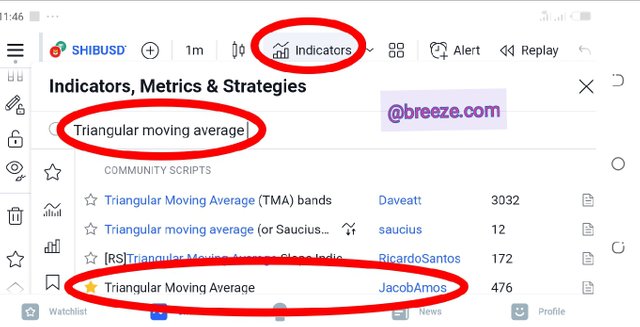
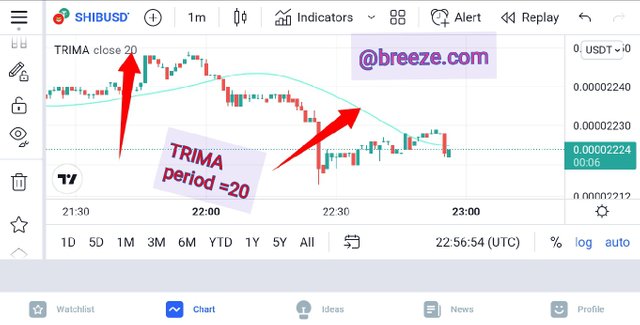
Screenshot from Trading view

3
Identify uptrend and downtrend market conditions using TRIMA on separate charts
There are 3 market situation where a trader will always encounter in the market,it is either the market is in an up trend ,downtrend or in a consolidation phase. TRIMA can always give us a glue to be able to identify trends in the market . However the visibility of such trends using TRIMA varies from individual settings on the TRIMA indicator .
For an uptrend we will notice that the price if the asset will be clearly seen above TRIMA without mixing with each other. You can see more from the Screenshot below.
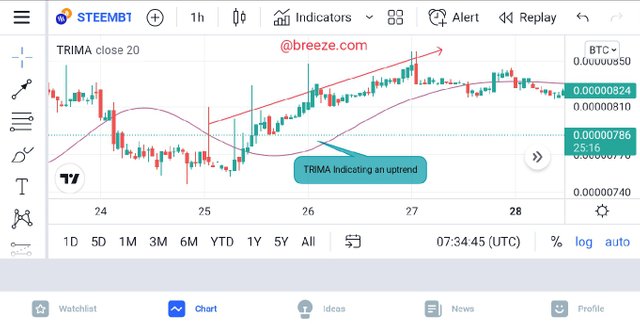
Screenshot from Trading view
Conversely for a downtrend,we clearly see The price of the asset placed running below the TRIMA indicator and the TRIMA indcator is clearly seen above the price of the asset as seen below .
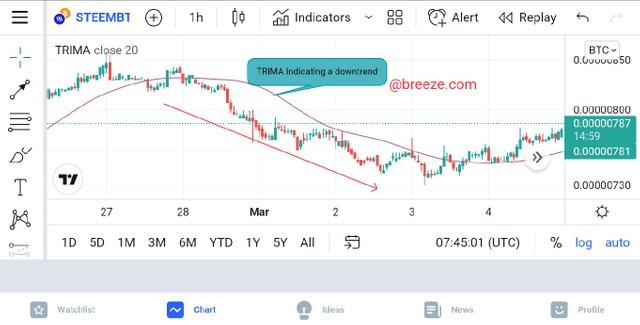
Screenshot from Trading view

4
With your knowledge of dynamic support and resistance, show TRIMA acting like one. And show TRIMA movement in a consolidating market. (Screenshots required).
When we talk of support in a crypto market we mean a situation where any event is preventing the price of commodity to fall further .We see the price bouncing on an off at the level.
While a resistance level is a point where something prevents the price of any crypto asset to rise further .In a support and resistance scenario we tend to say the market is consolidating.
TRIMA can also clearly show a support level when the Price of an asset rise to a maximum at that particular time we therefore see TRIMA going above the price line to start indicating a downward trend. At that particular point where TRIMA goes above the price of that target is known as Dynamic support level. See more on the screenshot below.
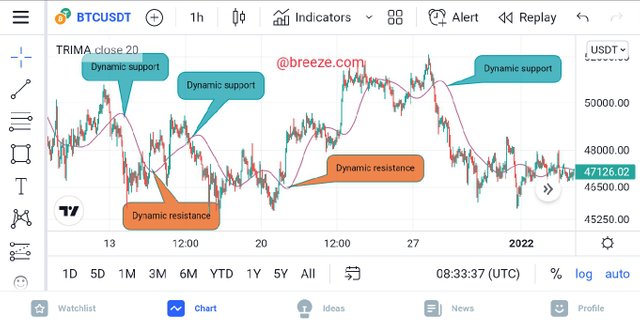
Screenshot from Trading view
Conversely TRIMA can equally act as a dynamic support . This happens when there is a down movement in the price of a community then followed by TRIMA going below the price line indicating a start of an up trend . At the juncture it could be ascertain that the price cannot no longer move further below indicating a dynamic support level. See more on the screen shot above .
As earlier stated TRIMA indicates a consolidating market by entangling with the price of that asset. That is where we see TRIMA mixed with the price line .A consolidation phase occurs in the market when we neither see an up trend or a down trend . This indicates the ability of both buyers and sellers to dominate the other. The market is said to be in an equilibrium state check the screenshot below to see clearly the consolidation phase of ETH/USD pair in a 1hour time frame .
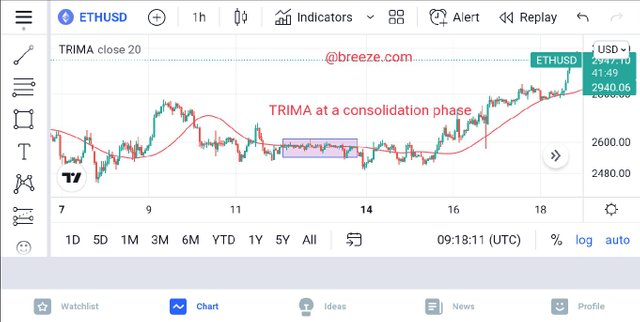
Screenshot from Trading view

5
Combine two TRIMAs and indicate how to identify buy/sell positions through crossovers. Note: Use another period combination other than the one used in the lecture, explain your choice of the period. (Screenshots required).
From past experience experts have always advised that it is preferable to combine two or more indicators in order to make a better buy or sell decision . TRIMA just like any other moving average always indicate some time later when the action in the market has passed. So the combination of two may help in guiding traders make a buy or sell decision to minimise loss
The combination in my case will comprise of a shorter moving TRIMA and a longer moving TRIMA.A cross over between the two will either indicate a buy or sell position.
In my combination i have chose one shorter moving TRIMA ,with period set at 15( in black)and a longer TRIMA with period set at 30(In red) .I chose this period because i believe the longer period TRIMA will move relatively faster than the shorter period TRIMA. The faster moving TRIMA plus the shorter TRIMA ,it will give me a closer picture of how the market is behaving.This combination will give the smoothest situation in the market
When these two are combined we can easily detect a downward and/or upward trend.
For a downward trend where we are expected to place a sell order we will wait to see the longer period TRIMA crossing the shorter period TRIMA from the top.
Observe clearly from the chat below we realise that the longer period TRIMA (red)crosses over the shorter period TRIMA ( Black) ,it is a clear indicating of a start of a down trend and a perfect time to place a sell order.
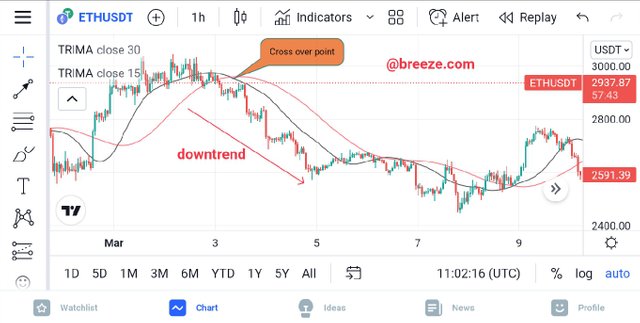
Screenshot from Trading view
On the other hand when the shorter period TRIMA crosses the Longer period TRIMA from below it indicates an upward trend and a perfect time to place a buy order. Observe clearly from the screen shot below .
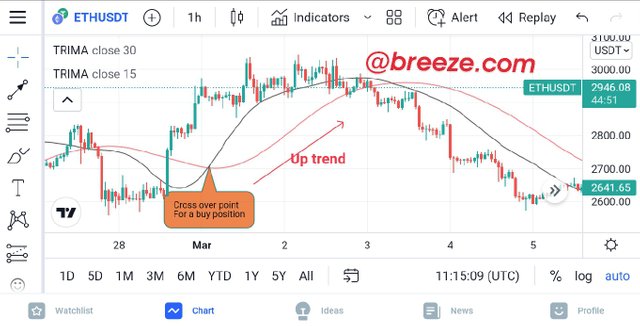
Screenshot from Trading view
As seen clearly on the screenshot of ETH/USD pair above we realise that the shorter period TIMA crossers over the longer period TIMA on a 1 hour time frame indicating up trend and perfect time to take a buy position.

6
What are the conditions that must be satisfied to trade reversals using TRIMA combining RSI? Show the chart analysis. What other momentum indicators can be used to confirm TRIMA crossovers? Show examples on the chart. (Screenshots required).
Before a trade is executed base on the TRIMA /RSI indicators the following conditions must be fulfilled;
For a Buy position
I will ensure that the shorter period TRIMA has successfully crossed the longer period TRIMA.
Also i will check if RSI had reached the over sold zone
When all these are checked i will placed my trade after the second candle has been confirmed
My stop loss will be placed below the cross over zone while my Take profit will be placed above the cross over.
See more on the screenshot below
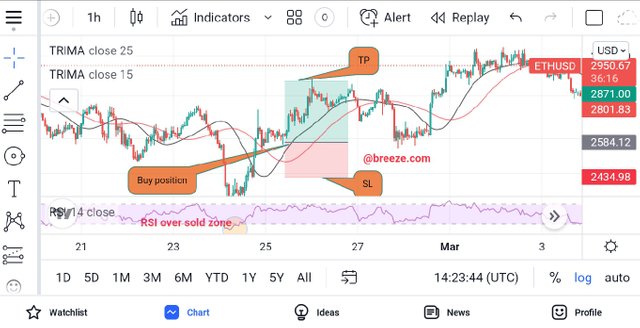
Screenshot from Trading view
Conversely to trade reversals using TRIMA and RSI using for a bearish market ,the following conditions must be made;
- The RSI must have hit the over sold zone
- The shorter period TRIMA must cross over the longer period TRIMA from above
- Equally ,the stop loss should be placed above the cross over zone and the TP should be placed below the cross over zone.
A good example has been demonstrated on the screen shot below.
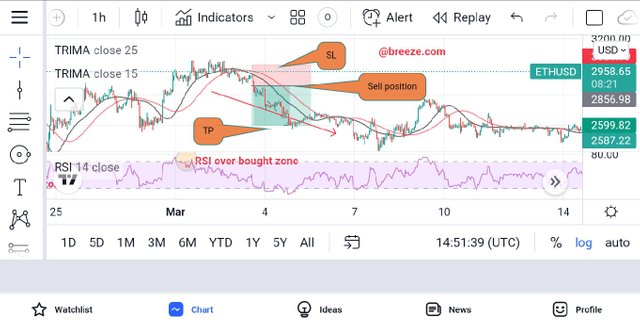
Screenshot from Trading view
7
.Place a Demo and Real trade using the TRIMA reversal trading strategy (combine RSI). Ideally, bullish and bearish reversals. Utilize lower time frames with proper risk management. (Screenshots required).
I did an analysis on the ETH/USD pair and noticed the cross over of of the TIMA the RSI had hit the over sold zone so i rushed and placed my trade on MT5 platform. It was a sell order on a 1 minute time frame. My trade did not got well as i thought and it hit my stop loss position.
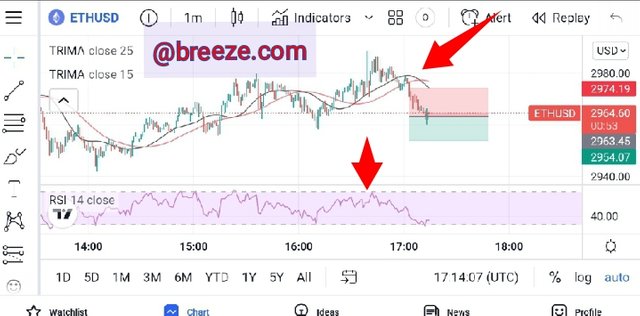
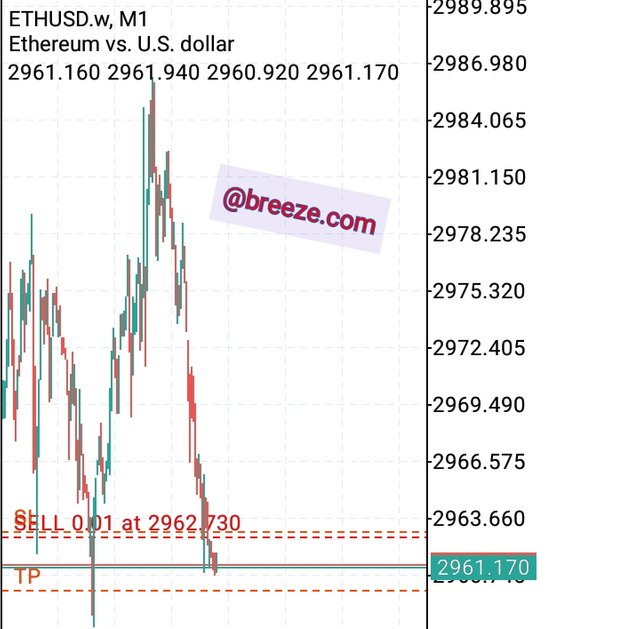
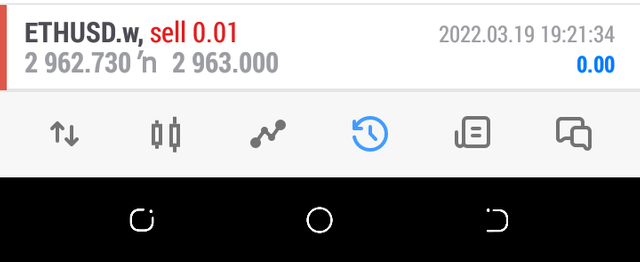
I waited for something observed the market for sometime and did not see the perfect opportunity to take another trade.
8
What are the advantages and disadvantages of TRIMA Indicator?
Just like any other moving average indicator the TRIMA has it's own advantages and disadvantages.
Advantages
- The TRIMA is a great filter because it smoothens the market for a clearer view .
- TRIMA has a lagging a nature which makes it gives a relatively truer picture of the market
- TRIMA can also be a good tool to use when identifying support and resistance points.
Disadvantages.
Just like most moving averages TRIMA does not give fast movements with relation to price. This may make traders make wrong decisions
TRIMA could be misleading just like other indicators by producing false trends .This could be dangerous as it could mislead most traders.
From a personal observation i realised TRIMA paints only an afterwards picture of the market . You will hardly get a snipper entry if following TRIMA..
Conclusion
It has been an interesting lesson knowing more about TRIMA and how we can combine two or more TRIMAs to get a desired results. I am particularly impressed on how TRIMA clearly shows trends in the market . I will look forward to exploit more potentials of this great indicators to get the best out of it .
I appreciate Professor @fredquantum for providing most of the first class materials i used for this thanks.