
In your own words, give a simplified explanation of the CMF indicator with an example of how to calculate it's Value?

CMF INDICATOR
This indicator came into existence in the year 1980 through a market analyst known as Marc Chaikin. With the CMF indicator,the amount of money flow volume is measured over a specific period of time so as to know the pressure at which assets are bought or sold and this is possible by knowing the rate at which cash flows in or out of the market.
When using the CMF indicator, an accumulation is evident when the closing price of an asset is close to a high,and then a distribution phase is evident when a closing price gets to a low. This indicator is used to know the trend with which an asset moves,as well as to know the strength of a trend and also to know when there will be a breakout or a reversal.
The CMF makes use of lines with values of 1 to -1, with a value of 0 serving as a midpoint. When the CMF line moves to the direction of 1, it means that the rate at which an asset is bought, is very high. Also when it moves towards -1 it shows that the selling rate is high.
CMF Calculation
It is calculated using the following steps
First get to find the Money Flow multiplier
Where MFM = [(closing price- low price)-(high price-close price)]/(High price-low price)Money flow volume is calculated by multiplying MFM by volume for each period.
MFV = MFM × Volume for the period
- The money flow volume for the number of period( having in mind 20default set up) is added up and then the value gotten is divided by sum of the 20period of volume.
That is;
CMF(20-period) = 20-period sum of money flow volume/20 - period sum of volume.
For instance, a BTC/USDT chart has an observation period of 21 days,and has the following price readings;
Closing price = $4,488.07
High price = $4,507.12
Low price = $4,432.04
VP = $9,871
Total VP = $12,550 Million
Let's Use the above stated formula;
MFM = [(4488.07-4432.04) - (4507.12-4488.07)]/(4507.12-4432.04)
MFM = 56.03-19.05/75.08
MFM = 36.98/75.08
MFM = 0.49(2SF)
MFV = 0.49 × $19871
MFM = 4,836.79
CMF = 4,836.79/$12550M
MFM = 0.385M
Demonstrate how to add the indicator to the chart on a platform other than the tradingview, highlighting how to modify the settings of the period(best setting)

Adding Chaikin Money Flow Indicator in eToro
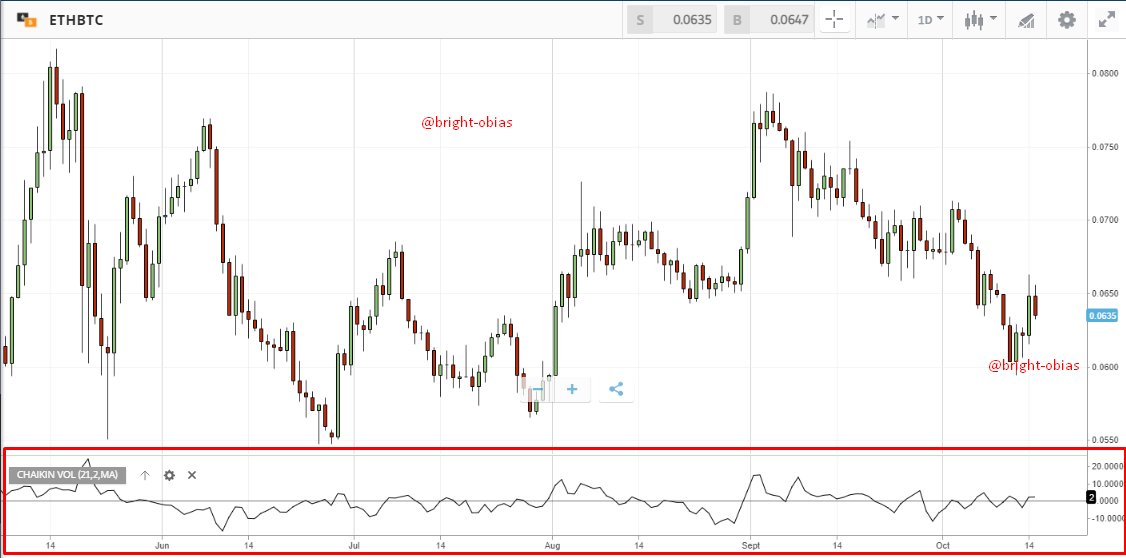
After setting up your trading chart on eToro in our case ETH/BTC, add the Chaikin Money Flow Indicator by clicking on the “Indicators” icon as shown here.
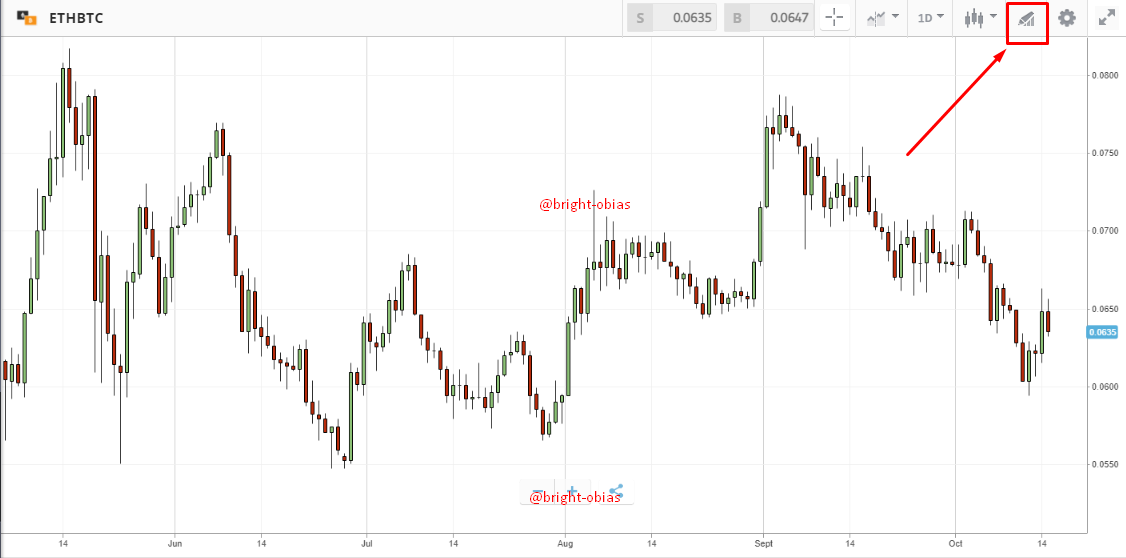
Clicking on this will provide you with a list of indicators under different categories as shown below.
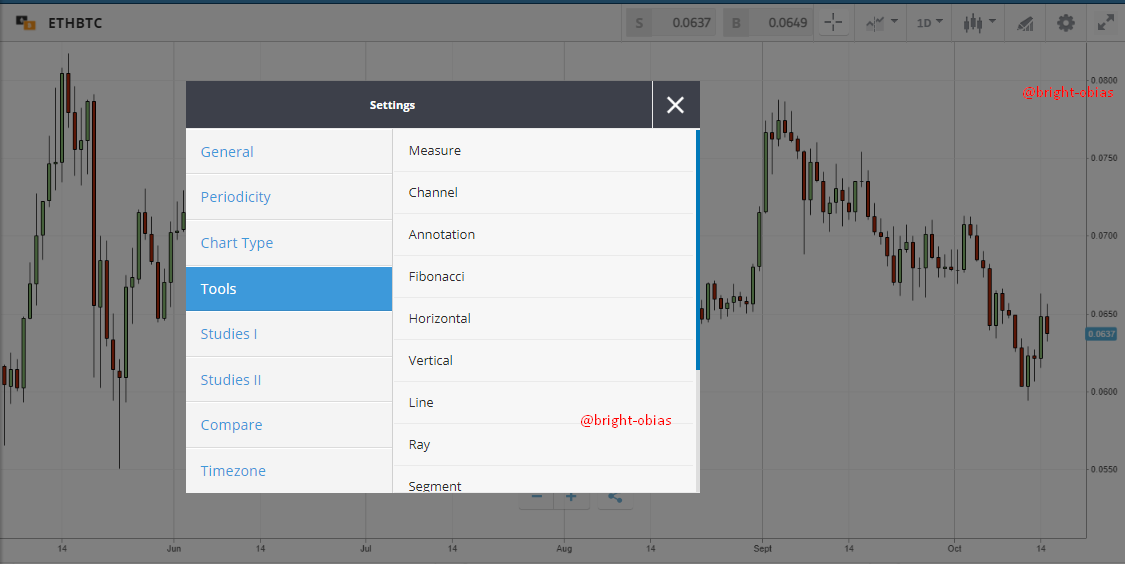
Next, click on “Studies I” to reveal and select the Chaikin Money Flow (CMF) Indicator. Note that it is named differently here.
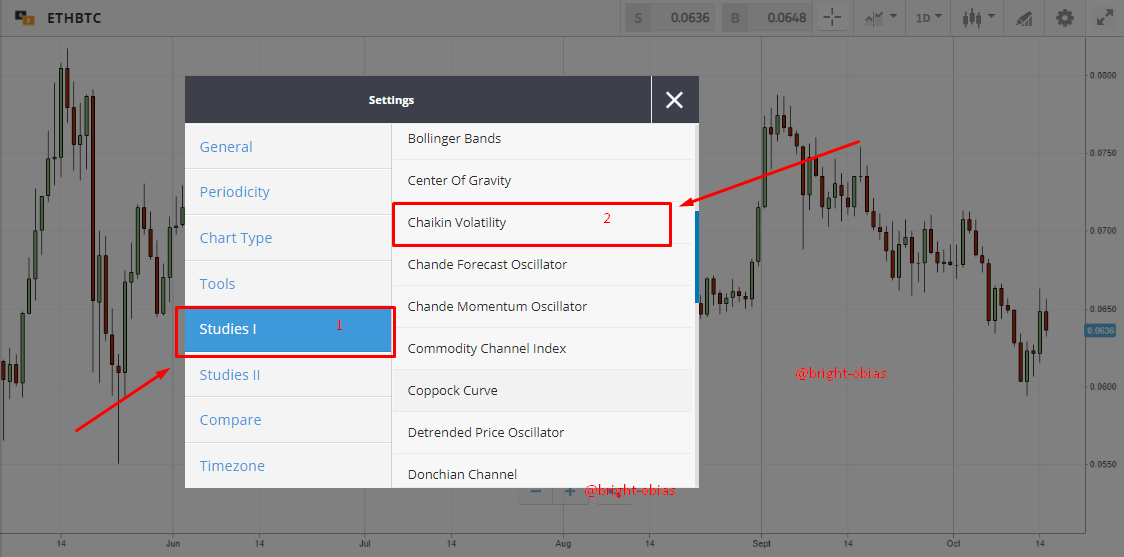
Clicking on the “Chaikin Volatility” above adds the Chaikin Money Flow Indicator to your chart. However, before this is done, you will be presented with some options to customize the indicator for the best results. eToro provides a very simplistic and uncomplicated view of this indicator, as shown below.
You just have to modify the period area to either 20 or 21 days and optionally change colour in the result area to their preference. The moving average type should at best be left at simple unless you are a pro-user. Having done all this, click on create to add the indicator to your chart.
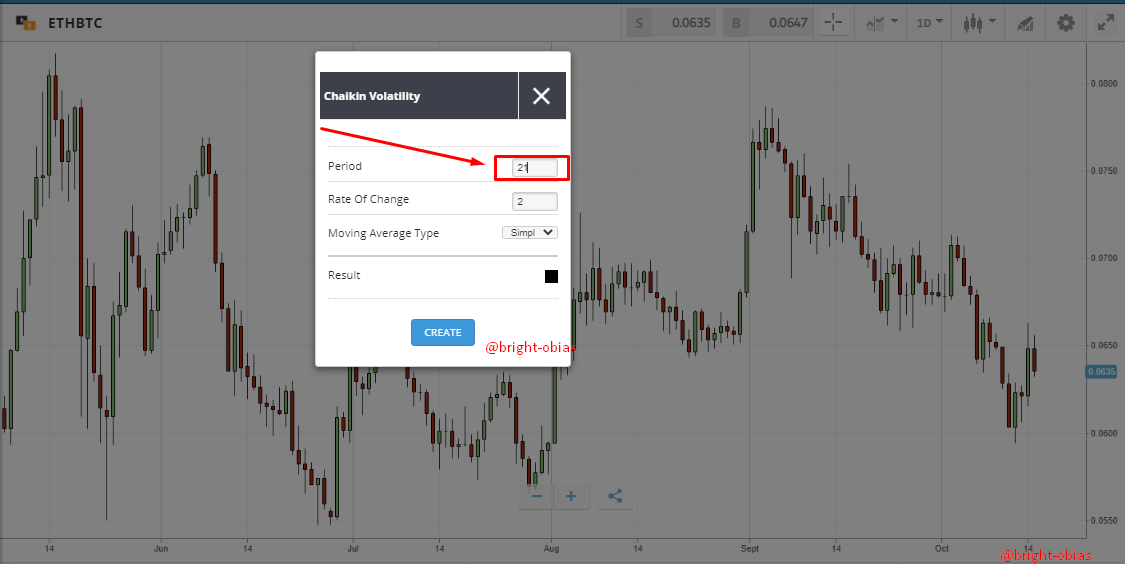
Having done the above, your indicator is ready to guide your path while trading and navigating the market.
What is the indicator’s role in confirming the direction of the trend and determining entry and exit points (buy/sell)؟(screenshot required)

CMF role in confirming the direction of a trend
In confirming a trend, the indicator plays a simple but significant role. Let’s examine the chart below for insight on this.
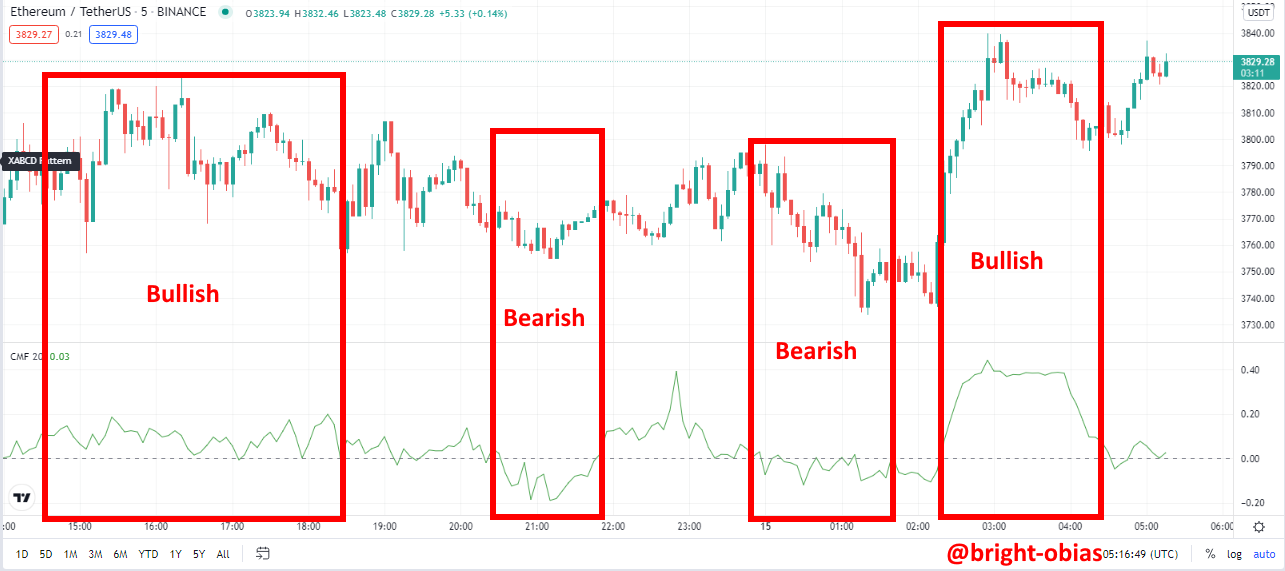
Bullish trend: Bullish trend which is usually a price-increase period (high buying pressure) can be confirmed using the CMF indicator by examining it closely. If the CMF indicator crosses the zero mark and goes above it as shown in the [A] part of the screenshot above, it is a signal that a bullish trend will continue.
Bearish trend: Bearish trend, marked by a price decrease, a point at which selling pressure is high is shown by the CMF indicator as a point in which the indicator dips below the 0 line, found in the minus (-) area.
CMF role in Making Market Entry and Exit
Whenever the CMF crosses the 0 point or probably is approaching closer to this point, it is an indication of a possible trend reversal (TR) and a time in which traders should either enter or leave the market. With this basic knowledge, and with the help of the chart below, let’s identify how to enter and leave the market using the CMF indicator.
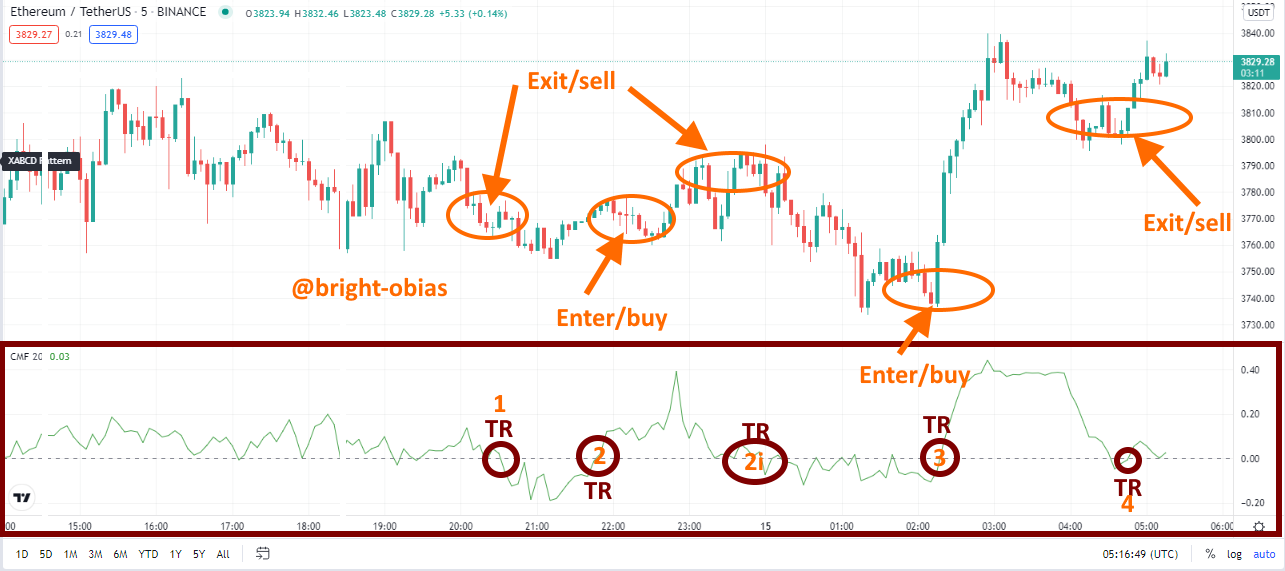
Entry point (buy): Examining the chart above, the best point to enter the market has been marked as TR 2, and TR 3. At this point, there is a trend reversal from a bearish trend to a bullish trend.
Exit point (sell): The best exit points from the chart above have been marked as TR1, TR2i, and TR4. At these points, there is a bullish trend reversal from a bullish to the formation of a bearish trend.
Trade with a crossover signal between the CMF and wider lines such as +/- 0.1 or +/- 0.15 or it can also be +/- 0.2,

In this section, I will clearly describe the trading sections of crossover between the CFM ad wider lines such as +/- 0.1 or +/- 0.15, or it can also be +/- 0.2. Let's take the two buy and sell trades below.
Buy Entry With +/- 0.2 Wider Line
Placing a buy entry with the CMF indicator, from the chart below, I noticed that the indicator is below - 0.2 line in the CFM section of the chart. Taking a close look, the indicator was above the line in between - 0.2 & 0.2 lines, before it then climbed above 0.2 where I decided to enter the market.
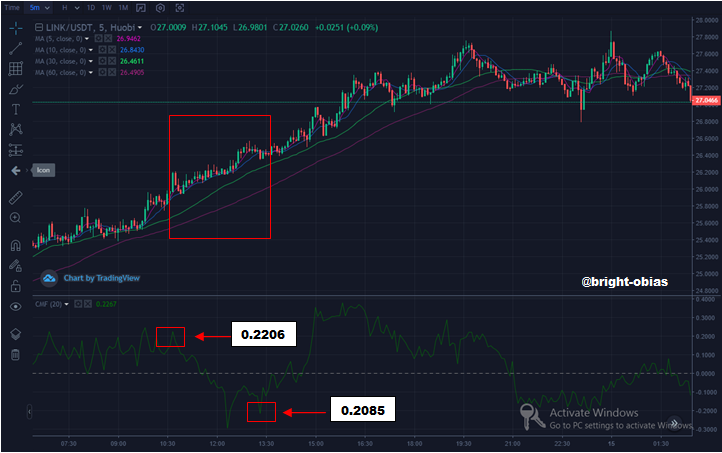
Looking at the chart, you will notice that the market is in an uptrend, so for my trade, I set my stop loss below the low(0.210) and exited the market with a take profit where the Indicator went above - 0.2 line.
Sell Entry With +/- 0.2 Wider Line
Unlike the buy entry, there was downfall in the CFM indicator where I then place a sell trade above the 0.2 line before it went down to -0.2. Now, I entered with a stop-loss range of the previous high, and exited the market with a take profit range where the indicator grew above the 0.2 line. So looking at the above chat, we can discover that the important signals should the swings above and below the wider +/-0.2.
Explain How to trade with divergence between the CMF and the price line? Does this trading strategy produce false signals?

It has been very clear that almost all the indicators has the occurrence of divergence which signifies the weakness of both buyers and sellers in the market. To explain further, when an indicator(CMF) is not corresponding with the price movement, we can easily say that a divergence has occurred. Let's take a look at th two divergence that do occur in the market.
Bullish Divergence
A bullish divergence in a market chart when the trend seems to be going in an opposite direction with the indicator, that is when the price is moving in a downtrend and on the indicator, it's shows an uptrend movement. Let's relate from the screenshot below.

From the above you chart you can see a bullish divergence, whenever such signals are observed, it simply indicates a weakness in the trend which can lead to a trend reversal. Let's see another divergence In bearish chart below.
Bearish Divergence
Unlike the first chart where we have seen a divergence that occured in the bullish market. In a bearish market, a divergence can be spotted when the movement of price is in a downtrend but on the indicator it shows an uptrend movement. See screenshot below.

Now, from the above image you can see a price movement in an uptrend signaling a buy section, while in the CFM. section it is showing a downward movement which also signifies a selling section.
Conclusion

In conclusion, I want to briefly say that the CMF indicator, is an indicator that is dedicated to detect price and volume in a market trend. As we have seen the line above the positive value is to interpret an uptrend and a negative value denotes a downtrend.
It is important to note that trading with CMF indicator requires an additional method ( strategy ) for tracking the movement of price in the market. Thank you so much for reading through to the end, I want to also appreciate the professor for such a wonderful lecture. Thank you
Downvoting a post can decrease pending rewards and make it less visible. Common reasons:
Submit
Hello @bright-obias,
Thank you for participating in the 6th Week Crypto Course in its 4th season and for your efforts to complete the suggested tasks, you deserve a Total|5/10 rating, according to the following scale:
My review :
Work with average content. It was possible to go deeper into the ideas presented and provide several examples. Here are some notes that I bring to you.
Good explanation of the CMF indicator with all its features and method of calculating it. You have given an obvious example but it is not correct since you have to provide the results of 19 previous periods to get the result of period 20. It was possible to add an interepting to the result obtained.
You didn't delve into how to choose the right settings for the periods.
You haven't answer how the divergence strategy is capable of bypassing false signals for the CMF indicator.
Thanks again for your effort, and we look forward to reading your next work.
Sincerely,@kouba01
Downvoting a post can decrease pending rewards and make it less visible. Common reasons:
Submit