
edited with canva
The lecture delivered on Heikin-Ashi technique by professor @reddileep was quite informative and instructive and I feel I should be using this new candlestick pattern instead of the traditional candlestick patterns I have been using. In contributing my own research I decided to make a submission to this homework task. Have a nice read.

1- Define Heikin-Ashi Technique in your own words.

Actually, Heikin-Ashi is a Japanese name which simply means average bar. It refers to a type of trading pattern which is based on candlestick and, hence, makes use of charts in giving visual representation of the movement of price action in the market. It can be very useful for the identification of signals from market trends. Equally, it can be used in predicting possible price movement in the near future. Usually, this technique makes use of the average price data. This makes it possible for it to carefully filter out the noise that is ongoing in the market.
The fact that this technique filters out the noise results in the creation of market direction and trend which is illustrated very clearly. This makes it easier for the prediction of possible price movement. Then, you can use the technique to determine when a reversal is possible and therefore understand whether you should be holding on to your open trades, closing them or entering into new trading positions. Equally, you can use this technique to know when you have to lock in profits on your open positions.
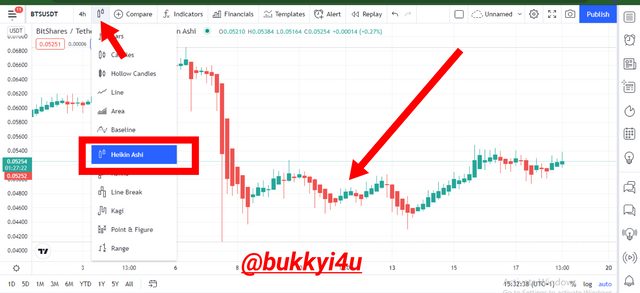
Fig 1: Heikin-Ashi chart pattern
Actually, this technique was developed in the 1700s by Munehisa Homma for the purpose of being used as an indicator in trading the financial markets. Really there are a lot of common characteristics between the traditional Japanese candlestick chart patterns and the Heikin-Ashi candlestick chart pattern. However, much of the difference between them comes from the computation of the values of the candlesticks.
The calculation of the Heikin-Ashi chart makes use of a formula to which finds its basis in the use of two period moving averages. This means that unlike traditional candlestick chart patterns there is no use of open, high, low or closing prices for the calculation. This enables the technique to be presented with a much smoother chart, thereby, making it easier to identify possible reversals and the ongoing trend. The technique also hides gaps in the market.
What information does the Heikin-Ashi technique give?
By looking at this technique at a glance there is some information that can be readily obtained. These include:
- The ability to more easily identify the trend in the market
- The formation of hollow green or white candles that have no shadows attached to them easily gives signal for a possible strong uptrend
- The formation of filled red or black candles that have no upper shadow would usually signifying a strong downtrend
- The reversal patterns created in traditional candlesticks can also be obtained with the Heikin-Ashi technique
- Normally, this technique comes with candlesticks that possess small bodies with with upper and lower shadows that are longer in nature

2- Make your own research and differentiate between the traditional candlestick chart and the Heikin-Ashi chart.

From my research I discovered that there are quite a number of differences between the traditional Japanese candlestick chart and the Heikin-Ashi chart. I would like to compare the differences side by side.
1). It is easier to spot the ongoing trend with the Heikin-Ashi chart than with the Japanese candlestick chart
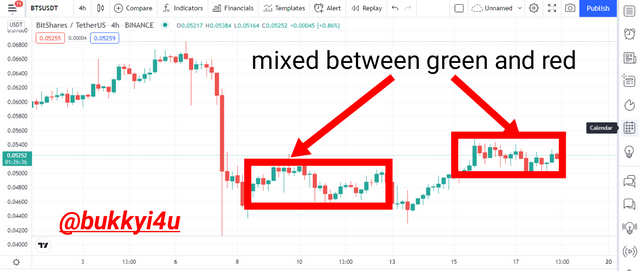
Fig 2: Traditional candles do not always stay either green or red
By looking at the traditional Japanese candlestick charts you would discover that the green candles frequently interchange their place with the red candles. This means that even in an uptrend you would still get a mix of both green and red candles. Normally, it would be expected that an uptrend should consist of green candles. Same goes for downtrends where red candles are expected but we still get a mix of the two.
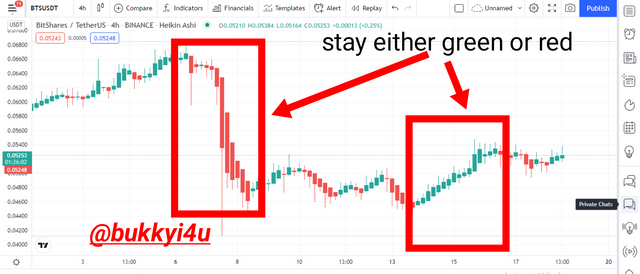
Fig 3: Heikin-Ashi candles stay either green or red
From the chart pattern above, it can be seen that the Heikin-Ashi chart normally remains green when the market is in an uptrend and red when the market is in a downtrend. This would be so especially if the market is in a strong downtrend or uptrend.
2). Moves of the price action in any particular direction is smoothed out more easily with the Heikin-Ashi than with the traditional Japanese chart pattern
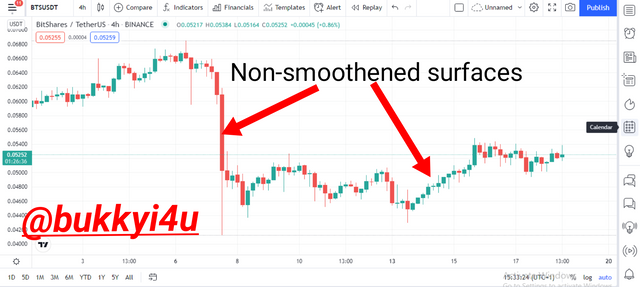
Fig 4:non-smoothed traditional candles
From the diagram above you can discover that the traditional Japanese candlesticks are not so much smoothed out. They look somewhat rough with some kind of ups and downs. This is irrespective of whether it is an uptrend or downtrend.
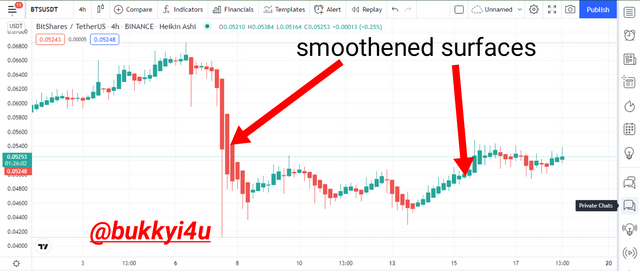
Fig 5:smoothed heikin-ashi candles
By looking at the chart above you will discover that the Heikin-Ashi chart presents a more smooth-looking price action. Actually, a lot of traders will prefer to use this particular candlestick since it has the ability of reducing the noise in the market. In this way it gives them the opportunity to more easily analyse the market.
3). Subsequent traditional candles and Heikin-Ashi candles are produced differently
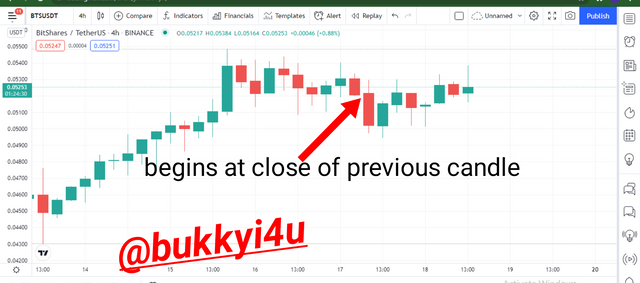
Fig 6: successive traditional candles
Another point to note is that every new traditional Japanese candlestick begins at the close of the previous candle. This is not the case with the Heikin-Ashi candlesticks.
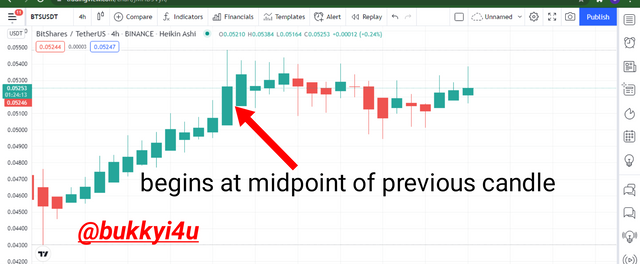
Fig 7: successive Heikin-Ashi candles
In the case of the Heikin-Ashi candles you will discover that each successive candlestick begins at the middle of the proceeding candle. Usually, the Heikin-Ashi candles are produced this way as a result of their mode of calculation.
4). Unlike the traditional candlestick pattern the Heikin-Ashi hides gaps and all such likes
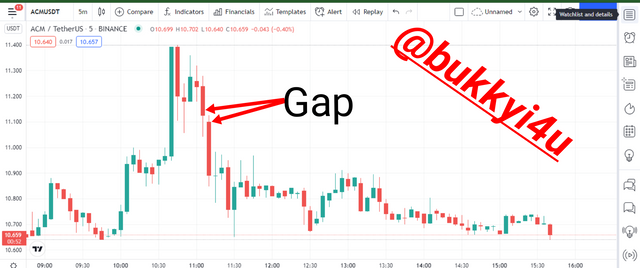
Fig 8: traditional candlestick with gap
One other difference between the traditional candlestick chart pattern and the Heikin-Ashi is that in the traditional candlestick chart pattern small corrections and consolidations in price action are given visual representation. Gaps in price action are equally shown.
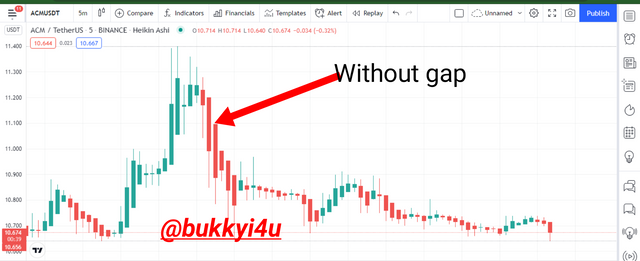
Fig 9: Heikin-Ashi without gap
In the Heikin-Ashi candlestick chart pattern small price pullbacks, corrections or consolidations are not given much visual representation. Equally, gaps are not usually presented on the chart.

3- Explain the Heikin-Ashi Formula. (In addition to simply stating the formula, you should provide a clear explanation about the calculation)

Alright, let us learn how to calculate the Heikin-Ashi candlesticks and also how to plot them on the chart.
Just like I have already said, although these candlesticks may look quite similar to the traditional Japanese candlesticks, they are really not the same. More or less, it is quite similar to being able to differentiate between a dog and a wolf.
In the traditional Japanese candlestick charts, the opening, high, low and closing prices made within the timeframe in view are used for the representation of each candlestick.
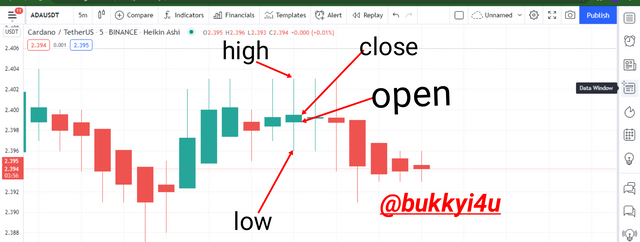
Fig 10:points on a candlestick
However, the Heikin-Ashi candlestick chart does not only involve candlesticks that include the movement of prices within the time frame in view, its candlesticks are also made to calculate price data from the past.
Okay. Down to the real calculation.
First of all, let me show a Heikin-Ashi candlestick pattern of the ADA/USDT crypto pair for reference purposes:
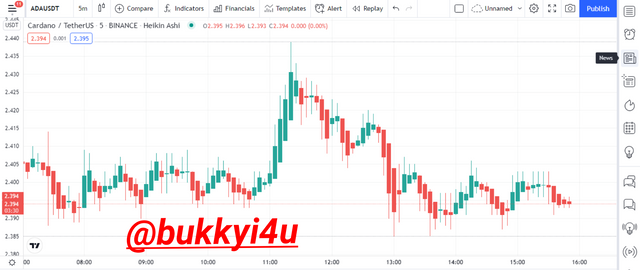
Fig 11: Heikin-Ashi pattern of ADA/USDT
Obviously, it bears some similarities with the traditional candlesticks save for the fact that the opening and closing prices are not calculated the same way.
However, it has open, close, high and low just like the traditional candlestick. So, the Heikin-Ashi formula comes in four parts:
- The open of the new candlestick which is the same as the previous candle's midpoint.
This is what you would discover by looking at the chart for reference. Each successive candlestick begins from the middle of the preceding one.
Open = [(open price of previous candle) + (close price of previous candle)] / 2
- The close of the candlestick is usually calculated as the average value between the open, high, low and close prices.
Close = (open + high + low + close) / 4
- The high is calculated to equal the actual or very high of the period under review (whether it be the open, highest shadow or close)
High = Maximum Price Reached
- The low is calculated to be the actual or very low of the period under review(whether it be the high, shadow or low)
Low = Minimum Price Reached
Generally, the idea behind the Heikin-Ashi candlestick pattern is that the chart presents a price action that has been smoothed to minimise or possibly eliminate the noise in the market.
In summary the Heikin-Ashi formula can be written thus:
High = Maximum of Open, High or Close
Low = Minimum of Open, Low or Close
Open = [Open (previous candle) + Close (previous candle)] /2
Close = (Open + High + Low + Close) / 4

4- Graphically explain trends and buying opportunities through Heikin-Ashi Candles.

Understanding how trends work with this strategy would help you understand whether or not to undertake a trade. With this strategy, shorter or smaller candle shadows or wicks signify stronger trends in the indicated direction. A strong uptrend is in place when there are green candles that do not have any lower shadow or wick. Conversely, a strong downtrend is in place when there is the appearance of red candles that do not have any upper wick or shadow.
HEIKIN-ASHI CANDLESTICK TRENDS
I want to explain a few Heikin-Ashi candles trends that can help traders identify trends and maximize their profits.
- A strong bullish trend
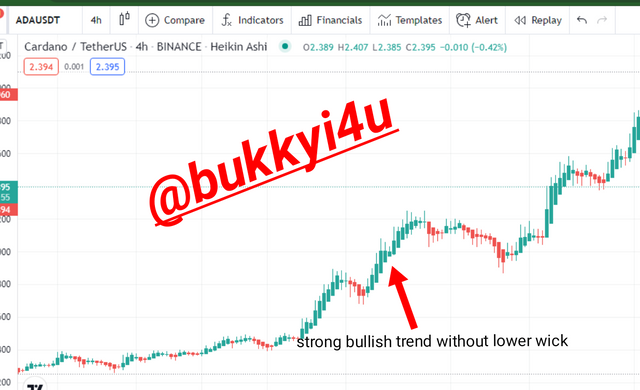
Fig 12: Heikin-Ashi strong bullish trend
This will be very powerful in identifying the beginning of a strong uptrend. Normally, Heikin-Ashi signals are thought to be very accurate. The beginning of a strong bullish run is often signalled by the appearance of Heikin-Ashi candlesticks without any lower wicks or shadows. The more an uptrend becomes stronger the more candlesticks without tails are produced in a sequence.
- A strong downtrend
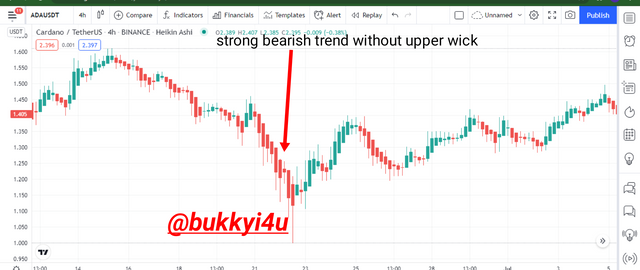
Fig 13: Heikin-Ashi strong bearish trend
This strategy is equally powerful in identifying the beginning of a strong downtrend. Normally, Heikin-Ashi signals are thought to be quite accurate when they indicate strong downtrends. Usually, the beginning of a strong bearish run is often signalled by the appearance of candlesticks without any upper wicks or shadows. The more the downtrend becomes stronger, the more candlesticks without upper wicks are produced in a sequence.
- Trend reversals or pauses
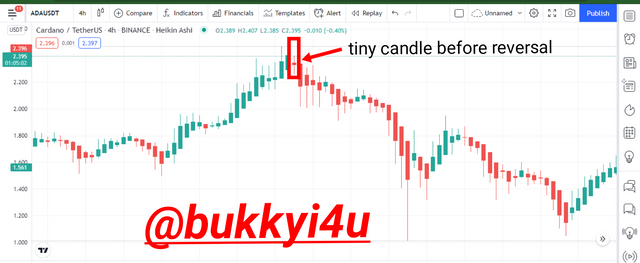
Fig 14: Heikin-Ashi trend reversals
With the Heikin-Ashi technique the appearance of candles that have tiny bodies with upper and lower wicks or shadows would often signal impending trend reversals. Some traders would want to open positions in the reverse direction as these tiny candles appear. However, it will be advisable to wait for the downwards crossing of the 55 and 21 EMAs.
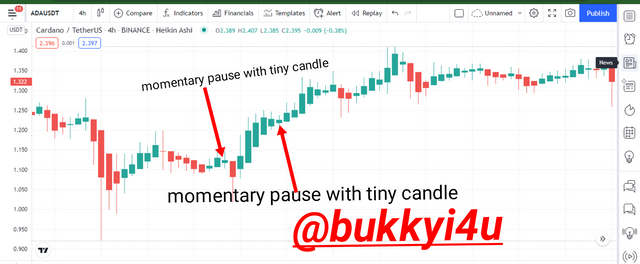
Fig 15: Heikin-Ashi trend pauses
Furthermore, just as shown in the chart above the appearance of these tiny candles could just represent pauses in the trend instead of complete reversals. So, it is always better to wait for confirmation before taking a trade in the reverse direction.
Heikin-Ashi Trading Strategies
I want to describe a few situations and strategies that can be used for either buy or sell trades with the Heikin-Ashi technique. This strategy requires the implementation of the 55 EMA and 21 EMA.
Appearance Of Green Candles:-
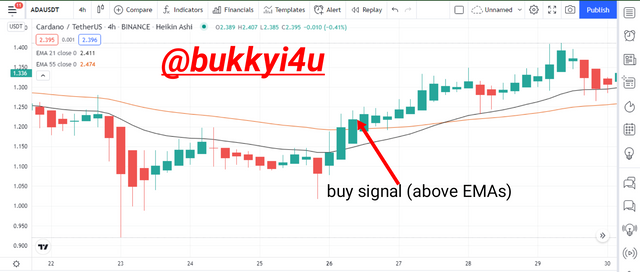
Fig 16: Heikin-ashi buy signal
Since the candles successively turning from red to green indicates possible uptrend you should:
- Wait for the candle to clearly go above the 55 and 21 EMAs
- You can enter a long position with the appearance of the green candle above the EMAs
- Set your take profit in your desired direction and a stop loss order below the two EMAs
- You should consider closing any open short positions
Appearance Of Green Candles Without Lower Shadows:-
When the green candles become more successive without lower shadows you should:
- Allow the long trade to last until there is a change to red candles
Appearance Of Red Candles:-
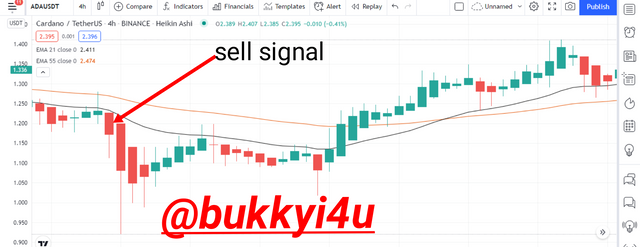
Fig 17: Heikin-ashi sell signal
Since the candles successively turning from green to red indicates possible downtrend you should:
- Wait for the candle to clearly go below the 55 and 21 EMAs
- You can enter a short position with the appearance of the red candle below the EMAs
- Set your take profit in the your desired direction and a stop loss order above the two EMAs
- You should consider closing any open long positions
Appearance Of Red Candles Without Upper Shadows:-
When the red candles become more successive without upper shadows you should:
- Allow the short trade to last until there is a change to green candles

5- Is it possible to transact only with signals received using the Heikin-Ashi Technique? Explain the reasons for your answer.

Actually, many traders believe that the Heikin-Ashi technique comes with signals that can often prove to be correct in predicting potential market movements. There are quite a good number of ways that the Heikin-Ashi could be very useful in delivering profitable signals. These can include:
- The advantage of being able to access this indicator on most available price charts without having to pay for them
- The ability to easily read the chart and interpret its patterns which makes it easier to spot the ongoing trends and identify possible market movements
- The fact that many traders have proven it to be very accurate and reliable since it makes use of historical data (this in itself being a dependable database)
- Its ability to filter out the noise in the market; reducing corrections and thereby delivering more quality and transparent signals with a stronger smoothing effect. This would very correctly - or, at least, to a large extent - inform appropriate and timely entry and exit points)
- Again, the technique can be used on any time frame and higher time frames have actually been proven to be more reliable
However, one fact that most of these traders have come to agree with is that the credibility and dependence of the technique is equally greatly improved when it is appropriately combined with other confirmatory indicators. This would then help to provide much stronger signals for profitable trades.
Much of why the technique has been tested to work well with the combination of some other indicators is majorly due to the fact that it does have its own limitations. No technique can be hundred percent correct. This has become a generally accepted axiom, after all. Some of the limitations of the Heikin-Ashi chart strategy that could be addressed with the combination of other indicators include:
- There is a time lag with this technique since its base signals have to rely on historical prices
- The presence of price gaps in charts is useful for the analysis of price momentum and possible trigger entries. The technique lacks this and would require switching between the traditional candlesticks in order to identify such important price gaps.
- The fact that the technique makes use of averaged price data means that the opening and closing prices are not actually represented; this may be to the disadvantage of scalpers and day traders, hence, requiring additional indicators.
So, while you may actually transact directly with signals received from the Heikin-Ashi technique, it would always be very helpful to combine the signals with other indicators. This will be useful in finding areas of confluence which will definitely act as stronger trading signals. Usually, signals received from the Heikin-Ashi work better over a longer term. So, day traders and scalpers would have to combine the technique with other indicators for better results.

6- By using a Demo account, perform both Buy and Sell orders using Heikin-Ashi+ 55 EMA+21 EMA.

In this section I will be producing clear charts with TradingView while entering real positions with my Binance account.
For Buy Position:-
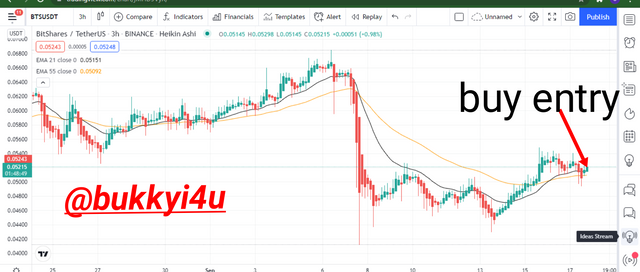
On the BTS/USDT 4 hour chart I waited for the price to go above the 21 EMA (black colour) and 55 EMA (orange) color. Then, I:
- Entered a buy position at 0.05239 on Binance spot trade
- Set a 2% take profit at 0.05344 in a 2:1 RR(Risk: Reward) ratio
- Set a 1% stop loss at 0.05186 below the two EMAs
Exit:-
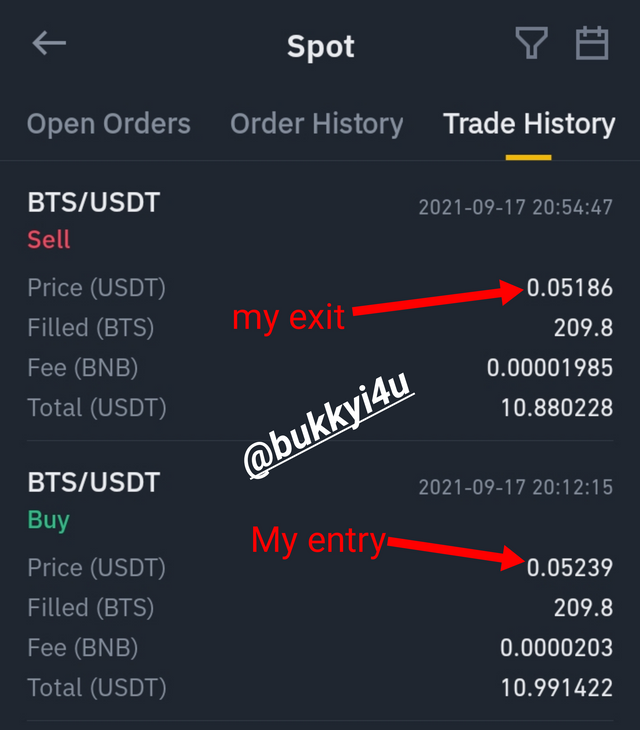
Binance
- Coming back to the trade I discovered my stop-loss order had been hit at 0.05186
For Sell Position:-
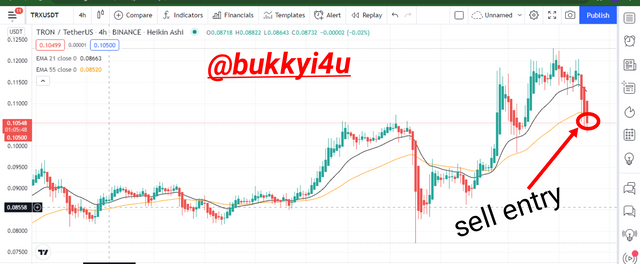
Entry:-
On the TRX/USDT 4 hour chart I waited for the price to go below the 21 EMA (black colour) and 55 EMA (orange colour). Then I:
- Entered a short position at 0.10500 on the Binance Futures
- Set a 2% take profit at 0.1029
- Set a 2% stop loss at 0.1071 in a 1:1 RR(Risk:Reward) ratio above the two EMAs
Exit:-
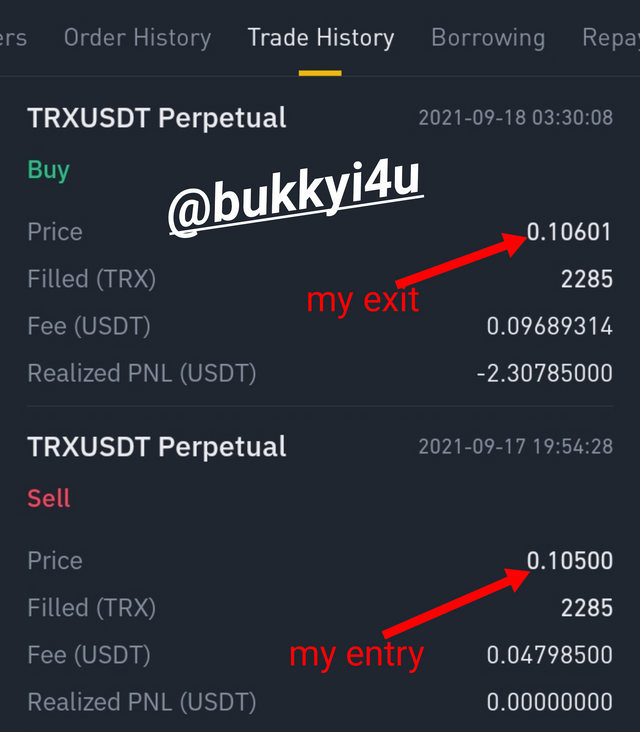
Binance
After the price had continued a little bit downwards, it began an upward trajectory. The price was now moving in between the two EMAs and I had to:-
- Close the position at 0.10601 at a loss

CONCLUSION

- The Heikin-Ashi technique is a kind of candlestick chart pattern which takes into cognizance the average price of an asset in visualising its price action
- Actually, this technique produces a more smooth chart pattern because it eliminates the noise in the market
- Usually, strong uptrends will be represented by successive green candles that have no lower wicks while strong downtrends would be represented by successive red candles without any upper wick
- Unlike traditional candlestick chart patterns each new candle of the Heikin-Ashi technique begins at the midpoint of the preceding candle
- The signals given by this technique are often said to be very accurate; however, it will always be better to confirm such signals with other indicators

(Unless otherwise indicated, all screenshots are taken from TradingView)

Please Sir @reddileep, how do I produce my chart to indicate my take profit and stop loss orders with colours on TradingView in the manner below:
Downvoting a post can decrease pending rewards and make it less visible. Common reasons:
Submit
You can do it by a Tradingview tool named Long position ( Buy) or short position (sell). It's placed on the left panel
Downvoting a post can decrease pending rewards and make it less visible. Common reasons:
Submit
Okay. Thanks @allbert
Downvoting a post can decrease pending rewards and make it less visible. Common reasons:
Submit