This submission is made in fulfillment of the Crypto Academy Season 4 Week 3 homework given by professor @sapwood.
Realized Capitalization
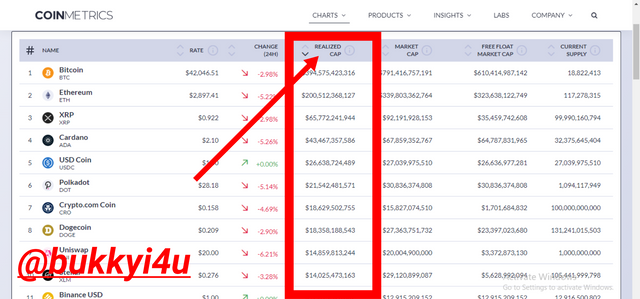
source Coinmetrics
The Realized Capitalization of an asset is a form of the market capitalisation concept which only takes into consideration the very last price at which every UTXO was traded as at the last time it was moved. This does not take into consideration the current market value of the asset. Consequently, it serves to tell the exact amount or realised value which a seller may have gained or a buyer paid for a coin (and in extension, all the coins in the network) as against the market value of such assets.
Unlike the market capitalization, the realized capitalization is able to eliminate the possible effect dormant coins or lost coins may have on the overall calculation of the valuation of the capitalization of an asset and only values assets based on their actual presence in the given network or supply chain of an asset.
This means that now spending a coin that had been moved at a much cheaper price in its last transaction would see the coin revalue itself to assume the current market price and, therefore, increase the realised cap by an amount equal to the current market value. Conversely, it re-values to assume a cheaper price if it had been last spent at a price higher than its current market value.
Practical Example:-
I wish to illustrate the realised cap with the transaction from bitcoin block explorer - https://www.blockchain.com/explorer - below.
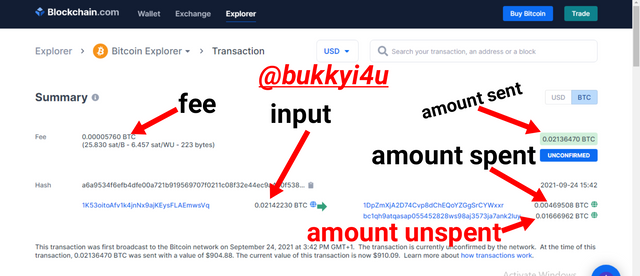
- In this particular transaction an input of 0.02142230 BTC was made.
- A network fee of 0.00005760 BTC was deducted
- Consequently, an amount of 0.02136470 BTC was sent
- However, only 0.00469508 BTC was spent from the sent amount
- Therefore, a 0.01666962 BTC was left unspent
Given:-
- The total UTXO 0.02142230 BTC
- The Unspent UTXO is 0.01666962 BTC
- The price of BTC at this time is $42,325
The realised cap of the total UTXO can be obtained as shown below:
Realized cap of UTXO 0.02142230 = Unspent UTXO, 0.01666962 X Current price of BTC, $42,325
Therefore, realized cap of UTXO 0.02142230 = $705.5416665.

Market Capitalization

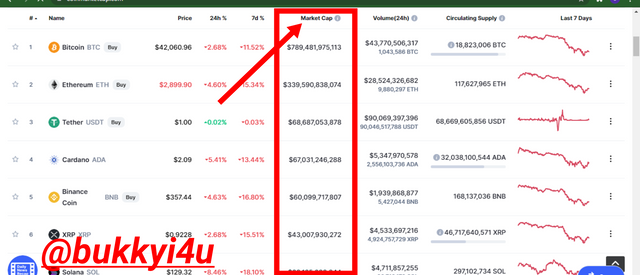
source Coinmarketcap
Market capitalization is a term that is generally used to describe a publicly traded asset and used to represent the market value of such an asset. Usually, it is calculated by multiplying the price of the crypto asset by the total number of the asset in circulation (that is, circulating supply)**. The fact that such crypto assets are traded in public markets means that the market capitalization can actually be used as an index to indicate the opinion of the public on the net worth of the asset. Consequently, the market capitalization has an overall effect in the eventual valuation of the asset.
Hence, Market Capitalization = Circulating Supply X Price Of Asset
There are two major differences between the market capitalisation and the realized capitalisation. While the market capitalisation bases its aggregation on the current market value of an asset the realized capitalisation only considers the value of such an asset as at when last it was moved or transacted with. Again, the market capitalisation does not recognise the absence of lost or dormant assets in its valuation - instead it calculates the value of all the assets ever mined - while the realized capitalisation does.

Calculating The Realized Capitalization

Usually, lost coins are discounted in the calculation of the realised cap. The intention of the realised cap is to calculate the values at which coins were actually exchanged by determining how much was paid for each coin, the different times at which they were supplied.
So, in valuing an Unspent Transaction Output (UTXO), consideration will be given to its price when it was last moved or created (that is, the time when a transaction was performed and it was left behind as an unspent transaction output).
Hence, Realized Capitalization = Value X Price(when created)
Where, Value = total number of UTXO units.
Example:-
Assuming your wallet is of this nature between January 2018 and September 2021:
- 3 UTXO bitcoins at $2,000 each
- 7 UTXO bitcoins at $700 each
- 12 UTXO bitcoins at $5,000 each
The realised cap for the 3 bitcoins is calculated thus:-
3 X $2,000 = $6,000
The realized cap for the 7 bitcoins is calculated thus:
7 X $700 = $4,900
The realized cap for the 12 bitcoins is calculated thus:-
12 X 5000 = $60,000
So, the total realised cap for the 22 bitcoins = $6,000 + $4,900 + $60,000
= $70,900
This equally means that he paid an average of $70,900/22 = $3,222.7272 for each of the bitcoins.

Interpreting The Realized Capitalization
Short Term(About 3 Months)
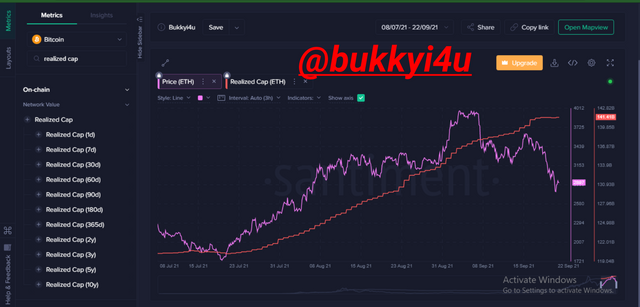
Observation:-
Between the 6th of July 2021 till somewhere before the 23rd of July 2021 the price of Ethereum was trading in a range and the realised cap remained in consonance by staying relatively at a stable or flat rate. From the 23rd of July 2021 up until the 31st of August 2021 there is a steady rise in the price of the asset and this is correlated by a steep rise in the realised cap.
Between 31st August 2021 to around 8 of September 2021 there was an increased upward momentum in the market but the realised cap does not particularly record an increase in momentum in its slope. This is followed by a decline in the price of the asset which now goes into a downtrend but the realised cap maintains an upward trajectory with a slight flattening towards the end, though.
Analysis:-
In the price chart where the market trades in a channel there isn't any pressure of any kind so the realised cap remains flat. Once prices started going up and unspent UTXO was being transacted and sent out, the realized cap began to increase showing that the coins that were being spent were gaining higher value than when they were kept unmoved. This represents profit.
When prices begin to go down the realised cap maintains its straightened and flattened slope which goes to show that they were no longer being spent anymore as hodlers wait for prices to begin to go up again.
Long Term(About 1 Year And 6 Months)
Observation:-
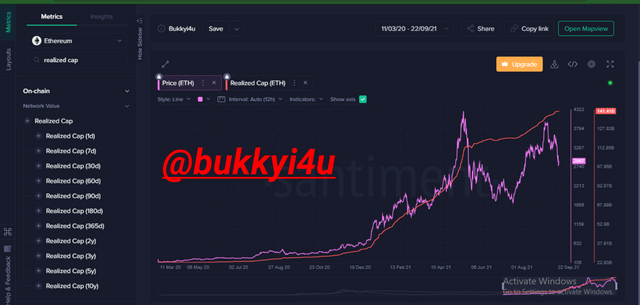
From the 11th of March 2020 up until the 18th of December 2020 the price of the asset remains in a channel and the realised cap resonates this by remaining flat. From somewhere a little bit beyond the 18th of December 2020 the price begins to increase way up till the 10th of April 2021 and the realised cap echoes this increase with an increasing gradient.
Then, between the 10th of April 2021 and the 8 of June 2021 that was an upshoot in price and the realised cap equally records an upshoot. From somewhere beyond the 8th of June 2021 till the 1st of August 2021 there was a decline in price but the realised cap simply flattened up and continues upward from beyond 1st of August 2021 even as the price of the asset begins to record another upward movement before bowing into a downtrend at the tail end up until around 22nd September.
Analysis:-
When the price remains in a channel, hodlers decide not to sell since they may not be in gain. So, the realised cap remains flat. Once prices started going up the realised cap then picks up and begins to create a slope meaning that unspent UTXO were now being spent.
In the place where the price moved very strongly upwards, a steep slope is created to show that more gains were accruing to the UTXOs that were now being spent. The realized cap remaining flat in downtrends shows that investors stop spending when prices are down.

Interpreting The Market Capitalization
Short Term(About 3 Months)
Observation:-
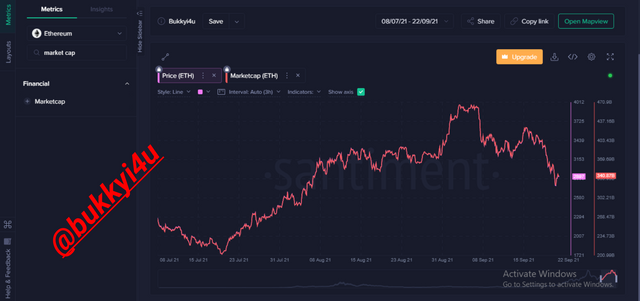
The price of the asset from the 8 of July 2021 till around the 31st of August 2021 moves from a channel where it started to an uptrend which continues with a slight retracement from the 23rd of August 2021 way up to the 31st of August 2021. From 31st August to 8 September 2021 there was an upshoot in price which continues with a retracement beyond 8 September till 15th September.
From around 15th September does an increase in price which begins to decline somewhere in between that time and the 22nd of September when it is observed to still be in a decline. All along the market cap seemed to have merged into the price action even as the price finally reads $2,897 and the market cap records $340.87 billion, correspondingly.
Analysis:-
The market cap moves in direct proportion and ratio with the price action. This is because it is used to estimate the value of the prize at every single instance. So, when prices go up or down, the market cap will equally go up or down since it will be multiplied with the circulating supply to give a corresponding estimated market value.
Long Term(About 1 Year And 6 Months)
Observation:-
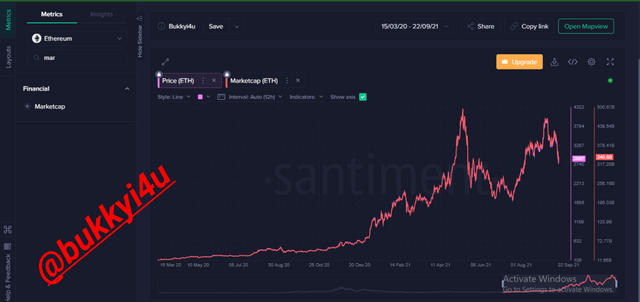
As price moves from the 15th of March 2020 till the 22nd of September 2021 with varying price actions ranging from a channel price oscillation to an uptrend and an increased momentum in an uptrend a retracement, an uptrend and, then, a price decline, there is no observed difference between the market cap and the price action. Both correlates.
Analysis:-
As has already been said the market cap simply estimates the current value of the asset in the market. So, it increases with increasing daily closing prices and decreases with decreasing daily closing prices against which the circulating supply is usually multiplied.

Interpreting The MVRV Ratio
Short Term(About 3 Months)
Observation:-
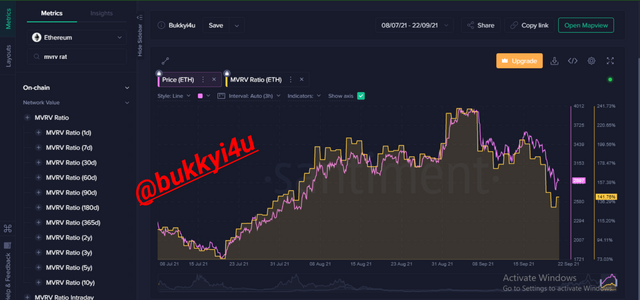
From the 8 of July 2021 till somewhere before the 23rd of July 2021 there is a slight downtrend in price and the MVRV ratio is equally seen to oscillate along the contours of the same downtrend. The price increases from 23rd July till the 15th of August 2021 and the MVRV ratio equally increases along the same line.
When the price of the asset flattened between 15th August 2021 to 31st August 2021, the MVRV ratio equally flattened. An upshoot in price, a decline and then a downtrend is closely followed by the MVRV ratio moving along the same path.
Analysis:-
Usually, the MVRV is calculated by dividing the market cap by the realised cap. This would give an idea of the realised value which can either be a gain or loss in the market. Whenever the MVRV ratio stretches extensively downwards, it shows that the price of the asset is undervalued and likely to experience an upturn. Conversely, if it stretches extensively upwards it would signify that the price of the asset was probably overvalued and likely to experience a downturn.
The MVRV ratio going below 100% to as low as around 73% between the 15th of July 2021 and the 23rd of July 2021 worked by telling us that price was undervalued and this eventually resulted in an upturn of prices as expected. When it stretches extensively to as high as around 241% between 31st August 2021 and 8th September 2021 there was an ensuing downturn as a result of price being overvalued.
Long Term(About 1 Year And 6 Months)
Observation:-
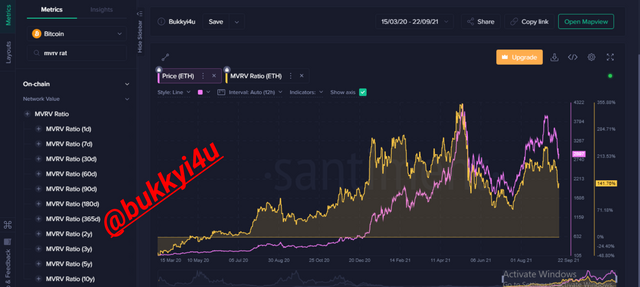
In the long run, I discovered that when the MVRV ratio is in a range the price is equally in a range. When it records increases this is in consonance with the price recording increases. Eventually, it gets to a point where it seemed to have stretched out upwards with an increased momentum in price but this is suddenly followed by a sharp downturn which continues in a deep retracement before the MVRV ratio goes up again with price correlating the uptrend. The price action follows the MVRV ratio closely.
Analysis:-
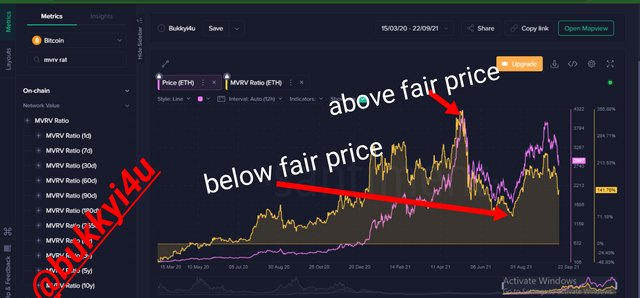
In the longer-term the MVRV ratio produces more pronounced upward or downward extensive stretches which means that they could give more reliable signals in this state. However, from the price chart of MVRV ratio in a longer term you would observe that, oftentimes, extensive outstretches of the MVRV towards the upside above a perceived fair price of the asset didn't result in eventual downturn. However, extensive outstretches of the MVRV ratio downwards below a perceived fair price seemed to provide more reliable reversal signals.
Generally, the MVRV ratio:
- Being at 100% shows that gain is being made on a normal level
- Being above 100% at, let's say, 300% shows that gain is being made in a multiple of 3(that is, 3X)
- Being below 100% shows that loss is being incurred

Predicting Price Trend With MVRV Ratio

Actually, the movement of the price action correlates in a way with the MVRV ratio metric. The MVRV ratio would give us an idea of whether the current price of the asset is above or below the fair price. Usually, the scaling ranges from 0 and goes above 300. Consequently, we can understand that:
An MVRV ratio above, let's say, 300 could signify that the asset is currently trading above its fair value. This means that the asset is becoming overvalued and is likely to experience a downward price correction. Normally, this would be due to selling pressure coming in as a result of buyers not willing to pay higher prices for the asset.
An MVRV ratio that is way extensive in a very negative region could signify that the asset is currently trading below its fair value. This means that the asset is becoming undervalued and is likely to experience an upward price correction. Normally, this will be due to the buying pressure coming in as a result of sellers not willing to exchange at lower prices for the asset.
From the ongoing discussion it is clear that the MVRV ratio can be used to determine whether someone should enter a trading position. However, it is mostly more reliable and useful in taking trading positions for the long term. Clearly, it follows the principle of demand and supply. As a result, it anticipates areas of possible selling pressure or buying pressure.
MVRV ratio above and below fair price
By looking at the crypto asset chart above you can see that once the MVRV ratio begins to indicate that an asset has been overpriced as a result of being in an overvalued region, a downward reversal soon follows.
Conversely, when the asset was below its fair price in an underpriced region as indicated by the MVRV ratio, an upward reversal soon followed. So, the MVRV ratio can be useful in determining when to take trade positions and in what direction to go. However, they may not tell you the exact point or time of reversal. Hence, confirmatory indicators are needed to inform exact times for entry or exit.

MVRV Upper Threshold: What It Signifies And Its Reliability

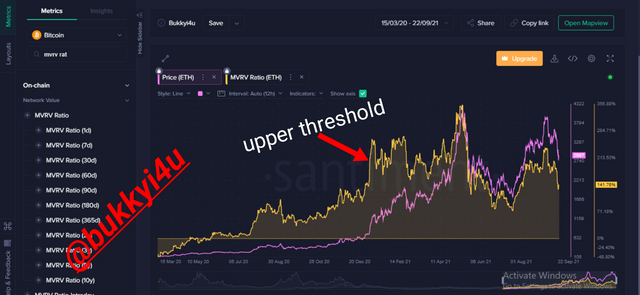
The crest or upper threshold of the MVRV signifies the resistance level. Consequently, when the trend begins to move above the upper threshold it signifies that resistance may have just been broken. Obviously, this is not a good time to enter a long position. Instead, we should allow our open long positions to bring in more profit before closing them. Equally, we can enter short here.
MVRV upper threshold
Nevertheless, in a market that is generally bullish, the upper threshold may not be very reliable as to determine whether a reversal would occur. At such times we may just witness slight declines in the prices of assets. So, the upper threshold cannot actually be interpreted as a potential downwards reversal signal.

MVRV Lower Threshold: What It Signifies And Its Reliability

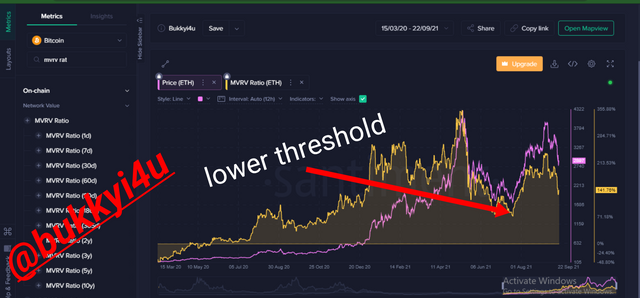
The trough or lower threshold of the MVRV signifies the support levels. Consequently, when the trend begins to move below the lower threshold it can mean that support may have just been broken. Obviously, this is not a good time to enter a short position. Instead, we should allow our open short positions to bring in more profit before closing them. Equally, we can enter long after confirming with other indicators the likelihood of a potential reversal.
MVRV lower threshold
However, by looking at the crypto asset chart above you can discover that the lower threshold seems to provide more reliable potential upward reversal signals. While the upper threshold may only experience slight price declines, the lower threshold seems to more reliably or accurately predict potential price increment in a downtrending market.

Market Phases: Realized Capitalization And Steep Downward Slope

Normally, in a very strong bullish market it is likely that a steep gradient would be observed in the realised cap. This is due to the fact that people who had bought at much relatively lower prices are now selling at very high prices with very high margins of return. The reverse could also be the case in a cyclic or very strongly downtrending market.
This would happen if people who had bought at much higher prices begin to sell at very low prices. This will produce a steep downward slope in the realised cap. However, this is only possible in theory since someone buying at a very high price can not sell at such low prices even if the market goes against him. But then it could be possible for novice crypto hodlers who may be afraid that they could eventually lose all their money in the ongoing downtrend and begin to panic sell very much down the line.
Nevertheless, the few who may decide to sell very much down the line may not be enough to cause a steep downward slope since the majority of crypto hodlers may not be following the same step. In the case of an upward steep gradient, the majority are selling off. So, practically a steep downward slope cannot be produced.
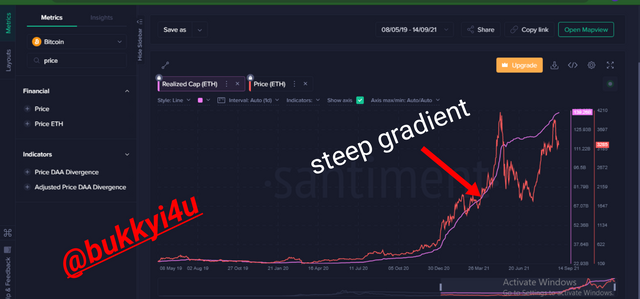
steep gradient of the realized cap
You will notice from the crypto chart above that even when there is a strong bearish market, a steep downward slope is not produced as in the case of a steep upward slope being produced in the uptrend.

CONCLUSION

Some on-chain metrics can be very crucial in giving us a sense of the likely trend of price action of any asset. Usually, you would use such important metrics as the realised capitalisation to determine whether gains are now being made or losses are being incurred by spending UTXO that had been previously left unspent. The market capitalisation is equally useful in helping us estimate the current market value of any asset.
This would help us to understand whether such an asset is generally accepted as it delivers the opinion of public investors by telling us whether it is a low capital asset, mid capital asset or large capital asset. This can be useful in determining the potential long-term prospects of investing in such a crypto asset.
Generally, the Market-Value-to-Realised-Value(MVRV) ratio can help us determine whether an asset is being spent in gain or in loss. An increasing MVRV ratio signifies that gain is being made while a decreasing MVRV ratio which goes below 100% shows that losses are being incurred. Extreme spikes of the MVRV ratio can also be instrumental in predicting potential reversals, especially with extreme downward spikes.

(Unless otherwise indicated all screenshots are taken from santiment)
