Edited with canva

(1) How do you calculate Relative Unrealized Profit/Loss & SOPR? Examples?

Usually, when an asset is purchased, the investor could decide to keep it for sometime before selling it off. This means that the investor could decide to sell it at a later date at a price which could either be higher or even lower than that at which he had purchased it. The price of an asset the last time it was moved if it is a UTXO asset is usually called its realised price.
Be that as it may, the price of an asset currently could be higher than the price at which it was the last time it was moved. This means that the asset has gathered some floating profit. Conversely, the price of the asset at the moment could even be lower than the price it was the last time it was moved. This would mean that the asset now has a floating loss.
Anytime the price at which a UTXO was exchanged the last time it was moved is multiplied with the circulating supply of such an asset a value known as the realised cap is obtained. It is important to note the concept of realised price because UTXO depends on it and not market price for the calculation of its profit or loss.
Normally, what you would have to do is to subtract the realised price from the current price at which the UTXO is trading at any point in time. You would then add up all the UTXOs and weigh it in light of the current total supply (that is, the total circulating supply of an asset).
When we have added all the UTXOs after calculating their prospective realised prices and Wade with the circulating supply of the asset we would discover that we would either be in gain whereby an unrealized profit or a positive value has been achieved or an "unrealized loss* or a negative value, which shows that we are losing.
By subtracting the realised price from the current price, we would obtain the unrealized profit/loss. Then you can wear the unrealized profit in relation to the prevailing market cap of the accent and this gives an idea known as the relative unrealised profit/loss.
So, generally:
- When the realised price is subtracted from the current price and we get a positive value it means that there is unrealised profit
*When the realised price is subtracted from the current price and we get a negative value that means that there is an unrealised or loss
Mathematically:-
Unrealized profit/loss = Market Cap - Realized Cap
Relative Unrealized profit/loss (RUPL) = Market Cap - Realized Cap / Market Cap
OR
Relative Unrealized profit/loss (RUPL) = Unrealized profit/loss / Market Cap
Example:-
Ethereum has three circulating UTXO, namely ETH-X, ETH-Y and ETH-Z. ETH-X has 3 Ethereum, ETH-Y has 1 Ethereum and ETH-Z has 5 Ethereum. Realized Cap of ETH-X is $200, ETH-Y is $290 and ETH-Z is $205. Currently, Ethereum trades at $3000. Calculate RUPL
Solution:-
Circulating Supply of ETH = 3
Current Price of ETH = $3,000
So, ETH market cap = (3+1+5) X $3,000
= 9 X $3000
= $27,000
Realized Cap = (3 X 200) + (1X 290) + (5X205)
= 600 + 290 + 1025
= $1,915
So, RUPL = $27,000 - $1,915 / $27,000
= 25,085/27000
= 0.929074 or approximately 92.9%

SOPR
The SOPR which is the short form for Spent Output Profit/Loss refers to the ratio of the price at which UTXO was sold to the price at which the UTXO was bought. This ratio usually gives an idea of either gains or losses incurred by moving a UTXO in a recent time when compared to the previous or earlier time it was left unspent or when it was last moved. It is used for identifying local tops and bottoms - that is, the tops and bottoms in the current trend of the price action.
Mathematically:
SOPR = Price Sold / Price Paid
Generally:
- An SOPR value greater than 1 presents gain
- An SOPR value less than 1 represents loss
Example
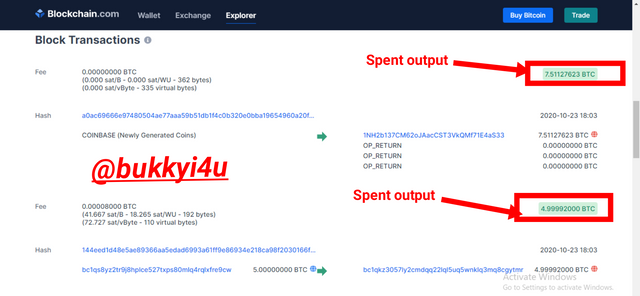
Let's take an example from the Bitcoin block 653982 which was mined on the 23rd of October 2020 at 6.03 p.m. GMT + 1 by Poolin.

Source
The price of Bitcoin on the day the block was mined was around $13,000.
Assuming that the spent outputs were sold today at the price of $52,000
Price Sold = (7.511 + 4.9999) X $13,000 = $162,641.7
Price Paid = (7.511 + 4.9999) X $52,000 = $650,566.8
SOPR = 650,566.8/162,641.7 = 4
The SOPR being above 1 and as high as 4 shows that a lot of gains have been made by selling the coins at a higher price today than when they had been purchased about a year ago.

How are they different from MVRV Ratio?
It is understandable that the three concepts are technical indicators of price action. However, we should note the vital differences among them. Thus:-
- The RUPL subtracts the realised cap from the market cap and then divides the value obtained by the market cap as a way of expressing the relationship
- SOPR is the dividend obtained when the most recent realised cap of an asset is divided by its earlier realised cap
- MVRV on its own simply refers to the dividend obtained when the market cap is divided by the realised cap
Usually, all the values are calculated for the same period of time.

(2) Consider the on-chain metrics-- Relative Unrealized Profit/Loss & SOPR, from any reliable source(Santiment, Glassnode, LookintoBitcoin, Coinmetrics, etc), and create a fundamental analysis model for any UTXO based crypto, e.g. BTC, LTC [create a model to identify the cycle top & bottom and/or local top & bottom] and determine the price trend/predict the market (or correlate the data with the price trend)w.r.t. the on-chain metrics? Examples/Analysis/Screenshot?

To effectively utilise the RUPL, it is instrumental to understand its basic interpretation. Thus:
The value of the RUPL going above 75% or 0.75 reading indicates a cycle top which could be a historic top and a pointer to a soon-to-occur profit-taking
The value of the RUPL going below 0% or the 0.00 reading can indicate an accumulation zone which could be a historic bottom
Breaking the chart into different phases helps the RUPL to tell us the stage of the market where we could be
Usually, when the readings are between 0% and 75% we could be in either a bullish or bearish cycle but extreme readings would indicate historic tops or bottoms
Observation:-

Source
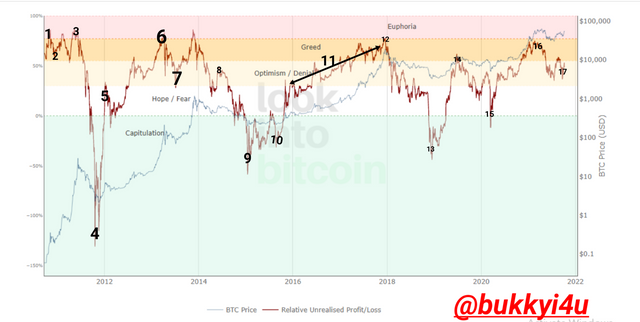
- On 5th November 2010 the reading was 81% and the price of BTC was $0.24
- On 10th December 2010 reading was 57% and the price of BTC was $0.19
- Fast forward to 10th June, 2011 the reading was 82% and the price of BTC was $24.67
- On 20th October 2011 the reading was around - 127% and the price of BTC was $2.31
- On 18th January 2012 the reading was 20% and the price of BTC $5.98
- On the 7th of April 2013 the reading was 81% and the price of BTC was $152.79
- On the 11th of July 2013 the reading was 42% and the price of BTC was $86.41
- On the 31st of May 2014 the reading was 46% and the price of BTC was $61 6.81
- On the 21st of January 2015 the reading was - 44% and the price of BTC was $215.91
- On the 21st of August 2015 the reading was -21% and the price of BTC was $235.52
- Between 23rd December 2015 to around 30th November 2017 the reading rose from 32% to as much as 70% and accordingly the price rose from between $442.08 to around $10,458.80
- By 19th December 2017 the reading had reached 75% and the price was around $13,500
- By 18th December 2018 the reading had reached -30% and the price was $3,569.70
- By 21st June 2019 the reading was 52% and the price was $10,103.70
- By 13th March 2020 the reading had gone as low as -3% and the price was $5,461.54
- By 29th March 2021 the reading was 70% and the price was $57,662.00
- As at 5th October 2021 the reading was 49% and the price was around $53,967.00
Analysis:-
In accordance with the numbering my analysis follows below:-
- This level was actually a cycle top and it indicated that the price of the asset was near take profit or was already at a take profit level.
- This point signified a correction as had been expected once price had previously entered a stage of euphoria. This particular stage is a cycle bottom
- The price had picked up steam again and had entered an euphoria stage with all the excitement. This point signifies a cycle top and obviously it is a time for taking profit
- A heavy correction which resulted in a local bottom was created. Those who had failed to take profit of book their gains in the preceding cycle top would be at loss now
- This level was a local top in the ongoing price trend that was just picking up from the sudden downturn
- At this stage price had created another cycle top with an impending correction
- The price correction had resulted to a local bottom being created at this point
- This point signified a local top as price had created a top in the current trend but not in the total trend
- Price had corrected in the meantime and created a local bottom
- Price had gathered little steam but had come down again in the local trend to create another local bottom here
- Price starts with a local top again and continues creating series of local tops until it gets to around 70
- Price had moved from local tops to create a cycle top at this point with an increased price action
- As expected a correction occurs and it seems cycle tops always result in more severe price corrections than the local tops. However, this point is just a local top in a correcting market that portends greater dangers of correction. The correction continues into as low as - 44%(creating a cycle bottom there).
- The cycle bottom resulted in another upwards correction of price which creates a local top here again
- This is a cycle bottom and have struggled for area of very strong accumulation
- This is a local top which shows that accumulation was gradually coming to a point of take profit
- This is the current phase of the market where the local top is being created. This shows that accumulation is ongoing and take profit should be expected if price goes above 70%
Observation:-
Generally, I can infer from the narratives of the foregoing that:-
- Cycle tops always result in very severe price corrections that result in cycle bottoms most of the time
- Once cycle bottoms are created prices of intend to correct from there also and return in an upwards direction
- Price would often create local tops and bottoms before continuing to extreme spikes in the form of cycle tops or bottoms as the market corrects itself
- The cycle tops are areas of strong distribution where the buyers are losing control as selling pressure comes in with greater force
- Cycle bottoms are areas of strong accumulation where the buyers are coming in to support the market upwards
- Local bottoms are equal areas of accumulation and could often be created as an area of price correction in an uptrend. However, the accumulation at this place is not as strong as that of the local bottom
- Local tops are also areas of distribution that are not as strong as the cycle tops
- The various phases of capitalisation, hope or fear, optimism/denial, greed and euphoria are all important human emotions that are helpful in understanding what is happening at these different places calibrated in percentages.
Spent Output Price Ratio (SOPR)
When making use of this ratio we should understand that:
- A local top is formed anytime it goes above 1
- A local bottom is formed anytime it goes below 1
- The indicator coming close to or going a little bit above 1 in a bullish run indicates a buy signal
- The indicator approaching 1 in a bearish run indicate a sell signal
Observation

Source
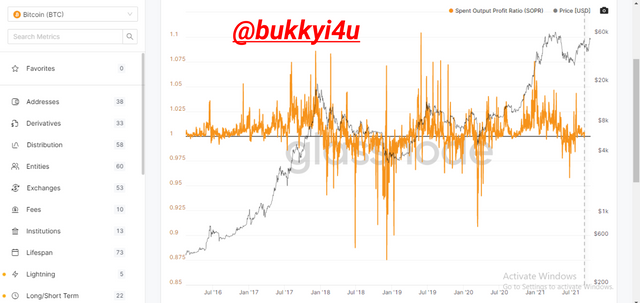
In the price chart above which runs from July 2016 to July 2021 the price starts from somewhere a little bit above 1 where it created local bottoms with the price of the asset oscillating around $410 in July 2016. From there the indicator rose to create a local top as it rose above 1.02212 with the price of asset rising above $670 in June 2016.
It continues by creating lower local tops up to around February 2017 with the indicator around 1.00866 and the price of the asset around $1155.39. As the indicator creates higher local tops up to 1.062 in July 2017 the price of the asset had reached as high as $2861. The indicator reached as high as 1.0 to 6 in December 2017 and the price of the handset has risen up to $11625. From there the indicator begins to come lower to create quite extensive lower spikes below 1 at around 0.875 in December 2018 and this coincided with an area of local bottom where prices had tumbled to as low as $3800.
Again, price picks up and goes as high as $8,600 as the indicator moves higher to 1.017 in May 2019. From there the indicator came no again to around 1 and some of these times the price just oscillated around $7000 before the indicator continued and went as high as 1.037 and price at this point is actually in a very high bullish run of up to $28,000. Surprisingly, around April 2021 the indicator was just somewhere around 1.016 and the price of BTC was already as high as $59000. At the moment the indicator is around 1.002 and the price of BTC is around $46,000.
Analysis And Prediction
It can be noticed that usually whenever the indicator goes above 1 and surges higher to create local tops the price follows it in an upward direction. Equally, when the indicator goes below 1, the price follows it in a downward direction. Actually, the indicator does not control the price, it only tells us whether the prices are in a downtrend or an uptrend at the current dispensation.
At the present moment where the indicator is seen to be around 1.0038 and the price of BTC is trading around $49,000 it is expected that buyers can come in now since the indicator going close to 1 in a bullish run gives a buy signal. S

(3) Write down the specific use of Relative Unrealized Profit/Loss(RUPL), SOPR, and MVRV in the context of identifying top & bottom?

As much as the three are all technical indicators of price action, there are some very specific uses of each when considered in the context of identifying tops and bottoms. Thus:
- The RUPL serves to identify cycle tops and bottoms by considering the overall or total trend history of an asset
- The SOPR only serves to identify local tops or bottoms by considering the current trend
- The MVRV ratio serves to identify cycle tops and bottoms on a longer time frame or local tops and bottoms on a shorter time frame but is usually more reliable with a longer time frame

CONCLUSION

The relative unrealized profit/loss is an indicator which works by telling us the gain or loss that could be incurred on all currently circulating assets of a UTXO coin if they were to be spent at the prevailing price in the market. It is yet unrealised since it is just a floating gain or loss.
The Spent Output Profit/Loss (SOPR) tells us the gain or loss that can be made or that was made by moving a coin at two different periods. Hence, you would usually compare the price at which a coin was most recently moved to the price at which it was earlier moved. A ratio which is greater than 1 indicates gain while a ratio less than 1 indicates loss.
While the unrealized profit/loss can be used to identify cycle tops and cycle bottoms, SOPR only identifies local tops and bottoms. The MVRV identifies both cycle tops and bottoms in longer time frames and local tops and bottoms in shorter time frame but would always be more reliable when used in longer time frames.
