INTRODUCTION
The Ichimoku Cloud as a method for technical analysis of price charts was created in the late 1960s by a journalist from Japan called Goichi Hosoda. This technical chart tool identifies important areas of support and resistance. Also, it shows other information like price momentum and direction of trend. More than the usual candlestick chart, it contains more data points, hence, increasing how accurately price movements can be forecast.
Actually, this method or indicator comes with a lot of information and lines that can look complicated especially for traders who are not yet experienced. Nevertheless, once the interpretation of the cloud is mastered, it becomes a veritable tool for crypto trading. Normally, the indicator comprises the Tenkan-Sen line, the Kijun-Sen line, the Senkou Span A, the Senkou Span B and the Chikou Span. In our study today we would be majorly looking at the Kumo Cloud which is formed by a corporation between the Senkou Span A and Senkou Span B.
Discuss your understanding of Kumo, as well as its two lines.
The Kumo Cloud of the Ichimoku Kinko Hyo indicator refers to the space that exists in between the Senkou Span A and the Senkou Span B. The edges of the Cloud are important in identifying future potential support and resistance levels as well as in identifying the current support and resistance levels. The shape of the Kumo Cloud as well as its height changes in relation to price movements. Actually, the height portrays volatility in price movements. Larger movements in market price would produce thicker clouds which represent areas of stronger resistance and support. It is easier for price movements to break through the thinner clouds. This is due to the fact that they only offer weak resistance and support to prices.
As a general rule, the Senkou Span A being above the Senkou Span B represents bullish markets. The reverse is also true as the Senkou Span B being above the Senkou Span A represents a bearish market. Normally, traders will be on the lookout for Kumo Twists whereby the Senkou Span A and Senkou Span B exchange their places signalling a potential reversal in trend. Apart from their thickness, it is also possible to determine the strength of the Kumo Cloud through its angle. Hence, the market is bullish when it is angled upwards and bearish when it is downwards. Kumo Shadows are formed when the clouds come behind the price.
The Kumo Cloud is formed by two lines namely the Senkou Span A (or the Leading Span A) and the Senkou Span B(or Leading Span B).
THE SENKOU SPAN A
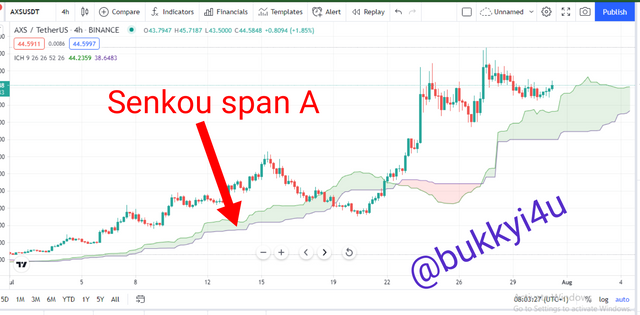
The Senkou Span A is a line which is useful in the measurement of price momentum. Again, it is important in giving trading signals based on levels of support and resistance. It works together with the Senkou Span B to produce the Kumo Cloud. Actually, it is equally referred to as Leading Span A based on the fact that it is calculated in 26 periods and plotted into the future. Hence, it can indicate possible areas of resistance and support down the line.
Calculating The Senkou Span A
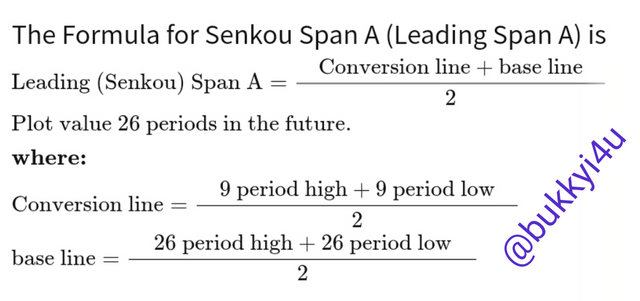
Mathematically, the Senkou Span A can be calculated from the formula below:
source
You can arrive at this calculation by:
- Finding the high and the low over the list of previous nine periods and calculating the conversion line with it
- Finding the high and the low over the last or previous 26 periods to calculate the base line
- Using the conversion and base lines to calculate the Senkou Span A
- Plotting into the future the values for the Senkou Span A 26 periods
How To Interpret The Senkou Span A
Actually, the Senkou Span A works in conjunction with the Senkou Span B to form the Kumo Cloud. The Senkou Span A is faster than the Senkou Span B based on the fact that it - that is, the Senkou Span A - is calculated with data from 26 periods and 9 periods. Therefore, it reacts much quicker to changes in price.
Anytime the Senkou Span A line is at the top in the Cloud the market is considered to be bullish due to the fact that the movement of the price in the shorter-term is above the midpoint of the price in the longer term. Any crossovers between the Senkou Span A and Senkou Span B could mean a change in the trend from bullish to bearish or vice versa.
THE SENKOU SPAN B
The Senkou Span B in conjunction with the Senkou Span A form the Kumo Cloud. Actually, it is called a cloud due to the fact that the area in between the two lines are always colored in order to make them appear more noticeable. Also, it is called the Leading Span B. Although it makes use of historical data it is referred to as leading due to the fact that its values are plotted into the future by 26 periods.
Calculating The Senkou Span B
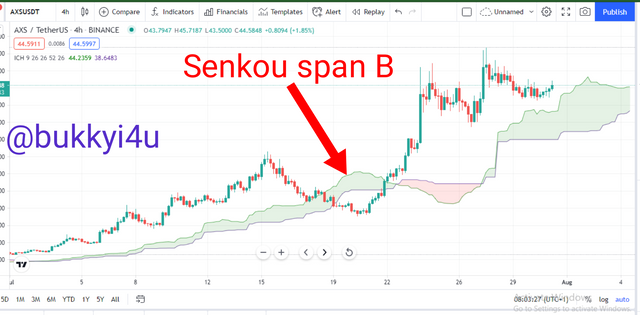
The calculation can be done by:
- Finding the high price in the last or previous 52 periods
- Finding the low price in the last or previous 52 periods
- Adding the high and low prices together and dividing by 2
- Plotting the values into the future by 26 periods
How To Interpret The Senkou Span B
Actually, the Senkou Span B is considered to be much slower between the two lines due to the fact that its calculation is based on data from the highs and lows of 52 periods. Whenever the Senkou Span B is at the top of the cloud it is considered a bearish trend. This is due to the fact that the short term prices have gone below the midpoint price of the longer-term. Actually, the Senkou Span Lines are providing the midpoint of the range of prices due to the fact that the high and low prices are added and divided by two.

What is the relationship between this cloud and the price movement? And how do you determine resistance and support levels using Kumo?
The Kumo Cloud in relation to price movements can be significant in two ways. First, whenever the price movement is large the Cloud usually forms thicker. In this way, areas of stronger support and resistance are created. This indicates stronger momentum in the market as prices are moving with higher rates of velocity. In this scenario there is a high potential to get large gains in the short-term. However, there is also high potential for a great loss in the short-term.
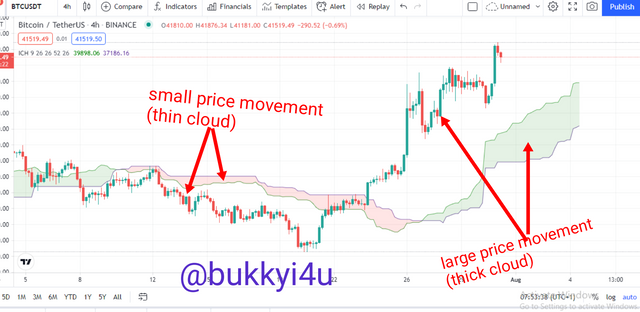
Furthermore, the Kumo Cloud can be significant in relation to price movement from the interpretation of its height. The height of the Cloud represents the extent of volatility in market price movements. Generally, thinner clouds represent levels of resistance and support that can be seen as being weak. In such times it is possible for prices to pierce or go through the support or resistance levels more easily.
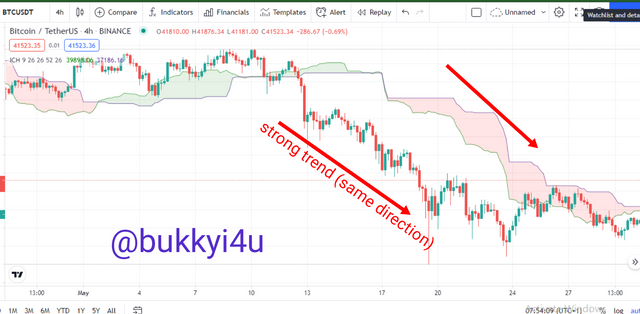
Again, there is a relation between the direction of the Cloud and the price action. In this case, whenever the Cloud moves in the same direction as the price it signals strong trends. In an uptrend the tops of the Cloud would be moving up while in a downtrend the bottom of the cloud will be moving down - both according to the different movements of the price.
SUPPORT AND RESISTANCE LEVELS FROM KUMO CLOUDS
You can use the Kumo Cloud to identify key resistance and support levels. Normally, from the shape of the Kumo you can determine how strong a support or resistance level is. There are two lines that bound the Kumo Cloud. In using Kumo to identify areas of support and resistance you should first determine whether it is bulky or flat or whether it is forming bottoms and tops. Once you have identified flat bottoms and tops to be in place, draw a trend line across the Leading or Senkou Span A - this will be for flat tops - or to go across the Leading or Senkou Span B - in the case of flat bottoms. Tracing this properly would help you to find the places where the price seems to be bouncing off a sort of support level.
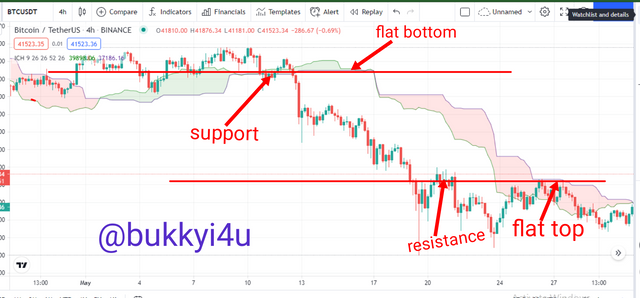
Also, it could help to identify the places where price seems to be rejected in a sort of resistance level. In this case, the resistance and support levels appeared to have been delineated by the border lines of the Cloud. Usually, traders can make use of this trend line of support and resistance to initiate trades. In doing this you should allow the price to evolve over time so that you can use the trendline to either trade another bounce off the support - for the case of a top trend line - on the Cloud (that is, if it were to hold) in the future or to use the same trend line to trade another resistance level - assuming there were to be a switch or role reversal or breakout in the future.

How and why is the twist formed? And once we've "seen" the twist, how do we use it in our trading?
Usually, Kumo Twists occur when the Senkou Span A and the Senkou Span B cross each other. Actually, it appears like a twist because there is a switch between the colours of the Cloud. A bullish Kumo Twist occurs in a case where the Senkou Span A crosses above the Senkou Span B from below it. Also, the reverse is the case for a Kumo Twist in a bearish pattern in which case the Senkou Span B crosses the Senkou Span A from beneath. Normally, the Twist is a very early sign of a potential change in the trend in the future. Usually, the twist would occur as a result of weakening momentum or the current trend becoming weaker thereby giving way for a potential reversal.
For the fact that the Kumo is shifted in time into the future by 26 periods means that the Kumo Twist signal takes place ahead of the price action by the same 26 periods. Consequently it is important before trading Twists to determine the general trend from a higher time frame and only taking signals that are in line with that trend on the lower time frame for implementation.
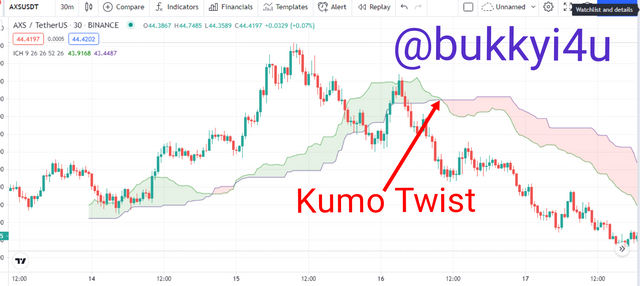
In trading the Kumo Twist you should take a long position whenever the future Kumo Cloud changes from being bearish to bullish. Conversely you should undertake a short position when it changes from bullish to bearish. However, the Twist becomes more effective depending on the location of the price at the moment in relation to the Cloud. If the Twist occurs on the bullish side when the price is trading above the Kumo, it is a strong bullish signal. If the Twist occurs when the price is trading below the Kumo it is considered to be a rather weak bullish signal. Again, if the twist takes place when the prices are trading within the cloud it is a neutral bullish signal. You should normally buy at the beginning of the Twist to sell far up for a strong bullish signal.
For a sell position, if the twist should occur below the Cloud, it is a strong bearish signal; above the Kumo, it is weak and neutral when it occurs within the Kumo. In the case of a sell position, you can use the Base line as your stop loss level.

What is the Ichimoku trend confirmation strategy with the cloud (Kumo)? And what are the signals that detect a trend reversal?
The very first way to confirm and ensure that trend is in place using the Kumo Cloud is to ensure that both the Senkou Span A and the Senkou Span B are both trending. This is due to the fact that the Kumo Cloud is actually a trend following indicator. In such places it is not unsafe to participate in the market as a trader. For long trades you should always ensure that both Senkou Spans are rising.
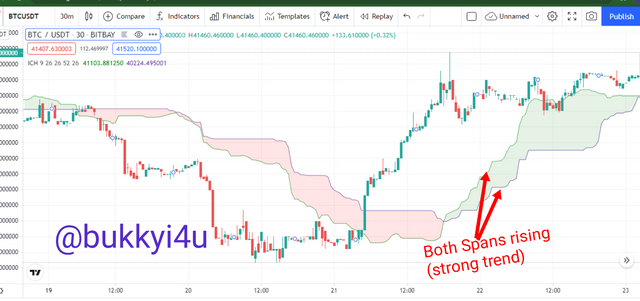
On the flip side, you should ensure that both Senkou Spans are falling for short trades. This is the best way to confirm a trend with the cloud. Another way to confirm that a trend would be persistent is for the price action to break through the Kumo Cloud either to the upside or to the downside after a Twist. This would even be more effective if the cloud had been thick prior to the break through of the price action.
The very first indication of the end of a trend with the Kumo Cloud is the Kumo Twist. Usually, with the Kumo Twist comes a new trending or a new ranging market. On a different level, the price could enter the Kumo Cloud and the Chikou Span can be directed in line with the renewed price action that has penetrated the Cloud to give further confirmation. Again, a trend can be confirmed in a situation whereby the Kumo Cloud changes its orientation from either downwards to upwards or vice versa. These are some of the known signals to detect trend reversal with the Kumo Cloud.

Explain the trading strategy using the cloud and the chikou span together
The Chikou Splan is the simplest component of the Ichimoku indicator but it can be a very powerful trading component when combined with the Kumo Cloud. In fact, most of the trading strategies that take place in the Ichimoku should take into account the Chikou Span. The Chikou Span is plotted by taking the current price 26 periods backwards. One of the most important uses of the Chikou Span is as a momentum indicator. Basically, if the Chikou Span is above the current price trend then the price can be said to be in a bullish trend.
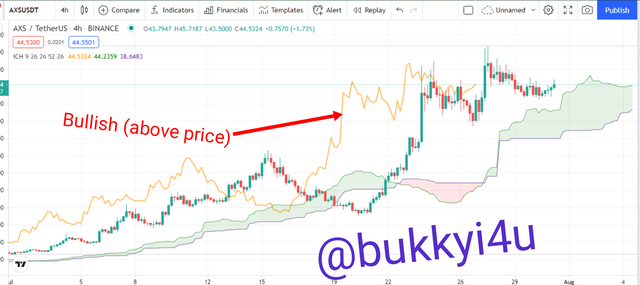
This would be more reinforced if it is happening above the Kumo Cloud. In such a situation you can ride the trend by buying at the lower end and selling at the higher end. On the other hand if the Chikou Span is below price then a bearish trend is in place. This will be more reinforced if it is happening below the Kumo Cloud. In such a situation you can short the market and ride the bearish trend by buying at the higher end and selling at the lower end of the trend.
Anytime the Chikou Span is in a region away from the price action and the price movement is in line with the Span, then it is easier to predict that the price action is more likely to continue in that direction. In this situation if the price tries to reverse the Chikou Span would meet a resistance when trying to cross the line of the price action. This is why a continuation is more likely to be in place. The Chikou Span being in an open space when a particular trend emerges further reinforces the likelihood of a strong trend in that particular direction since the Chikou Span would just indicate momentum along that direction, also.
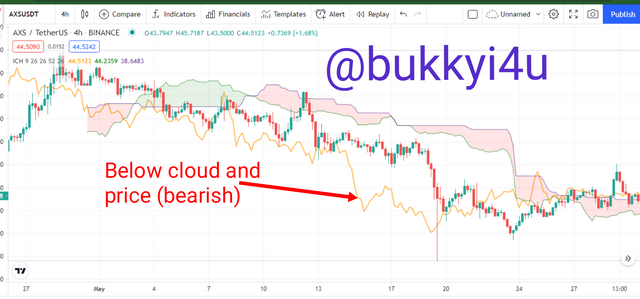
The price crossing below the Chikou Span represents a bullish signal but if this occurs underneath the Kumo Cloud, it may be a weak bullish signal. Again, if the price crosses above the Chikou Span it represents a bearish trend but this may not be a strong bearish trend if it is happening above the Kumo Cloud - unless it breaks through the Cloud and continues further down. Another important sign is the divergence between the Chikou Span and the line of action of the price movement - the more the divergence, the more the likelihood of price experiencing a reversal as a result of either being overbought or oversold.

Explain the use of the Ichimoku indicator for the scalping trading strategy.
The Ichimoku Cloud combines a set of technical indicator tools to show momentum, trend and also support and resistance levels of the price action. In the trading strategy I will describe I am going to filter out the noise by disabling the elements I do not need and leaving the Kumo Cloud itself (which I need).
Besides the Kumo Cloud I would use two Exponential Moving Averages - the 50 periods and 100 periods EMA. The two EMA lines I have added would help me to identify my entry points.
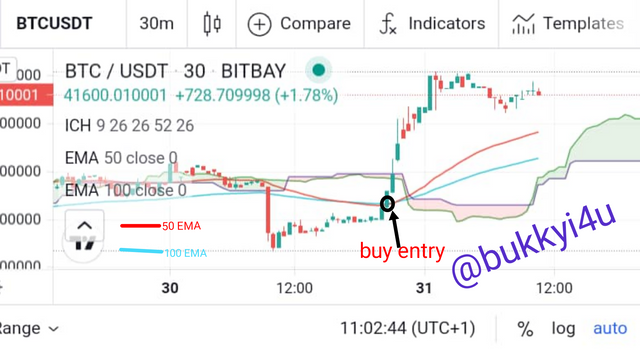
In this strategy I am going to buy anytime the 50 periods EMA crosses above the 100 periods EMA. However, the price must be above the Kumo Cloud. My entry point would be the top of the crossing candle. I would set my take profit level in the direction of my desired trend in a 1:1 RR (Risk:Reward) ratio with my stop loss- that is to say, I would use the same points above for my take profit as I would use below the entry point for my stop loss. Accordingly, I will set my stop loss below the cross in a 1:1 RR (Risk:Reward) ratio with my take profit.
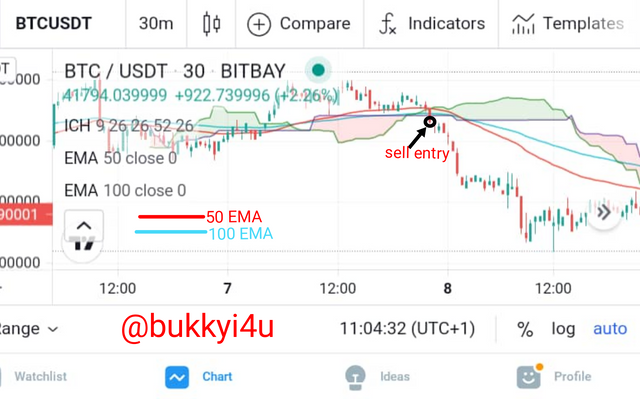
On the flip side, I would make a sell entry anytime the 50 periods EMA crosses below the 100 periods EMA as far as the price action is below the Kumo Cloud. In this case I am going to take my sell entry at the bottom of the crossing candle. I would set my take profit in the direction of my desired trend in a 1:1 RR (Risk:Reward) ratio with my stop loss. My stop loss order is going to be above the crossing in a 1:1 RR (Risk:Reward) ratio with my take profit.
As a general rule of caution, I would only sell or buy whenever the crossover is happening outside of the Kumo Cloud.

CONCLUSION
The use of indicators in the trading of cryptocurrencies can be quite beneficial. In fact, both beginner and professional traders have learnt to combine different indicators for different purposes which can include the following a trend, confirmation of a trend, determination of oversold or overbought regions or even as profit-taking tools. Some indicators can just act as momentum indicators like the MACD or mean reversion indicators like the Bollinger Bands. The Ichimoku Cloud is very important in giving out a combined performance of these tasks including momentum indication, trend-following and support and resistance levels indication.
It has been tested and proven that the Ichimoku Cloud can be very helpful in indicating accurate trading signals. Generally, prices are seen to be trending upwards when it is oscillating above the Cloud and downwards when it is oscillating below the Cloud. You can combine some strategies to use the indicator for swing trades very effectively. Nevertheless, you can still use a combination of the Ichimoku Cloud and EMAs - as I have discovered - to trade it on shorter time frames.

(Unless otherwise indicated, all images are taken from Trading View)

Hello @bukkyi4u,
Thank you for participating in the 5th Week Crypto Course in its third season and for your efforts to complete the suggested tasks, you deserve a 7/10 rating, according to the following scale:
My review :
In general, you did a good job answering the questions directly and clearly, with a laconic analysis of certain points.
You're at risk of plagiarism from multiple sites when you're interpreting the cloud and its two lines. Try writing the definitions using your own words, not paraphrasing.
The rest of the answers were to some extent correct and comprehensive, with some variation in the depth of their analysis.
Thanks again for your effort, and we look forward to reading your next work.
Sincerely,@kouba01
Downvoting a post can decrease pending rewards and make it less visible. Common reasons:
Submit