I feel excited participating in the Week 5 Homework Task given by professor @imagen after the interesting lecture delivered on blockchain platforms and technical analysis of price charts. Having learnt quite a good deal from the lecture I decided to make my submission in attempting all the questions.
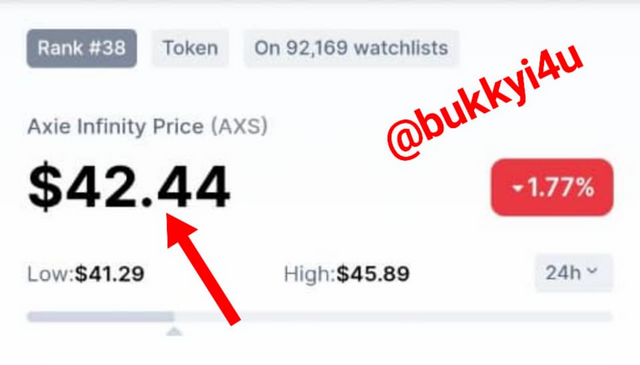
source
Axie Infinity (AXS):Important Statistics
| METRICS | STATISTICS |
|---|---|
| Axie Infinity Price | $42.44 |
| Price Change (24h) | $-1.59 (3.61%) |
| 24h Low / 24h High | $41.29 / $45.89 |
| Trading Volume (24h) | $1,655,629,171.11 |
| Volume / Market Cap | 0.6428 |
| Market Dominance | 0.17% |
| Market Rank | #38 |
| Axie Infinity Market Cap | $2,593,397,638.37 |
| Fully Diluted Market Cap | $11,417,567,365.72 |
Make an investment of $ 12 or more
I was able to make an investment in AXS through three simple steps.
Step 01:
First, I had to transfer some Steem tokens which I had earned on the Steemit blockchain to the Binance trading exchange where I am going to be making the investment.
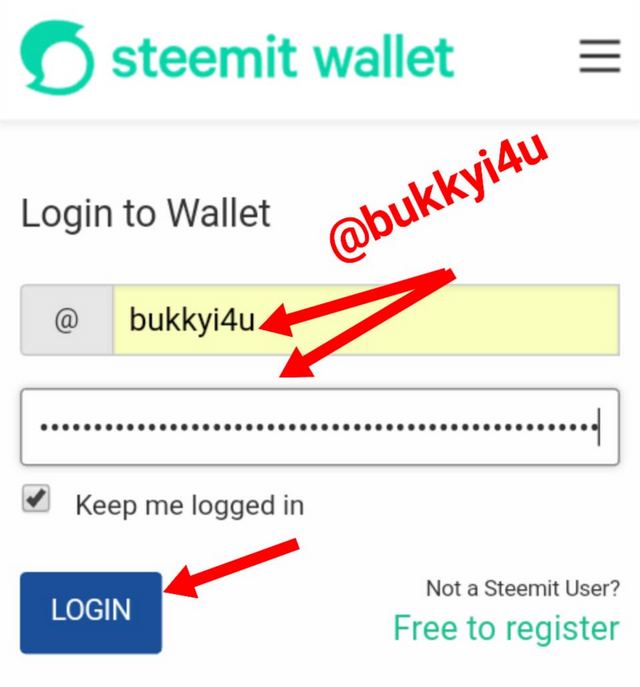
I visited my Steemit Wallet from https://steemitwallet.com/login.html and filled in my Steemit username and Private Active Key. Then, I click login:
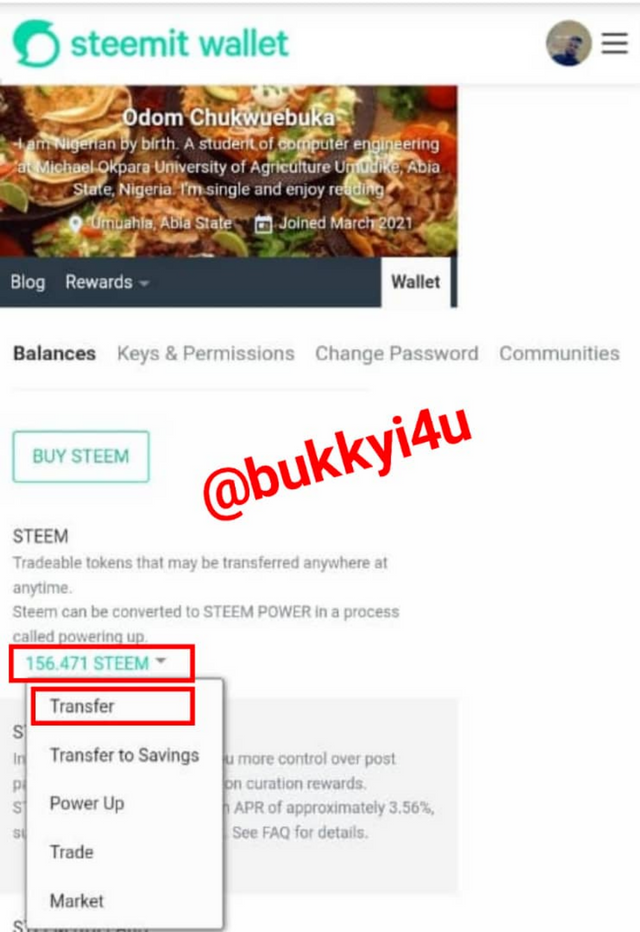
Inside my Steemit Wallet I click on the Steem token I wish to transfer. From the drop-down menu that opens up underneath it I select and click transfer.
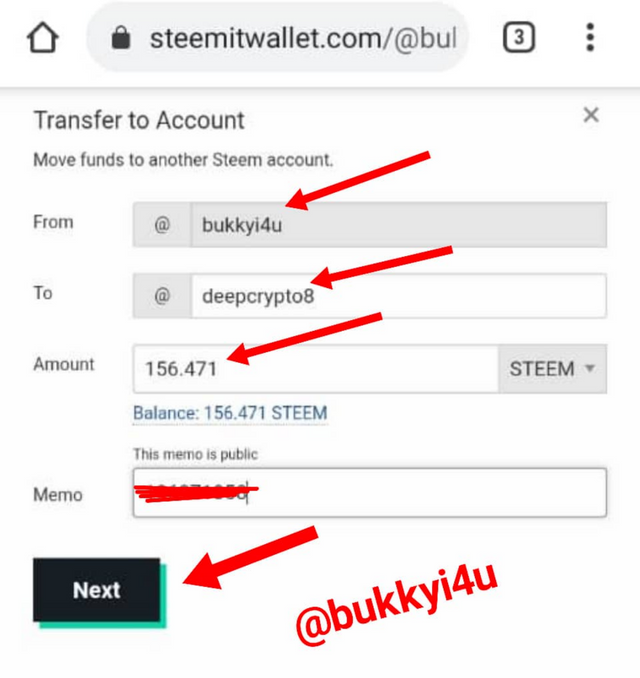
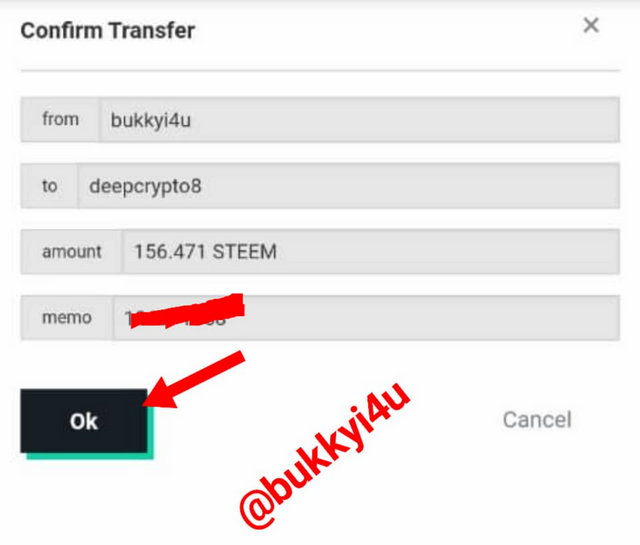
This takes me to the transfer page where I have to input my username, the Binance wallet address (deepcrypto8), the amount I wish to transfer and the transfer memo. Then, I click next to proceed.
On the next page, I click OK to confirm the transaction
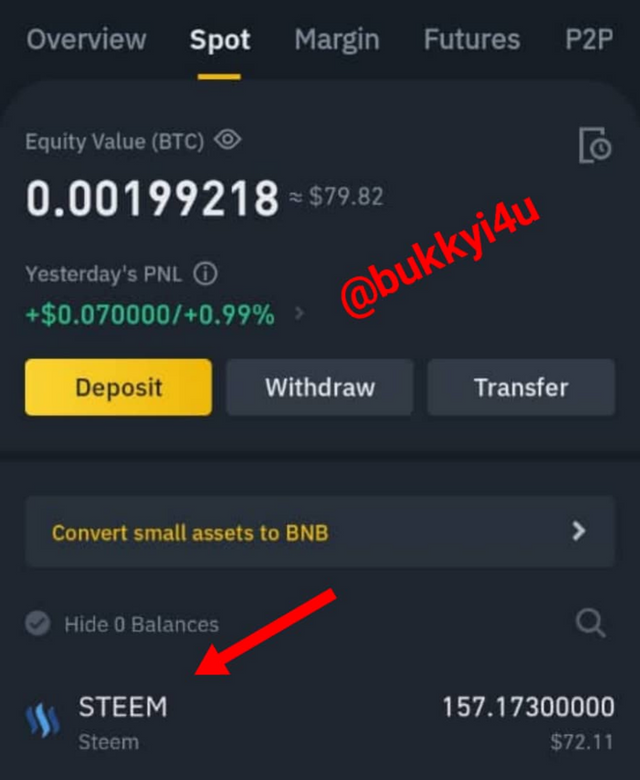
From the screenshot below the Steem token is now received in my Binance Exchange account.
Step 02:
Since there is no direct Steem/AXS pair I have to first exchange my Steem tokens to BTC
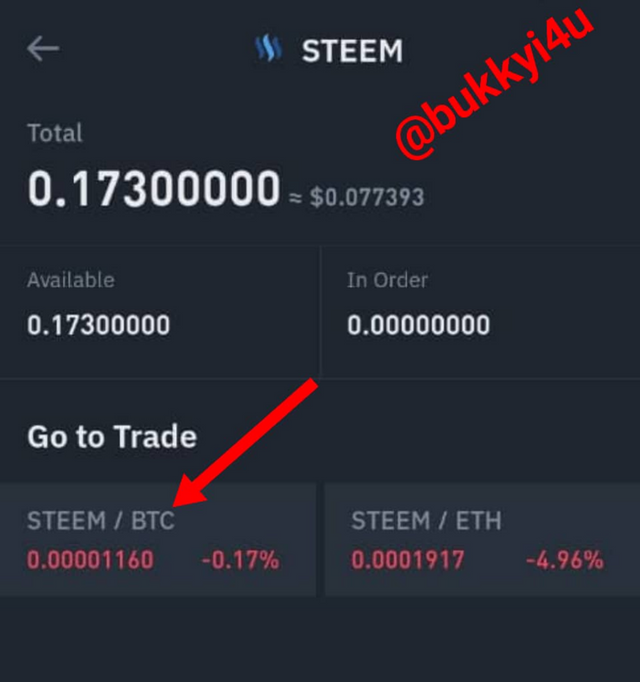
I clicked on the Steem and selected Steem/BTC pair
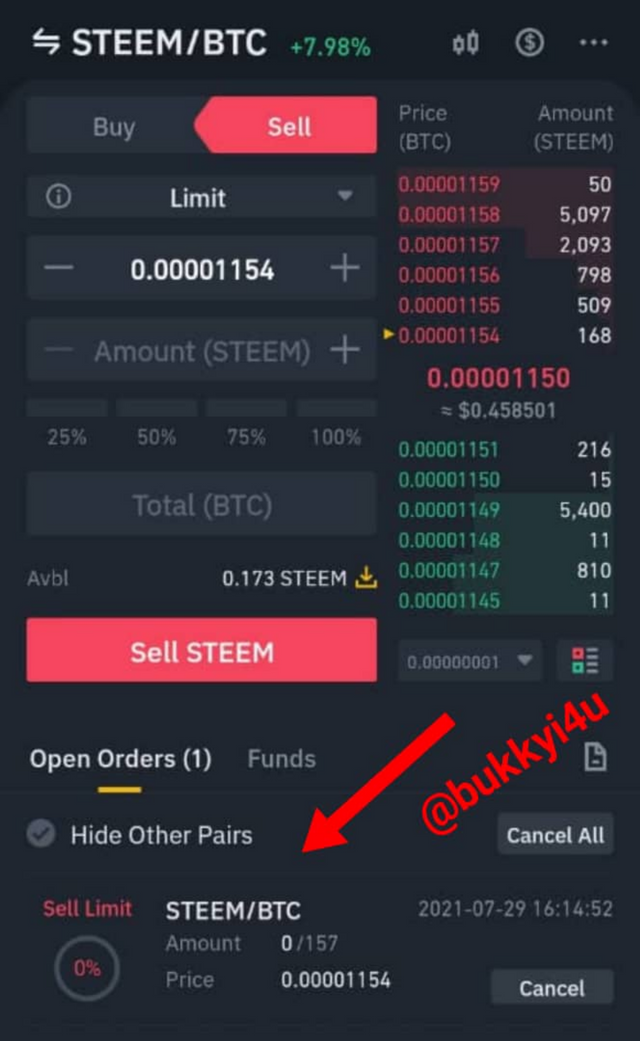
This takes me to the trading portal from where I open a sell order to sell 157 Steem at the price of 0.00001154 satoshi
Step 03:
Having exchanged my Steem to BTC, I will now open a buy order to exchange the BTC to AXS.
Once the limit order has been filled, I select AXS/BTC pair to buy AXS from the BTC balance
Then, I open a buy order to purchase 1 AXS at the price of 0.00105300 satoshi.
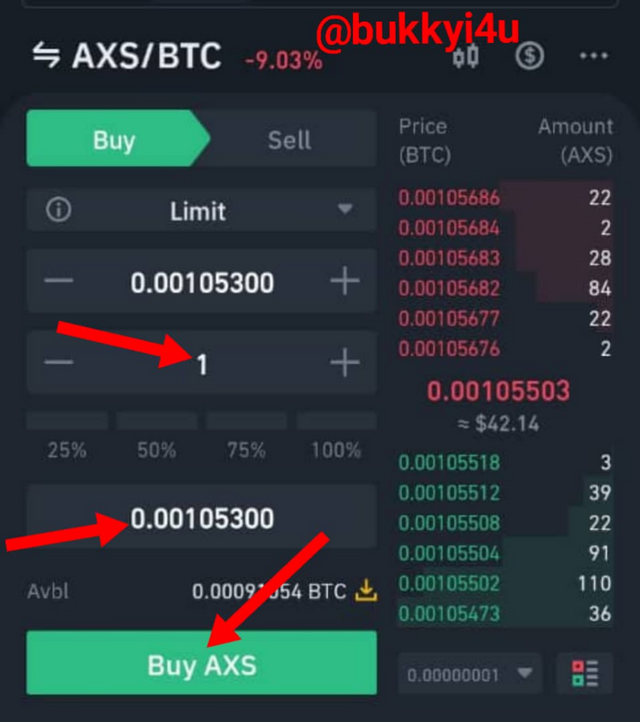
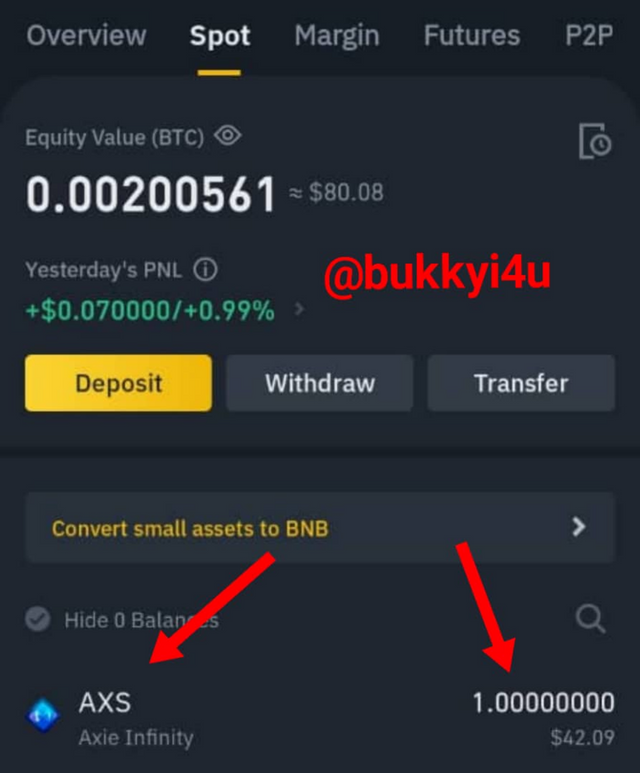
Once the order is filled, it displays in my Binance exchange wallet as a held investment as shown below:
Why did you choose this cryptocurrency?
I have a very strong reason for choosing Axie Infinity for an investment. To start with, it has shown a quite remarkable upwards price trajectory. As at June 15, 2021 its trading price was at $4.45 but had risen to $28.61 by July 2021. At present, its price is at $42.47. This shows a remarkable strength in the growth of its price thereby making it a worthy investment for financial benefits.
Also, this particular coin has an important use case of introducing gaming into cryptocurrency thereby making it fun and interesting to the masses. This concept seems to be gaining a lot of popularity and acceptance. Hence, it, obviously, appears like a worthwhile investment due to possible large-scale adoption and participation even in the near future and beyond.
What is its Market Capitalization?
From the table of important statistics I have drawn above, the current market capitalization of Axie Infinity stands at $2,593,397,638.37. It falls within the mid capitalisations since its value is between $1 billion and $10 billion.
The market capitalization refers to the product of the total number of coins that are currently in circulation and the current trading price of the asset. This shows that the company is quite strong and has a large market and worth behind it.
What is it position in the cryptoasset rankings?
Currently it ranks number 38 on coinmarketcap. This places it on the first page of the cryptocurrency tracking site and among the first or top 50 cryptocurrency coins at the moment.
What is the objective of the project behind this coin?
The main objective behind the mechanism described in the white paper of the project of the Axie Infinity, which is a gaming protocol, is to reward the game players who are interacting with Axie Infinity while equally giving them incentives that would make them hold on to their Axie Infinity tokens in order to be able to claim additional rewards. Again, it aims at decentralizing the governance and ownership of Axie Infinity.
Who founded this coin?
This cryptocurrency project was founded in the year 2018 by a game developer with a penchant for technology called Sky Mavis. It had behind it a team which was based in Vietnam primarily. It had two co-founders namely Aleksander Larsen and Trung Nguyen.
Trung, who had graduated with a BS in computer software engineering and had previously worked at Anduin Transactions as a software engineer before co-founding the project, currently serves as its CEO. Larsen, who still serves as the Secretary of the Board of Directors of the technology project Blockchain Game Alliance, serves as its COO.
Show the roadmap
source
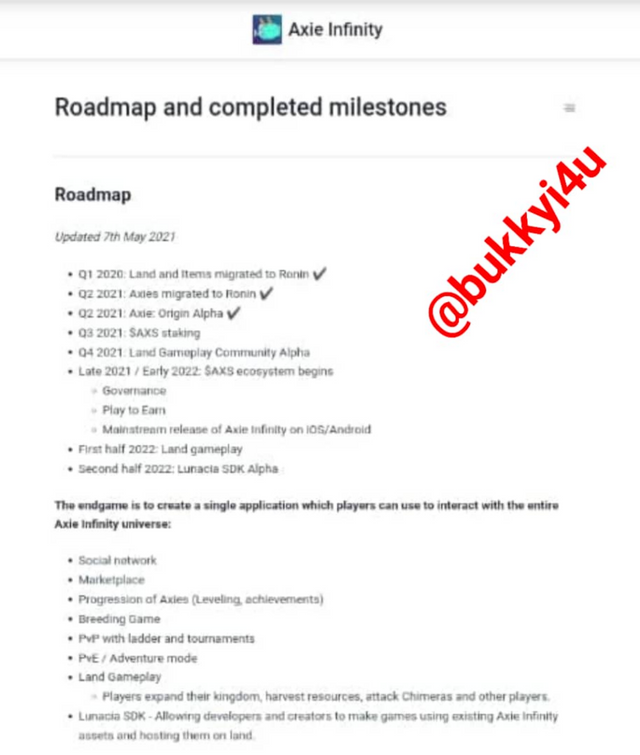
The image above displays the Axie Infinity road map. The roadmap, which was last updated on the 7th of May 2021, can be broken down as follows:
- Migration of lands and items to Ronin was to occur in the first quarter of 2020
- The migration of Axies to Ronin was scheduled to hold in the second quarter of 2021
- The introduction of Axie Origin Alpha was to take place in the second quarter of 2021
- The $AXS staking was to take place in the third quarter of 2021
- The fourth quarter of 2021 was to see the introduction of the Alpha Land Gameplay Community
- In late 2021 and early 2022 the $AXS ecosystem was to begin
- The first half of 2022 is to see the land gameplay
- The second half of 2022 is to see the Lunacua SDK Alpha
The rest of what is needed to interact with the project and technology are listed in the white paper. The regular updates to be expected are equally enunciated.
What is the specific purpose of the cryptocurrency?
The specific purpose of the cryptocurrency is for governance. Also, it can be used for staking and for payment.
Explain in your own words what the "Evening Star" pattern consists of. What is its hit rate?
source
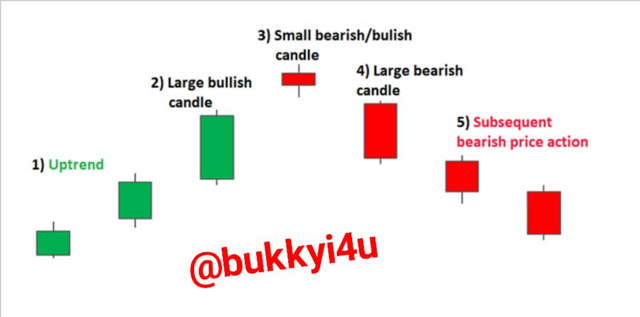
Usually, the evening star consists of three major candlesticks. First, a large bullish candlestick. This is followed by a small bearish or indecision candle near the closing highs. Eventually, this is followed by a large bearish candlestick. Generally, this pattern marks a reversal from an uptrend to a downtrend in the short term.
In the first large bullish candlestick, buying pressure sets in with buyers pushing the price to close near the highs. At the closing highs a small indecision candle indicates that the buyers and sellers are at equilibrium. Sellers set in and eventually close the price near the lows of the two large candlesticks.
The fact that the first bullish candlestick had been bearishly engulfed indicates that the evening star:
- Is a bearish reversal pattern
- Shows that sellers are In control at the moment
- Becomes even more significant as it becomes larger
In order to identify the evening star from cryptocurrency price charts you should:
- Ascertain that an uptrend is in existence
- Identify a large bullish candle in continuation of the uptrend due to large buying pressure
- A small bearish or bullish candle - which could be a Doji - should follow as a result of weakened uptrend and indecision
- A large bearish candlestick should form in a bearish engulfing as the very first real sign of selling pressure
- A subsequent downward price action marked by lower lows and lower highs is expected
The hit rate measures the number of times that this particular candlestick can be said to be correct or reliable in percentage. At present, the hit rate of the evening star candlestick pattern is put at 72%.

Explain in your own words what the pattern "Abandoned Baby" consists of. What is the percentage correct?
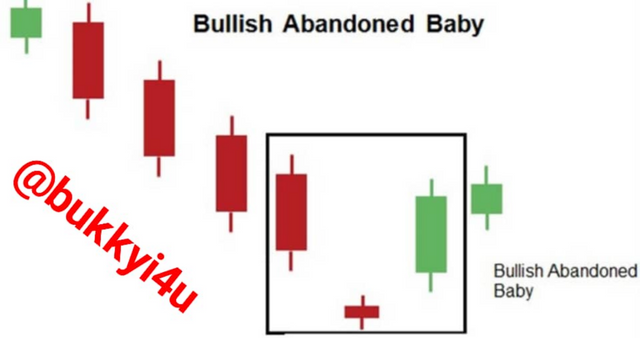
source
The abandoned baby candlestick could be either bullish or bearish in nature. The bullish abandoned baby candlestick would normally appear at the low end of a market trending downwards. In this case, a series of bearish candles make lower lows and creates a gap. After the gap another bearish candle forms. Unfortunately, the selling pressure is not sustained. This results in a doji candlestick were both opening and closing prices materialise at the same price range. The next and confirmatory bar is formed as a bullish candle.
Generally, the bullish abandoned baby price chart pattern is tipped to be 49.73% correct or accurate in predicting subsequent price movement.
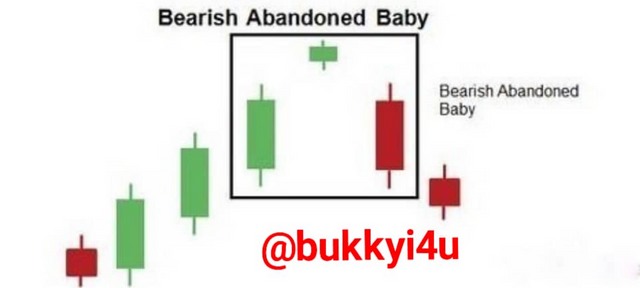
source
Bearish abandoned baby pattern would appear at the high of an uptrend. In this case, a bullish candle makes a higher high. This is followed by a gap. After the gap a new candle or doji forms in which case both the opening and closing prices are formed at the same price range. This is then followed by a downwards gap. After the downwards gap a baby candle which is bearish in nature, forms. Usually, this pattern represents a reversal of an upward market in the short term. Usually, this particular pattern is often said to be 65 correct in predicting lower price movement over the following 20 days.

BTC/USDT 3 Day Chart
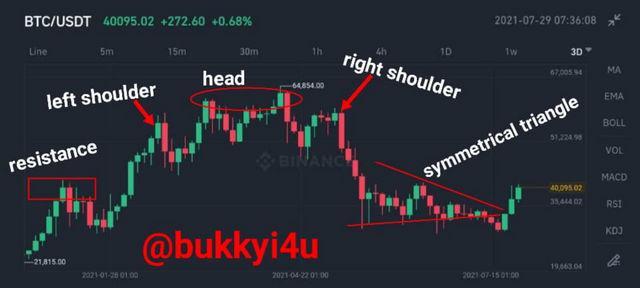
screen from Binance
The BTC/USDT 3 day chart pattern starts with price making a failed attempt to break through a particular resistance. The ensuing retracement from this failed attempt eventually gives way to a breakout towards the upside that births a head and shoulders pattern. The head and shoulders pattern eventually gives way with a downwards breakout that results in a symmetrical triangle. Currently, the symmetrical triangle seems to be giving way to an uptrend.
In the failed attempt price had tried to break through a particular level but met resistance as a result of selling pressure. There was a pullback in price action. Suddenly, the buyers set in in an attempt to push price upwards and there was a breakout towards the upside. This is followed by a head and shoulders pattern which portends a reversal of the impending price upwards movement. In the head and shoulders pattern price makes two smaller moves amidst a larger price move. This is often seen as one of the very reliable patterns indicating possible trend reversal. Buying pressure sets in with the left shoulder and price makes a peak but subsequently experiences a decline.
Then another larger price move which rises above the left shoulder ensues but experiences a decline again somewhat back to the original base. Finally, the price rises this time somewhere to the height of the first or left shoulder and declines again. Eventually, a symmetrical triangle follows in which case price seems to be in a consolidation phase with a potential breakout. Price is finding it hard breaking above resistance or below support level and is trading within a range. This is followed by a developing possible upwards price movement.

BTC/USDT 7 Day Price Chart Pattern
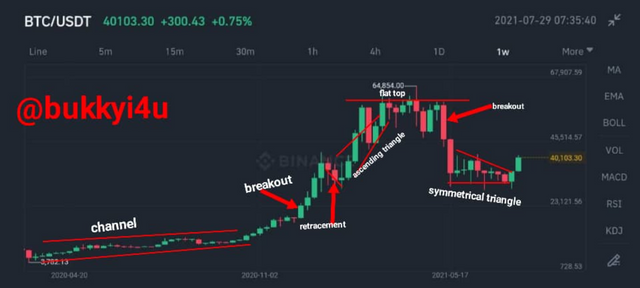
screen from Binance
The BTC/USDT 7 day price chart pattern starts with a channel which experiences a breakout to the upside. A slight retracement in price follows but gives way to an ascending triangle. Eventually, a flat top develops experiencing a downward breakout resulting in a symmetrical triangle that currently seems to be giving way to an upwards price movement.
In the channel price finds it difficult going either above a resistance level or below a support level. Buying treasure sets in and an upwards breakout follows. Unfortunately, this new upwards movement experiences reduction in volume and there is retracement in price. The retracement experiences breakout as a result of renewed buying vigour in the market. This continues in an ascending triangle which is marked by a steady upwards movement of price.
Unfortunately, a flat top develops in which there seems to be a period of indecision. Neither the buyers or sellers are winning. This is a potential reversal pattern. Eventually, the sellers set in and price experiences a breakout to the downside. A symmetrical triangle follows in which case price consolidates within a trading range. At present two bullish candles portend a possible upward movement of price.

Conclusion
The development of new block chain projects and protocols usually follow very interesting procedures. Normally, it is expected that the founders and developers would come up with a detailed white paper which gives out information on its important use cases and also provides the roadmap towards accomplishing their set goals, objectives, missions and purposes. These blockchain projects will often come with very interesting use cases that can include the features of transparency, traceability, immutability and trustlessness in blockchain applications.
Price chart patterns are very important as possible trading tools that can be used for the technical analysis of assets. Interestingly, both professionals and beginners can find them very useful in predicting possible market moves and trends. These patterns would normally form or develop shapes that can tell of the underlying price action which can include possible reversals or breakouts. There are different chart patterns that can be developed over time. Therefore, it is important to get yourself acquainted with their different features and characteristics to increase your trading accuracy.

Gracias por participar en la Tercera Temporada de la Steemit Crypto Academy.
Realizastes un buen esfuerzo, sin embargo, en la respuesta a la Pregunta #4, se solicitaba identificar patrones de precios asociados a las "velas japonesas", particularmente los explicados en la clase y los analisis que realizastes no estan presentes.
Continua esforzandote y espero seguir corrigiendo tus asignaciones.
Downvoting a post can decrease pending rewards and make it less visible. Common reasons:
Submit