The Week 12 lecture by professor @kouba01 was quite informative and revealing. I benefited in no small measure from the lessons enunciated. In fulfillment of the assignment task given, I hereby make my submission.
What is the Relative Strength Index - RSI and How is it Calculated?
What Is Relative Strength Index (RSI)?
The relative strength index is a financial market momentum technical indicator by which charts are developed to measure and reflect the weaknesses and strengths of a crypto market in both current and recent periods of trading by simply taking note of the closing prices. The indicator is seen as a momentum oscillator which works in measuring the velocity or momentum which is the rate of rising or falling seen in price movements.
With the RSI, momentum is calculated or shown as a metric of closing prices in a ratio of higher to lower. To this effect, crypto markets that have had stronger or more positive changes in prices would have a higher RSI. In the same vein, crypto markets with stronger or more negative price changes would have a lower RSI. Interestingly, the RSI gives traders signals to buy when the crypto is oversold or to sell when it is overbought.
How To Calculate RSI
Having covered the definition of the RSI in its simplest form, it is now very important to go a little deeper to understand how it is formulated and calculated.
First, it is important to note that the calculation of the RSI can be divided into two parts.
By default the RSI is set to 14 periods. What this means is that if we are calculating the RSI on a per day basis, then this looks back at the last 14 days.
Therefore, in calculating we are going to use the average close over the first 7 days.
Then, the 7 days that follow.
After this, we take the gain or loss percentage of the two periods.
This would give us an equation which looks like this:
- 100 - [100 / (1 + average gain/average loss)]
Take for instance, let's assume that in the first 7 days the market actually closed with an average gain of 3% but closed with an average loss of 0.5% in the 7 days that follow.
100 - {100 / (1 + 3% gain - 0.5% loss)]
RSI = 100 - [100 / (1 + 2.5%)]
RSI = 71.4286
This places the RSI above the overbought threshold of 70.
Also, ….
There is a second formula which compares the gains and losses of the previous 14 days period with the current loss and gain. Thus:
RSI Step 2:
- 100 - [ 100 / (previous avg. gain X 13 + current gain / previous avg. loss X 13 + current loss)
Obtaining and comparing data of results from the two different formulas will give a more accurate understanding of the RSI over the 14-day. However, it should be noted that calculating the RSI over a longer period could give a more accurate result.
Can we trust the RSI on cryptocurrency trading and why?
The RSI is a nice tool in comparing price momentum in bullish and bearish periods. Usually, the results are shown on an oscillator which can be found below a price chart. However, its results can most be trusted when they represent trends that occur over a long-term.
This is because the RSI indicator is not without its own limitations which could make it less trustworthy as a standalone tool. These limitations include the fact that:
RSI indicators are known to work best when they are in non trending zones and can give false signals in the trending zones
At key reversal stages, RSI may not take volumes into account and may only give signals of an overbought or oversold market while being unable to tell more about price movements above or beneath the threshold points
So, RSI indicators should be used together with a few other indicators as well as price chart technical analysis to give better and accurate results on entry and exit points.
How do you configure the RSI indicator on the chart and what does the length parameter mean? Why is it equal to 14 by default? Can we change it?
How To Configure The RSI Indicator
To configure the RSI indicator we can use the TradingView platform. To use the TradingView platform to configure RSI indicators we have to create a free account and then follow the three steps below, namely:
- Select a cryptocurrency pair of your choice
- Add the RSI indicator to your account
- Configure the RSI
Step 01:
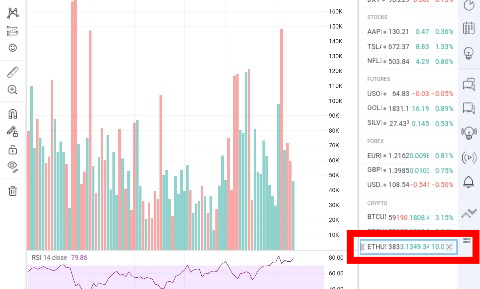
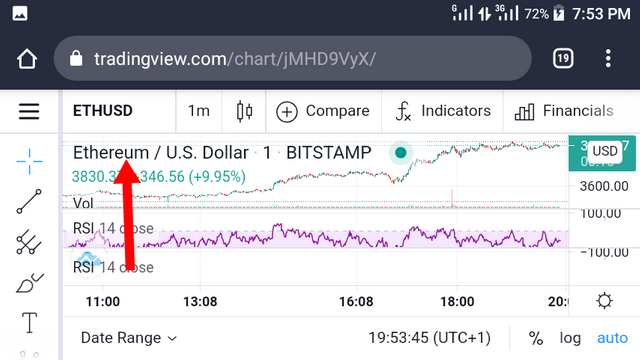
- From the bottom right where the arrow is located select ETH/USD pair
- The selected ETH/USD pair is displayed at the top right
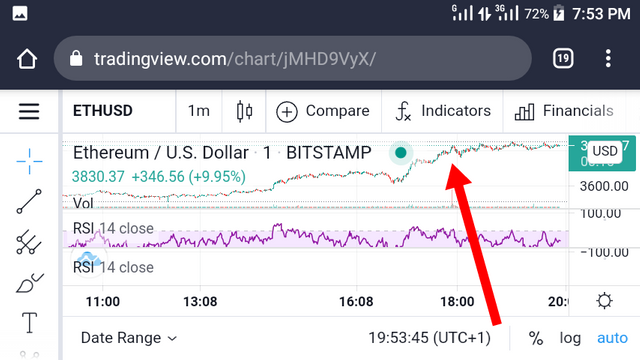
- The price chart for the selected ETH/USD pair is displayed at the centre
Step 02:
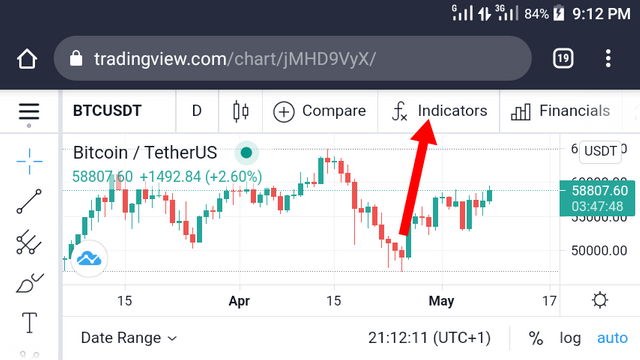
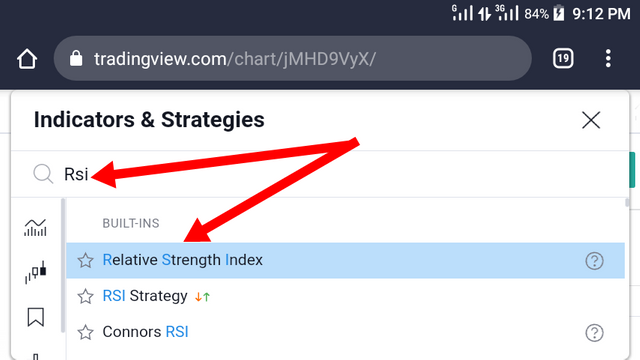
- Select the 'Fx indicator' icon
- Key in 'RSI' into the search bar of the new outlay displayed
- Select 'Relative Strength Index'
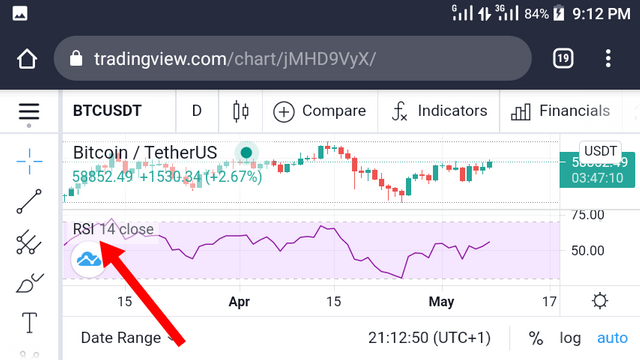
- The 'Relative Strength Index' is added beneath the price chart
Step 03:
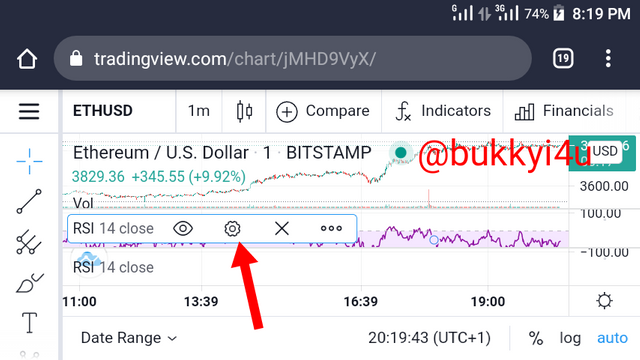
- Select the settings symbol
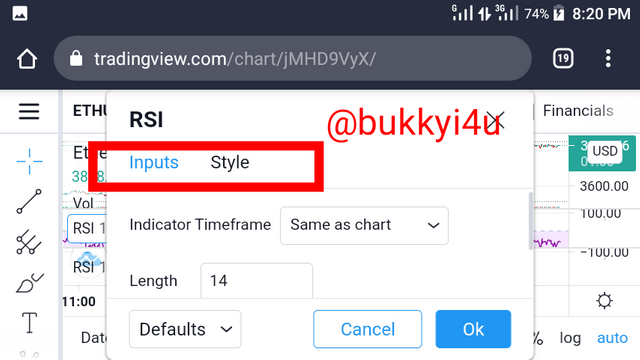
- This displays the custom configuration window
- Set the variable data for the 'Input' settings
LENGTH: which indicates the number of bars or period for which the RSI is to take its value
SOURCE: which indicates the price which will be taken into account. Usually, it is the closing price but can be customised - Set the variable data for 'Style' settings
RSI FONT: you can select colour of lines, its thickness and the fill colour in between lines
RSI VALUES: you can configure the upper and lower limits. By default, it will be 30 and 70 respectively
PRECISION: here levels can be set to as much as four decimal places
What Does The Length Parameter Mean?
The RSI length parameter refers to the time frame or range of time between which the RSI indicator is set to measure. Actually it is normally set to 14. However, this can either be increased or decreased depending on the trading strategy or how advanced or intermediate a trader may be.
Why Is It Equal To 14?
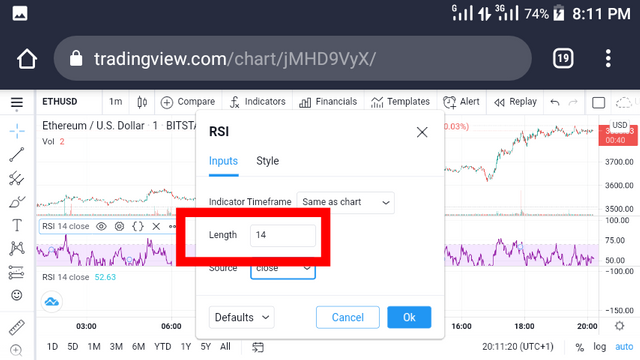
Generally, 14 is seen as the normal period of length setting in the RSI. It is understood that the length setting works to determine the volatility or stability of the RSI. This will determine how slowly or fastly the RSI will react to changing price actions which is represented by the action of the changing bars. A longer time frame would indicate fewer but more reliable signals while a shorter time frame would indicate more but less reliable signals.
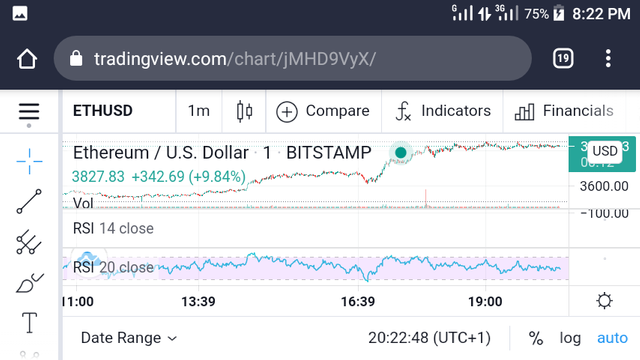
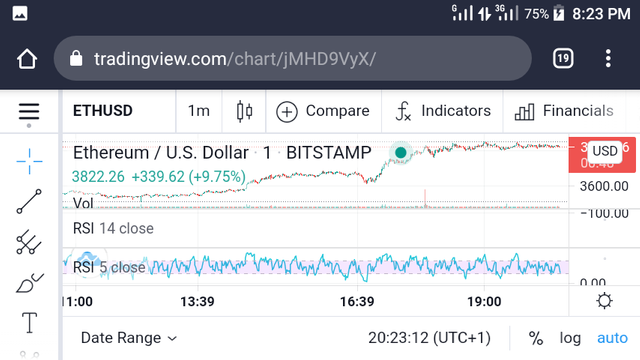
This can be illustrated thus with the screenshots that follow:
- Setting the length of the RSI to 20 produced less extreme RSI values which appeared more stable and then less volatile.
- Setting the length of the RSI to 5 produced more extreme RSI values which appeared more unstable and more volatile
Can It Be Changed?
Yes the length of the RSI can be changed. It could be changed to reflect one's trading strategy. Intraday traders may prefer reducing the length to give them better results within the day. Swing traders may prefer increasing the length to give them wider range of results.
How do you interpret the overbought and oversold signals when trading cryptocurrencies? (Screen capture required)
The Overbought Signal
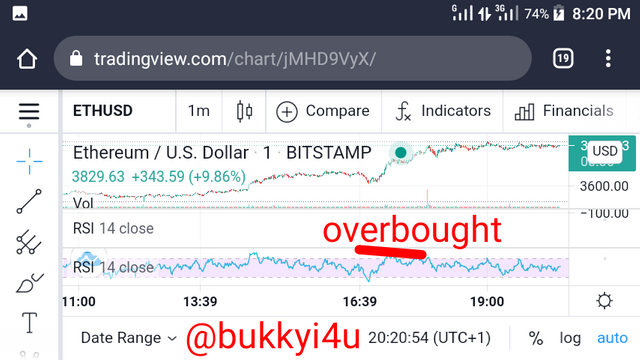
The overboard signal is necessary for the interpretation of two important market metrics, viz a viz:
- Increase of demand relative to supply
- An impending price reversal
1 Increase Of Demand Relative To Supply
When the demand for a particular crypto gets so high far above the supply, such an asset experiences a high price in the market. In this situation the asset is said to be overbought. With the RSI such a condition can easily be ascertained. This is because on the RSI points above the 70th threshold represent an overbought market.
2. An Impending Price Reversal
Most times the price of assets oscillate between the 30th and 70th limits. Hence, this is often the default limit settings. As a result, when prices go above 70 and oscillates between 70 and 100, it speaks of a market that is about to undergo a price reversal.
The Oversold Signal
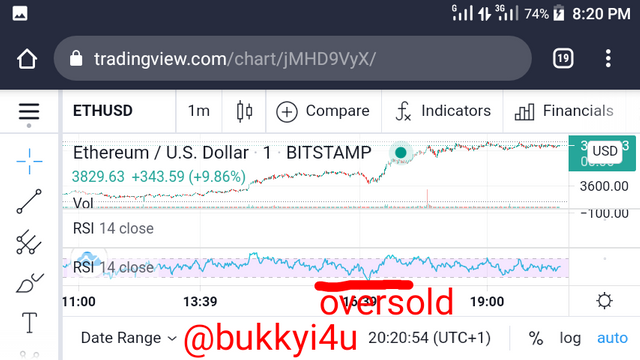
The oversold signal is necessary for the interpretation of two important market metrics, viz a viz:
- Increase of supply relative to demand
- A possible price reversal
1 Increase Of Supply Relative To Demand
The increase of supply to demand of a particular crypto would trigger a price drop. Usually, this is indicated on the RSI when the indicator oscillates between 30 and 0 since 30 is the lower limit.
2. A Possible Price Reversal
The normal limit between which the price oscillates in a market is between the 30th and 70th mark. So, when the price goes below the 30th mark it signals an imminent possible price reversal.
Generally, when the price is below the 30th mark investors would be on the lookout for signals that could cause an upward price reversal. On the other hand, when the price oscillates above the 70th threshold investors will be on the lookout for signals for possible downward price reversal.
How do we filter RSI signals to distinguish and recognize true signals from false signals. (Screen capture required)
Relying entirely or heavily on the generally accepted function of the RSI in identifying overbought and oversold periods to either exit or enter a market can be quite deceiving, to say the least. This is because the RSI only merely acts to indicate a trend. Also, it can only act on the time frame we are currently using.
To remedy this situation and correct the false signals that could be created by RSI indicator two solutions can be resorted to, namely:
- The use of RSI together with other indicators
- Taking note of RSI divergences
The Use Of RSI With Other Indicators
The mere fact that her side indicators only show a trend may not be overtly accurate in determining when to buy or sell this is because while the RSI could be indicating an overbought trend a lot of upward and downward price actions could still be taking place above the overbought region. This could still be the case in the oversold region. Correcting this would require the use of other indicators like the Stochastic Slow Indicator and MACD together with the RSI to indicate areas of confluence which represent more accurate entry or exit points.
Taking Note Of RSI Divergences
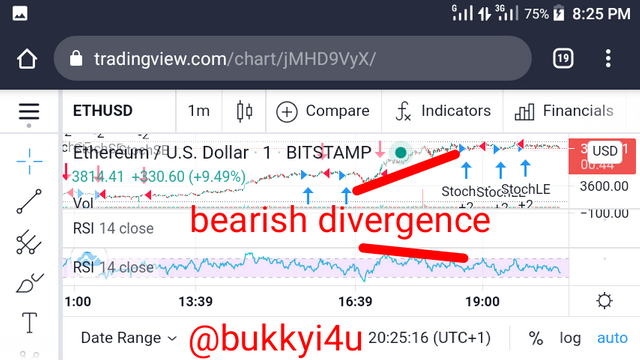
As prices change, the RSI indicator is expected to change in the same manner. However, when a price makes a high and an even higher high but the RSI indicator does the opposite, a difference is created which is a divergence. Also, this is true when the price makes a low and an even lower low but the RSI does the opposite. Interestingly, RSI divergences can be of help in forecasting more accurate results. Thus:
BULLISH DIVERGENCE:This occurs when the price goes lower but the RSI makes a higher low. It is a strong indicator of a market with an imminent price reversal. If it occurs in the oversold region, then a market with an imminent upward reversal should be expected.
BEARISH DIVERGENCE:This occurs when the price of the crypto goes high but the RSI peaks low. It indicates an imminent price reversal.
Review the chart of any pair (eg TRX / USD) and present the various signals from the RSI. (Screen capture required)
The Ethereum/USD pair

From the beginning of the Ethereum/USD price chart, the asset is seen to start with a particular price value. It continues within this region of price to a little bit after 13:39 when it experiences a higher increase in price. The increase continued for some time before it eventually bottomed out at another higher price and picked within the region of this new high price for sometime before getting to around 16:39 when the price went down a little bit thereby creating a higher low price at around 16:40.
From there the price went up steadily thereby creating a new higher price level. Since the RSI continued in the opposite trend, this resulted in a bearish divergence. From there the price began to experience an upward trend which eventually got to another higher low level at the point where the green ball is seen close to the FX indicator. Then it peaks at another higher price level and continues at that high price level from around 19:00. It remains at this price level up till the moment of this screenshot.
It should be noted that as expected the bearish divergence created resulted into a price breakout. Buying at the bottom of the higher low created would have been a nice investment move since investors will now have the opportunity of selling at a higher price especially as the asset now reaches a steady higher price from there for quite some time up till the moment of the screenshot.
Conclusion
The RSI can be quite instrumental in informing us when the market has entered an overbought or oversold region. This could be a good signal in knowing when to sell or buy respectively. However, it should not act on its own alone. The RSI should be combined with such other indicators like the Stochastic Slow Indicator or MACD to give better readings and correct false signals.
(Note:Unless otherwise indicated, all screenshots are taken from TradingView.com)
how many people know about steemit currency graph
Downvoting a post can decrease pending rewards and make it less visible. Common reasons:
Submit
Hello @bukkyi4u,
Thank you for participating in the 4th Week Crypto Course in its second season and for your efforts to complete the suggested tasks, you deserve a 9/10 rating, according to the following scale:
My review :
A work of excellent content in which you answered the questions with an analytical dimension and gave your opinion on several points.
Thanks again for your effort, and we look forward to reading your next work.
Sincerely,@kouba01
Downvoting a post can decrease pending rewards and make it less visible. Common reasons:
Submit
Professor @kouba01 my post have been skipped for curation by @steemcurator02, meanwhile I had a fair grade for curation.
Post link
https://steemit.com/hive-108451/@silencewan/steemit-crypto-academy-season-2-week4-cryptocurrency-trading-with-rsi-for-kouba01-submitted-by-silencewan
Downvoting a post can decrease pending rewards and make it less visible. Common reasons:
Submit