INTRODUCTION

created with Canva
The method refers to a sort of strategy which can be adopted for the trading of cryptocurrencies ( or stocks, in general) and which was developed in the early 1930s by a certain man named Richard Wyckoff. In its most rudimentary form it is made up of principles that come in series together with some kind of strategies which were developed originally for and which can be adopted by both traders and investors alike. Initially when this methodology was developed its primary focus was on stocks. However, the strategy can be used for any financial market.
Richard Wyckoff, who developed this method, really dedicated most of his life to impacting knowledge and professional teaching. Consequently, he undertook a lot of erudite research especially on stocks and financial markets. Interestingly, his works now have a very great impact on what is today known as technical analysis (TA) in the modern era. The methods and strategies he adopted for trading were known to have been inspired by many great investors and successful traders (Jesse L Livermore, especially). For all his efforts, he is now highly regarded side-by-side as such other icons like Ralph N. Elliot and Charles H. Dow.

WHAT EXACTLY IS THE WYCKOFF METHOD?
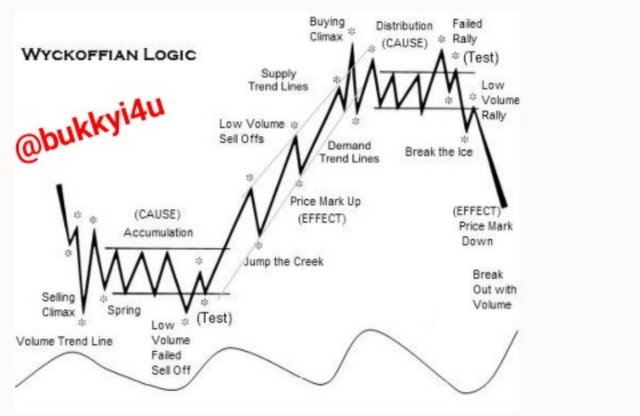
The basis for the methodology is on the analysis of prices of cryptocurrencies (stocks) and on the market volume. Actually, it is not based on any definite or very clear rules nor is it based on technical indicators. These were never used by Wyckoff. Instead he concentrated on the analysis of price charts in depth. Again, he focused on the dynamics of supply and demand in the market. Furthermore, he based his methodology on trying to unravel the minds of the big dogs or juggernaut traders whom he called Composite Men. Following the methodology requires watching to see how the big traders would acquire cryptocurrencies at the bottom hoping to sell them off at the top. The Wyckoff method relies on just two popular indicators: cryptocurrencies or stock prices and their volumes. These must not lag behind as may be observed with some other indicators. They must be the result of lively and instantaneous market actions.
The theory developed by Wyckoff to be used for technical analysis and in the making of trading decisions are as follows:
- Analysis of the bars as well as chart points-and-figures that can be seen on the indexes as a way of trying to determine the current state of the market and the possible trend in the near future and then deciding on whether to enter or not.
- Carefully selecting the cryptos that are moving in harmony with the prevailing market. Selecting cryptocurrencies that are moving stronger than the market for trading is more preferable
- You should only decide on and select the cryptos that have the capability of moving above or, at least, equalling the minimum set objectives. Generally, you should select cryptos that are under the accumulation or re-accumulation stages.
- You should then rank the cryptocurrencies based on their perceived ability to move in your preferred direction or simply based on your preferences
- Once there is a turn in the indexes, enter a trade, put your stop-loss order in place and follow up on the market to decide on when to take profit

THE WYCKOFF METHOD'S FOUNDATION
This method of trading or theory that is called the Wyckoff Method of trading is based on two concepts and known rules, namely:
- Price action
- Market cycles
The Wyckoff Method has two instrumental pillars as propounded by the rules, namely:
Rule No 1
The market is never known to behave in exactly the same manner or way. That is to say that the price would not follow the exact course it had taken in the past. Every single move seen in the market constitutes a unique price action.
Rule No 2
Based on the fact that every single move that is seen in the market trend and the price action of the market is quite unique, the analytical importance that can be attached to such a move can only be drawn from an in-depth comparison between the current move and its behaviour in the past.

THE PRICE OR MARKET CYCLES PRESENTED BY THE WYCKOFF METHOD
The greatest contribution that can be said to have been made by Wyckoff is with his price cycles or market cycles. This price cycle simply refers to an algorithm which creates a relationship between institutional money flows, market phases and price changes. This particular theory on market cycle which is based on price action remains among the most popular currently. Based on this market cycle theory, the price cycle of any cryptocurrency or security would be based on the four stages that are as follows:
Accumulation Phase
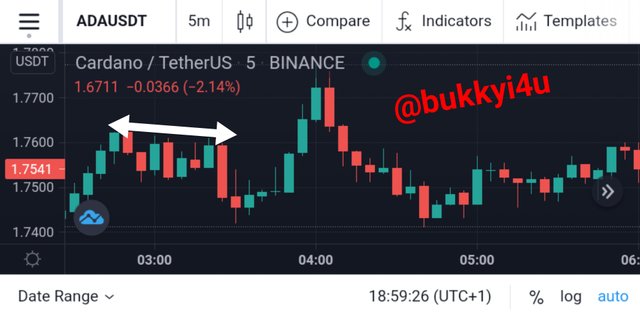
The first stage of the method is the accumulation phase or process. The accumulation phase usually occurs when the institutional demand of a particular cryptocurrency experiences an increase. The bulls or the buyers are beginning to gain more strength or power and are definitely set to push prices much higher.
However, it should be noted that although this stage tells of bulls gaining more strength, the price action as can be seen on the chart would remain flat. That is to say that a structure in the form of a ranging price action on the chart is what actually illustrates this stage. Whenever a higher bottom is created in this stage it is normally seen as an indication that it is an Accumulation Phase.
Mark-up Phase or Uptrend
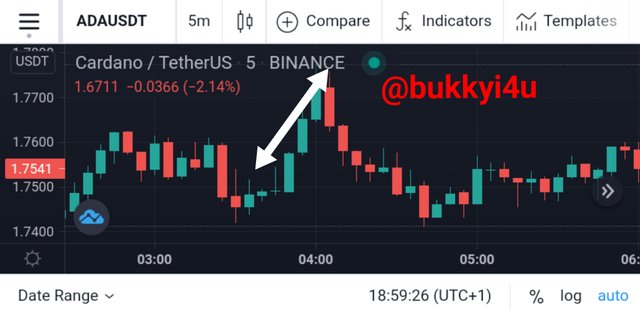
This is the second stage of the Method. Usually, it begins whenever price breaks off from the upper border that is in the Accumulation Phase. This usually signifies that the bulls or buyers (who are actually the institutional traders, in this case) are very much ready to overcome the resistance that has been placed by the sellers and are ready to push prices upward.
In most cases the actual price bar that results in the breakout will be accompanied by higher price bars which indicates higher volume. This immediately leads to a bullish trend and triggers the stop losses of many retail traders which helps to fuel the upswing. Once this uptrend begins to rage a lot of sellers quickly switch to buyers and even the retail traders who had been on the sidelines move in. Occasionally, there could be pullbacks as a result of low volumes and these points are very good times to enter.
Distribution Phase
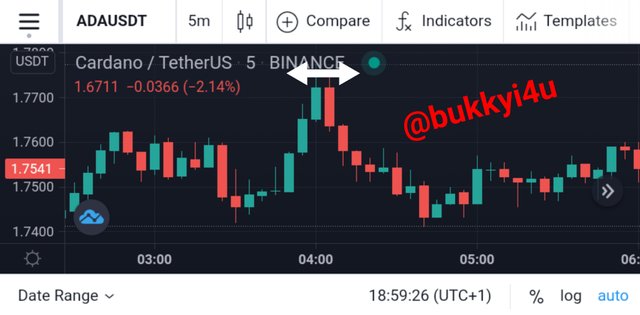
Usually, the third stage of the method is followed by a marked low-volatility in prices and a ranging or sideways market. The price fails to make a new higher that can be sustained and candlesticks patterns like triple bottom pattern and head and shoulders are very evident. At this stage it can be interpreted that the big traders are slowly unloading their markets while some are quietly shorting their positions.
Unfortunately, the buyers are deceived by the uptrend that had preceded and keep buying. Actually, they now find themselves at the sell orders end of the institutional traders. The institutional traders do not allow the price to fall heavily brother there slowly unload their markets. As a deceptive measure to lure in more buyers, they may even decide to push the price a little bit higher. Usually, this results in a quite temporary breakout which is meant to create a bull trap, quickly followed by a downward trend as a result of price breaking out the lower border.
Mark-down Phase or Downtrend
Actually, this is the last phase of the method. Usually, it starts when the lower border of the distribution phase experiences a price breakout. This results in a downtrend. It can be interpreted that the institutional traders now allow the prices to drop and most of them have adopted a sell position. The buyers quickly change to sellers and retail buyers equally undertake sell positions. This results in a fast moving downward trend the end of which will mark a new accumulation phase.

THE FUNDAMENTAL LAWS OF THE WYCKOFF METHOD
There are three important laws that can be seen with this method. Each law addresses a particular characteristic of the volume and price change in the market which would usually be based on what the trader already knows. These three laws include:
- The law of supply and demand
- The law of cause and effect
- The law of effort and result
Law Of Supply And Demand
This particular law looks into the quality of ownership of the crypto or stock. A cryptocurrency would be considered as having been Absorbed if it has entered strong hands. At this point the supply will be low due to the fact that very little of it would be available for sale. Increase in the demand for the crypto would cause it to go up. Increase in demand with low supply will cause prices to go up.
When a composite man wants to campaign for a particular cryptocurrency, he would normally buy so much of it during the accumulation stage and would not be willing to sell off. The trading ranges that experience a lot of change in ownership which would affect supply and demand are the Accumulation and Distribution stages.
In the distribution stage the Composite Men will be selling. In that case the crypto will be going into weaker hands. This creates Supply in the market. The stage where the demand and supply are equal creates a trendless market. At the end of this trend less market an imbalance between supply and demand will be created and that leads to a new trend.
Law Of Cause And Effect
This is closely related to the first law, that is, the law of supply and demand. There has to be a cause before a corresponding effect results. When a cause is large the effect will also be large in proportion to the cause. Interestingly, this reminds me of Newton's law of momentum! The phases of Accumulation and the Distribution can be seen as periods where Cause is building up. The resultant uptrend or downtrend is the phase where the Effect is felt.
Actually, there is a charting tool used by the Method to determine what Effect on the Cause would be. It is called the Point and Figure (PnF) chart. Here, the technique used is the horizontal PnF counting. For example, the range of the Accumulation Phase is plotted with the PnF chart. Once this is done a technique which involves counting throughout the horizontal ranges that can be seen in the Accumulation or Distribution Phases is used to project what the movement would be.
Law Of Effort And Result
In this case it is said that Effort comes as a result of Volume while Result is seen in Price due to the Effort of the Volume. Usually, a high Effort as seen in the Volume would result in an upward Price trend. When prices push out of the Accumulation Phase and begin to go higher it can be interpreted that there is a high volume in the market which is due to a large Effort. The continuation of this large Effort would result in an uptrend which continues to advance. The converse is also the case in which a situation whereby small Efforts on the lower corner of the Distribution Phases would result in a downtrend.

THE COMPOSITE MAN: A WYCKOFF TRADING METHOD
When Wyckoff was trying to explain how he understood prices to move in phrases he used the concept of a Composite Man or Composite Operator. Actually, this is an imaginary figure who is assumed to control the price moves. Specifically, the Composite Man is known to represent the market makers, wealthy traders or institutional traders that possess what it takes to manipulate prices of cryptos in the market for him to either buy at a low price or sell at a high price.
The idea expressed by the Wyckoff method is that the Composite Man has his own manner of trading which is different from the retail traders. Unfortunately, most retail traders trade against or from the opposite side of a Composite Man. This would result in losses for them. As a way of remedying the situation, Wyckoff posited that the retail traders should trade with the footprints of those he called the Composite Men. He believes that this will be a lot easier due to the fact that the Composite Man who would normally leave a pattern in the market.
Be that as it may, the retail trader should not pay so much attention to whether the market move is caused by big traders artificially manipulating the market or the normal buying and selling activities of the public. He should rather seek to trade in line with the intent of the Composite Man. The teachings given by Wyckoff on the Composite Man can be summarised thus:
- The Composite Man will usually take a lot of time in planning before executing a trade
- The Composite Man has a way of enticing the public to sell the market to him at cheaper prices and he does this by pushing prices to the downside. Once he has accumulated so much he will cause prices to go up again and pull in more buyers
- You being a retail trader should be able to properly analyse and scrutinize the market with an intention of figuring out what the position of the large market actors and players or Composite Man may be at that moment
- Your ability to study the big players more and understand them gives you the edge of being able to interpret the motives behind every price movement in the market. Studying and understanding how the Composite Man goes about his game will help you spot good trading opportunities at a very early stage
- The Composite Man is highly linked to the digital footprint known as Bulls' trap or Spring and Upthrust in price movement.

MY TAKE ON THE WYCKOFF TRADING METHOD
After going through the Wyckoff Method that has been given by professor @fendit for this week's homework task I came to discover some important advantages surrounding it. However, I also came to understand a few limitations of the Wyckoff method.
I have come to discover, after so much analysis and checking through different price charts both within and beyond the crypto market, that the Wyckoff method can be applied in just any financial market at all. This is much of a great advantage that a particular strategy developed over a 100 years ago can still be applied to financial markets even today. Also, I discovered that its approach towards technical analysis and behavioral patterns for putting into consideration what may have happened to cryptocurrency prices and what is likely to happen to such prices in the near future is very unique. This gives it the ability to graciously peer into what the price trend could be in the near future. Moreover, this methodology has the power of letting you know exactly where the market is at the current time and letting you in on where it is likely headed. This gives you the opportunity to find points of entry when accumulation stages are in place and to find exit points when points of distribution are setting in our points of negative breakout.
However, from my own personal studies I have discovered that this system may not be very good for a very short time-frame trading. This is based on the fact that it has a long range of full market cycles that must be in place before it can effectively be implemented. Take for instance, at the accumulation stage you probably may not know where the market may be headed from there - whether upwards or downwards. In fact, a 15-Minute chart may not necessarily contain all the stages and it may be difficult to apply it to such a short-term trading basis. Even if the chart does appear to contain all, it may not be very accurate as a 15-minute chart itself may not even be adequate to tell you when a market is in a downward or in an uptrend. This is not to talk of shorter time frames like 5 minutes in the case of scalping.
However, on the time frames when this methodology can be applied I still believe that they would have so many benefits based on the fact that the methodology finds its basis and foundation on a rudimentary understanding of human intuitions, behavioral patterns and basic intents and psychology. The methodology was not built by Wyckoff as a result of research carried out with computer systems. Rather, it came from a careful study and diligent understanding of how human beings behave in the financial markets. No wonder this age-long methodology still finds relevant application even in this generation! This is more so occasioned by the fact that the mentality of the financial market trader as at that time has not changed even now. It may have only improved with better knowledge but still finds its basis on some kind of structural patterns which are most probably bound to repeat in the financial market.

APPLYING THE METHOD IN A REAL TRADE CHART OF THE CARDANO/USDT
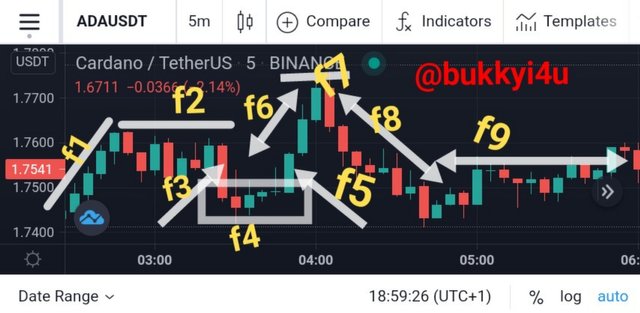
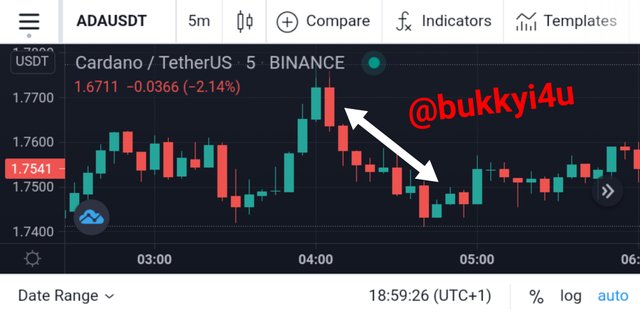
The screenshot begins with the stage represented with F1 which is actually a short uptrend which looks like a pullback from a downward price action. This quickly launches the market into an accumulation phase, the very first phase of the Wyckoff Method represented with F2. In the accumulation phase there is a short pullback location by the F3 arrow which represents a downward price breakout.
However, this is a false breakout as it is quickly followed by low candles, denoted by F4, which represent a spring that acts to herald the incoming upswing breakout. F5 represents the breakout which results in F6, the uptrend. In comes the f7 which is the distribution phase as the mark-up phase or uptrend makes an end. This is followed by F8 which is the downtrend or mark-down phase. This marks the end of a full market cycle based on the Wyckoff Method. A new market cycle begins with an accumulation phase which is marked by F9.
Volume Analysis
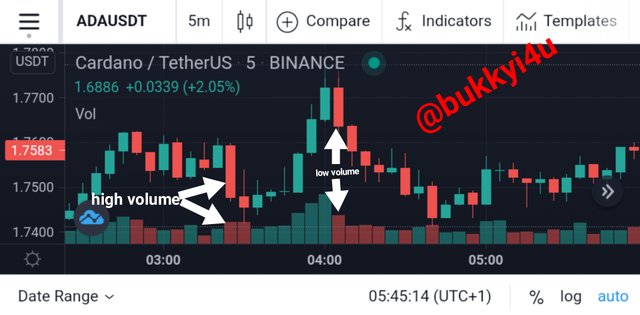
Generally, the uptrend is accompanied by increasing volumes as can be seen from the volume chart. This is due to the fact that the market momentum is high. Conversely, the downtrend in the Cardano/USDT chart is accompanied with a much decrease in volume due to market momentum decreasing. Importantly, it should be noted that at the point where the accumulation phase makes a lower breakout, instead of the volume to decrease it rather increases to a higher volume which I represented with 'high volume' in the chart.
This is a sign that the breakout is a false one and would eventually lead to a spring which actually does come into place. A spring usually precedes a breakout and in this case an upward breakout. It is indeed a positive sign and a good time to enter. At the place where the bearish engulfing was formed there was a relatively large decrease in volume leading to a 'low volume' . This is a huge warning to exit. Also, it can be observed that accumulation and distribution phases are accompanied with volatile volumes that are moving sideways.
Timing My Entry And Exit
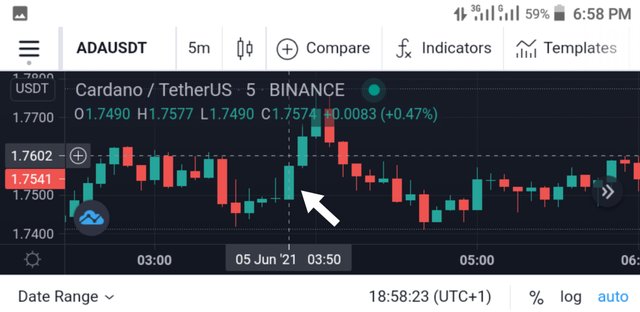
Trading this crypto would require me to make my entry at the point where the market transits from the accumulation phase to the uptrend. Another position of entry is the point where the market transits from the distribution phase to the downtrend. At exactly 3:50 there is an upward price breakout at $1.7490. This is the confirmation I need to go long as an uptrend sets in.
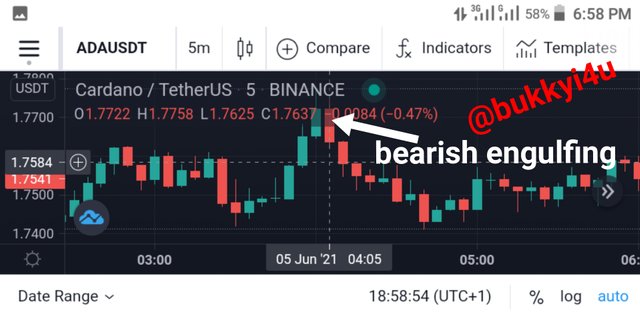
Conversely, at exactly 04:05 with price now at $1.7722 the market makes a bearish engulfing which is a strong sign of an impending downtrend. Obviously, the distribution stage has weakened and is now about to give way. This is the point where I have to take profit and exit the trade.
Risk Management With The Trade
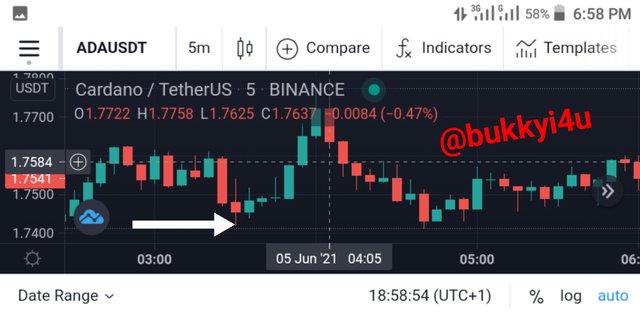
In order to manage risk with the trade I have to set a stop loss order. If I decide to trade a markup with this particular crypto then I will have to put my stop loss at the lowest point of the accumulation stage which had earlier occurred at around $1.7400 as shown above.
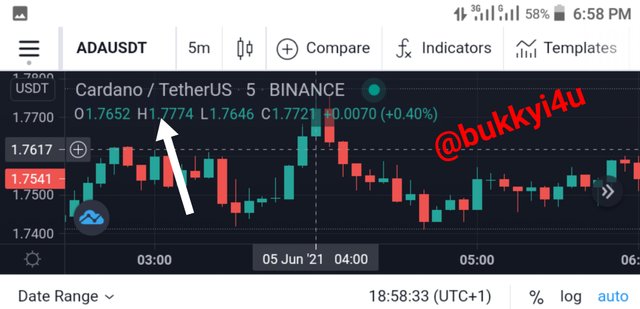
On the other hand, trading a markdown would require me to put my stop loss at the highest point of the distribution phase which is giving way to the downward price action. This highest point of the distribution stage had earlier occurred at $1.7774 as shown above.

CONCLUSION
Just as has already been stated the prices of cryptocurrencies can change based on various reasons. For some it seems impossible to predict or adequately project where the changes are headed. However, for others, carefully studying the price chart could provide some foundational basis for that judgement and tell you when to either buy or sell off.
The Wyckoff method has been successfully applied by so many institutional and professional cryptocurrency or stock market traders. All you need to do is to adapt it to a time frame that is suitable for your trading position. You should have an actionable and a very practical understanding of this methodology in order to precisely time your entry and exit points. Interestingly, this method gives you the advantage of making you feeling relaxed being fully aware that you are trading in line with the big banks, pension funds and even big hedge funds.
With the Wyckoff Method you will understand how to adequately and accurately predict the turns in the market. With this you can then apply the three laws very judiciously and be able to promptly undertake trading positions at the right time.

(Unless otherwise indicated, all screenshots are taken from TradingView)

Thank you for being part of my lecture and completing the task!
My comments:
The first task was alright, but the chart wasn't.
At first, you should have shown the volume bars as well, as that's one of the most important things of the method. As well as that, that's just a part of the chart and it's almost impossible to understand what you showed.
Overall score:
6/10
Downvoting a post can decrease pending rewards and make it less visible. Common reasons:
Submit