
edited with canva

INTRODUCTION
Although a lot of traders only make use of price action, market structure and the general trend in the market obtained from a longer time frame to determine their trading activities - especially for position traders - many make use of technical indicators and incorporate oscillators into their trading styles. A lot of these indicators work with the market on momentum. Some of the most popular ones include the MACD, Stochastics and the RSI.
However, one of the technical indicators which can be very instrumental for giving trading signals but which is of lesser popularity is the Williams Percent Range or Williams % R. In this article you are going to learn more about this particular indicator. Equally, you will learn the best ways to apply it on the crypto markets for proper results.

1. Explain the Williams %R indicator by introducing how it is calculated, how it works? And what is the best setting? With justification for your choice.

THE WILLIAMS PERCENT RANGE
The Williams Percent Range is an indicator which was built by a certain technical analyst, well-known and accomplished trader called Larry Williams in 1973. The indicator is known to work based on the momentum in the market. Its construction and organisation looks quite similar to that of the Stochastics oscillator. Overall, the indicator works by comparing the closing prices of an instrument to the high to low of that same instrument over a particular period of time.
Primarily, the indicator works by measuring the oversold or overbought levels of the price action in the market. The indicator is useful in determining the speed of the price action. Also, it could help detect possible trend reversals since it equally works to show accumulation zones in the market by indicating how the momentum in the market is shifting. Generally, the indicator would tend towards negative 100 when the market is in a strong bearish trend. Equally, it indicates values closer to zero as the trend becomes increasingly bullish.
Consequently, it helps to gauge the strength of the bulls or the bears in the market. It does this by trying to show the ability of the beers to push the prices close to or below the normal limits or the ability of the bulls to push the price is close to or above the upper limit within the period under review. Since prices that are either extensively to the higher limits or lower limits work by predicting possible trend reversals, the indicator can be used for the same purpose since it shows how extensively prices have traveled and the speed or momentum at which such movement is occurring.
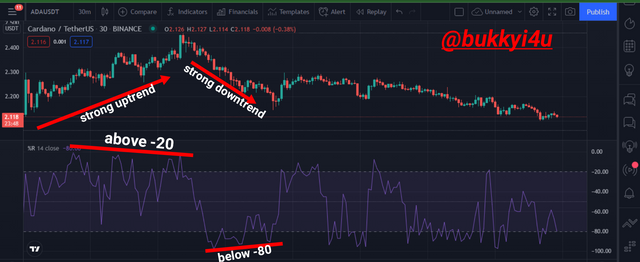
WPR indicator with ADA/USDT price action
From the ADA/USDT crypto chart above, the Williams % R tracks the price action of the crypto asset relative to the Tether USD. It indicates either bearish or bullish sentiments in the ADA/USDT market and currently records a value of -80 indicating a strong trend to the downside.

HOW IT IS CALCULATED

Normally, the indicator is set with a default period of 14 to indicate any other time frame or 14 days when dealing with the daily chart. The calculation for the indicator follows the procedure below:
Williams % R = (Highest Value - Latest Close) ÷ (Highest Value - Lowest Value) X (-100)
Where:-
Highest Value = the highest value indicated by the Williams % R for the asset in the period under review
Latest Close = the most recent close of the price (which is the latest daily close)
Lowest Value = the lowest value indicated by the Williams % R for the asset in the period under review
Example Calculation:-
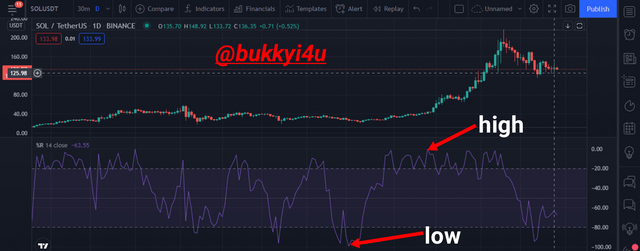
Calculating the WPR of an asset
From the SOL/USDT price chart above I set Williams % R to track 14 closing periods on the daily time frame. From the chart, within this period:
Highest Value = - 0.61
Latest Close = - 63.61
Lowest Value = - 99.37
Recall, that:-
Williams % R = (Highest Value - Latest Close) ÷ (Highest Value - Lowest Value) X (-100)
So, Williams % R = [-0.61 - (-63.61)] ÷ [-0.61 - (-99.37)] X (-100)
= 63÷98.76 X (-100)
= 0.6379 X (-100)
= -63.79 (close to the -63.55 given by the indicator. The disparity would be as a result of error due to parallax in getting my own reading)
Therefore, the Williams% R for SOL/USDT as at 28 September 2021 is - 63.73 and indicates that the asset is in a bearish phase.
THE BEST SETTING FOR THE INDICATOR
Actually, there is no known best setting for the indicator. However, its default setting is set to a period of 14 for any other time frame or 14 days while on the daily chart. This makes it possible for it to track the most recent 14 price closes. Nevertheless, you can tweak the settings in view of your trading style and strategy.
If you wish to trade on a longer timeframe you could consider using 21 periods. All the same, it is advisable to backtest its usage with different periods in order to discover what works best for you. Whatever be the case, it is best to use the indicator to make trading decisions when you have confirmed that a trend is actually in place or when the market is moving strongly in any particular direction.

2. How do you interpret overbought and oversold signals with The Williams %R when trading cryptocurrencies? (screenshot required)

Normally, this indicator works by moving between 0 and -100. If it reads a value that lies between 0 and -20, it signifies that the price of the asset is currently trading at its high point over the period under consideration. Conversely, if the indicator reads values between -80 and -100, it signifies that the price of the asset is currently trading at its low over the same period of time.
These areas are commonly known as oversold (-80 to -100) or overbought (0 to -20). In the overbought region price is believed to be overvalued while it is said to be undervalued in the oversold region. Consequently, reversals are expected in such areas although these labels of either overbought or oversold at such places could be deceiving sometimes.
What should be understood is that price is actually either trading near the low or the high of the period under review. The indicator showing either overbought or oversold signals under a short period which you may have set it to may not really be very accurate in predicting possible price reversal. From my personal experience, reversals may occur often when the signals for reversals are indicated over a longer time frame by the indicator.
So, you may not necessarily have to buy just because the indicator is showing oversold signals. In like manner, you may not necessarily have to sell just because it is showing overbought signals. This is because price action could remain in either oversold or overbought regions for quite a long time. This is more likely in the case that the trend is either strongly bullish or strongly bearish.
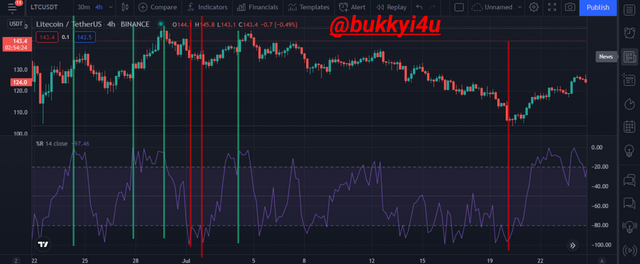
WPR overbought and oversold signals
From the LTC/USDT chart above, I have marked the oversold and overbought signals of the WPR with vertical lines. The green vertical lines represent overbought signals while the red vertical lines represent oversold signals.

APPLICATION IN TRADING

A good way to use this indicator in trading is to wait for overbought indications followed by a move back below the -50 mid-line. This gives a strong sell signal.
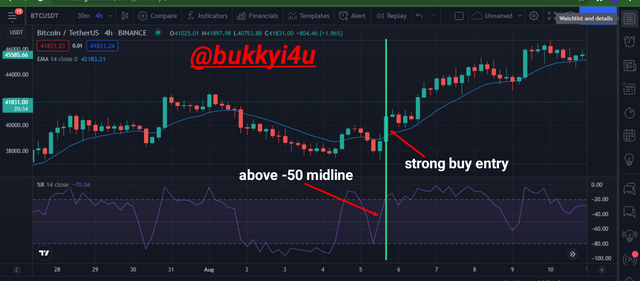
Also, you can wait for oversold indications followed by a move back above the -50 midline. This gives a strong buy signal.
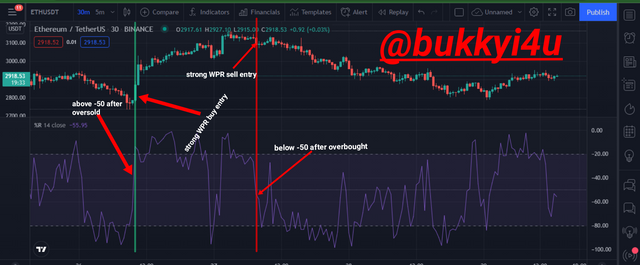
WPR strong buy and sell signals
From the ETH/USDT chart above I have marked buy and sell signals by green and red lines, respectively.
The indicator has been proven to work better under strong price moves. This is because usually such indicators as this would lag behind the price action. So, the indicator would give better signals when the movement of price action is large since the trader should still have some room for getting into the market even with a lagging signal from the indicator.

3. What are "failure swings" and how do you define it using The Williams %R? (screenshot required)

When trading, it is very important to trade with the trend. This is why it is said that, "the trend is your friend". However, it is very important that one watches out for early signals to indicate possible trend reversals in order not to be on the wrong side or trade against the trend.
One very critical potential trend reversal signal is an indicators' failure swing. It is very important because it shows a possible weakness in the current trend and signals the possible emergence of a new trend.
Important points:-
- Failure swing potentially signals a trend reversal
- It can be obtained in both bullish and bearish market conditions signalling selling and buying opportunities, respectively
- It is instrumental in telling possible current trend weakness and potential reversal
- Failure swing occurs in the Williams % R when the indicator fails to reach its - 20 line in an uptrend or reach its - 80 line in a downtrend
- The fail point refers to the place where the Williams % R indicator line falls to below the recent swing high and fails to go up any further, thereby triggering a potential sell signal
- Similarly, the fail point in a downtrend is the place above which the indicator's line remains and fails to go any lower above its recent swing low
- It is interesting to note that failure swings often create divergences between indicator and price action
So, failure swing in the Williams %R indicator refers to a situation whereby the indicator's line fails to get to iyt -20 line or fails to reach a previous swing high in an uptrend. Equally, it refers to a situation where the indicator's line fails to get to its -80 line or fails to reach a previous swing low in a downtrend.
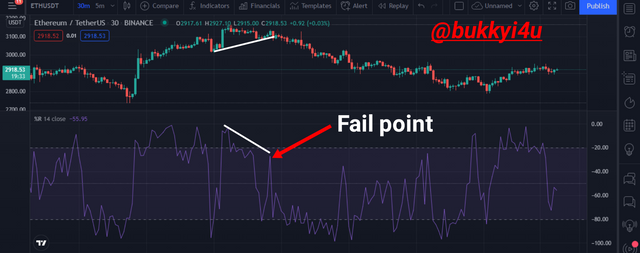
WPR failure swing
In the ETH/USDT chart above the price makes a swing high around 3142.87 and this coincided with the indicator creating a high around -3.93. the price further makes a lower high around the 3127.29 and this coincided with a fail point created in the indicator at around - 27.83.

APPLICATION IN TRADING
In trading with the failure swing, it is a general practice to leverage the signal to plan your exit or entry in the reverse direction. Generally:-
- If a failure swing occurs in an uptrend traders would have to sell off their long positions and enter short
- If it occurs in a downtrend then traders would have to close their short positions and enter long
- Usually, the aggressive traders would plan their entry when the second peak is formed coinciding with the fail point
*The less aggressive traders would often wait for confirmation with such indicators as the 21 period EMA before entering the market in the reverse direction
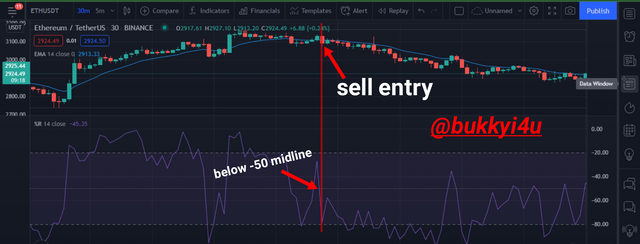
trading with WPR failure swing
For example, in trading the ETH/USDT failure swing earlier described in this section, a conservative trader will wait for the price to go below the -50 midline of the indicator and below the EMA 14 to take a sell entry. This coincides with the larger bearish candle formed beyond the second peak.

4. How to use bearish and bullish divergence with the Williams %R indicator? What are its main conclusions? (screenshot required)

Divergence is usually created between the Williams % R and price action in a situation where the two fail to follow the same pattern of movement. This means that while the indicator may create a high and a higher high, the price action creates a high and a lower high at the same time. Also, while the indicator may create a low and a lower low the price action create a high and a higher high.
BULLISH DIVERGENCE
A bullish divergence appears when the Williams % R indicates a new maximum point which is less shallow - higher - than the preceding one while the price chart shows a new or lower minimum point than the preceding one. The significance of this is to show that the bears in the market are becoming weak. Consequently, a rise in price is to be expected.
The point beyond the divergence where both the price action and the indicator begin to rise represent the exact point of buy entry, especially when confirmed with another suitable indicator.
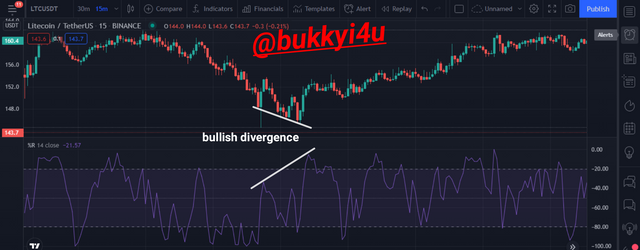
WPR bullish divergence
From the LTC/USDT chart above, price creates a low point around 151.1 and the indicator makes a high point around the same level. Price further creates a lower point around 146.8 and the indicator mix a new maximum or higher point than the preceding maximum. This created a bullish divergence which eventually resulted to an upward correction of the price action.
BEARISH DIVERGENCE
A divergence appears when the Williams % R indicates in new minimum point which is more shallow - lower - than the preceding one while the price chart shows a new or higher maximum point than the preceding one. The significance of this is to show that the bulls in the market are becoming a weak. Consequently, a fall in the price is to be expected.
The point beyond the divergence where both the price action and the indicator begin to fall represent the exact point of sell entry, especially when confirmed with another suitable indicator.
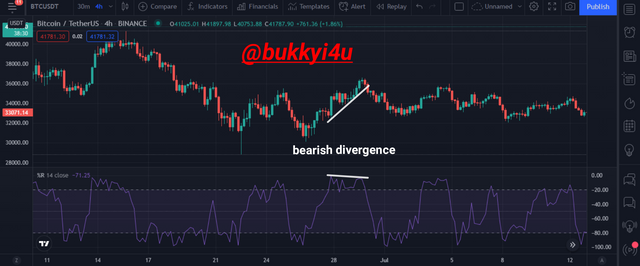
WPR bearish divergence
In the BTC/USDT price chart above, price makes a high point around 32894.87 and the indicator equally creates a high. Furthermore, price creates a higher point around 34223.99 and the indicator makes a lower minimum instead. Eventually, price corrects to a dowtrend as expected.

5. How do you spot a trend using Williams %R? How are false signals filtered? (screenshot required)

BEARISH TREND
Generally, the indicator is given values from -100 to 0. Also, upper and lower boundaries of -20 and -80 are indicated, respectively. When the price trades around the -80 line it indicates that the asset is in a bearish condition. If the price should eventually go below the -80 line, this would signify that the asset has gone below a fair value and has become undervalued under the period of time in view. Consequently, an upward correction of price action is expected.
If the price begins to move away from the -80 line to go above it, it shows a weakening downtrend. This can also show that an uptrend is already coming into place. If it eventually goes above the -50 line, it shows that the uptrend has gained much strength.
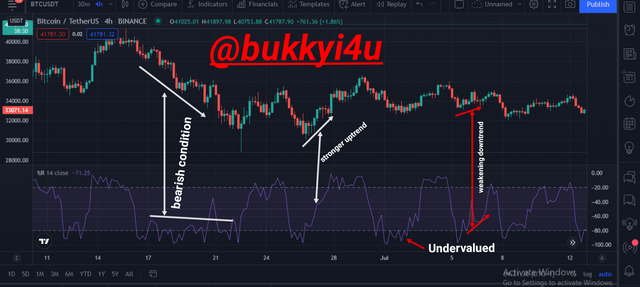
WPR in bearish trend
These scenarios are indicated in the price chart above.
BULLISH TREND
On the other hand, when the price trades around the -20 line, it indicates that the asset is in a bullish condition. If the price should eventually go above the -20 line, this would signify that the asset has gone above a fair value and has become overvalued under the period of time in view. Consequently, a downward correction of price action is expected.
Furthermore, if the price begins to move away from the - 20 line to go below it, it shows a weakening uptrend. This can also show that a downtrend is already coming into place. If it eventually goes below the -50 line, it shows that the bearish trend has gained much strength.
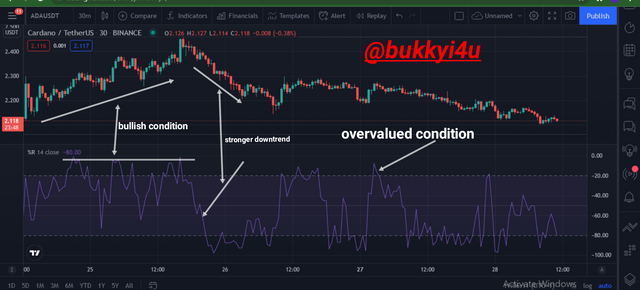
WPR in bullish trend
These scenarios are indicated in the price chart above.

FILTERING FALSE SIGNALS
In situations where the condition of the market is quiet, you are likely to get more false signals from the indicator. You could get a sell or buy signal and the price action does not follow the anticipated direction. So, rather than using the indicator to obtain trade signals it is better to use them to simply obtain indications that trend may have shifted.
Equally, it is very helpful to make use of price action analysis in order to reduce the number of false signals from the indicator. If you have observed a strong uptrend on the chart, then you should only be looking to enter buy trades when given by the indicator. In an observed strong downtrend, you should only be hoping to trade the sell signals of the indicator.
Moreover, since the indicator can be used to gauge market momentum, you should expect that in a strong downtrend price action should continually get to or go below -80 to show the strength of the trend. Whenever the price stops reaching or going below -80, you should understand that the trend is beginning to lose its strength while an uptrend is possibly imminent.
In a strong uptrend, the indicator should continually reach or go above -20. The absence of this signifies a weakening uptrend.
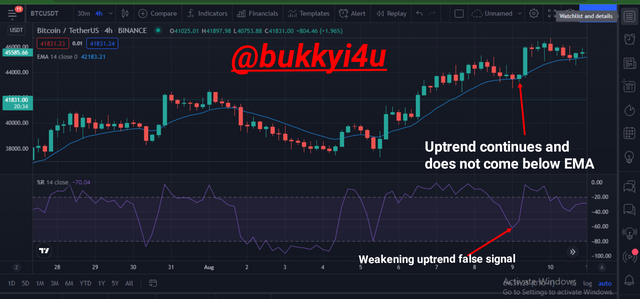
WPR false signal

APPLICATION IN TRADING
Apart from waiting for the indicator to move below or above the -50 midline in filtering out the false signals from WPR, the EMA 14 can also be used to determine exact points of entry. In this case you should either wait for price action to cross below the EMA for sell entries or above it for buy entries.
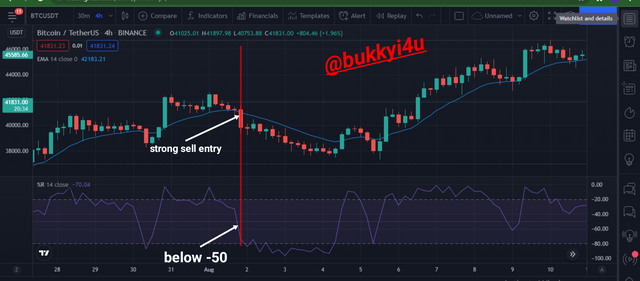
WPR with EMA sell entry
From the BTC/USDT price chart above the indicator had clearly shown that the price chart had moved away from a high swing of around 41896.06 and started going down up to around 41713.17. However, it was not until a strong bearish candle which formed around 40783.99 and which had clearly gone below the -50 midline of the Indicator before the EMA indicates a sell entry. Eventually this was a winning trade and offered profits up to around 38190.97.
WPR with EMA buy entry
From the same BTC/USDT chart above while the price action hard indicated a switch from a downtrend to an uptrend around 38192.38, it was not until it had gone above the -50 midline around 39335.58 before the EMA showed a buy signal.

6. Use the chart of any pair (eg STEEM/USDT) to present the various signals from the Williams %R indicator. (Screen capture required)

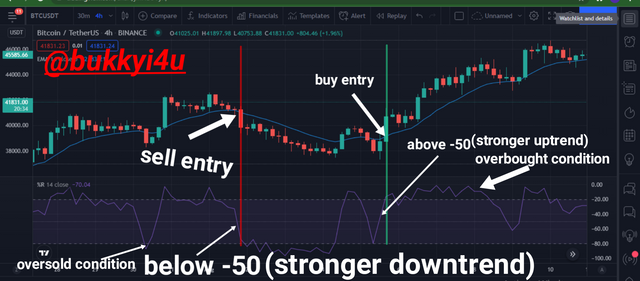
From the BTC/USDT crypto chart above, there are quite a number of signals presented by the Williams % R indicator as shown. These signals include:
- Oversold Condition: The asset starts with a weakening uptrend which gives room to a downtrend that grows stronger and finally enters a region below the - 80, indicating an oversold condition.
- Sell Entry: After the asset has traded momentarily in a short uptrend, it grows into a downtrend and the indicator shows a stronger downtrend with its line crossing below the -50 midline. This coincides with a strong sell entry (especially when confirmed with the EMA)
- Buy Entry: After the asset has traded in a downtrend momentarily it grows into an uptrend and the indicator shows a stronger uptrend with its line crossing above the -50 midline. This coincides with a strong buy entry (especially when confirmed with the EMA).
- Overbought Condition: Once the asset has started trading in a strong uptrend, the lines of the indicator start signalling an overbought condition by remaining above the -20 line for sometime.

CONCLUSION

The Williams percent range is an indicator which can be very instrumental in gauging the momentum of price action in a trending market. Usually, it is calibrated from -100 to 0 and follows the operational methodology of such other oscillators like the Stochastics. Readings towards - 100 shows a bearish condition while readings closer to -20 and 0 indicate uptrends with larger momentum.
Equally, the indicator is good in determining overbought and oversold conditions by showing readings above -20 or below - 80 in such situations. Failure swings created in this indicator help to indicate a trend which is losing its strength and gradually giving way to the emergence of an opposite trend. In trading with this indicator it is important to learn how to filter out false signals with the use of the 14 period EMA for better results.

(Unless otherwise indicated, all screenshots are taken from TradingView)

Hi @bukkyi4u
Thanks for participating in the Steemit Crypto Academy
Feedback
This is excellent work. Thanks for taking the time in demonstrating such a clear understanding of trading with the William %R indicator.
Total| 10/10
Downvoting a post can decrease pending rewards and make it less visible. Common reasons:
Submit