It's great to be back on the academy, and this is the season 6 week 1 of the great academy. The lecture was excellently delivered by @kouba01 and I have read and understood the lecture and without wasting much time, I will dive into the home work post for today


This post is all about crypto trading, using the Zig-Zag indicator that displays the current asset's price trend. You can gain value by following the zig-zag indicator's form.
A zig-zag indicator is used to identify the highest and lowest price points of an asset on a chart after which a line is drawn to join the coordinates identified. After the zig-zag indicator identifies the highest/lowest point, it connects the points with a new line.
When a swing high or a swing low occurs, traders can use the Zig Zag indicator to spot trends. The indicator calculates micro trends independently from the price movement of stocks and charts them on a line graph.
Unlike most trend-based indicators, the zig-zag indicator helps to base the random price fluctuation’s impact or effect in cryptocurrency trading and also tackles spotting price trends and changes in these trends.
Although it does not predict the future trends of an asset, the zig-zag indicator line can provide a traders with a sense of flagging potential support and resistance zones that might exist. The zig-zag line is a result of a price reversal that occurs when there is a certain percentage change from one swing high to another. This is often seen in markets, such as crypto markets.
Calculation of the Zig Zag Indicator
The zigzag indicator is calculated by using the parameters set previously. Zigzag creators have explained the calculation more easily through words than numbers. The indicator is simply charged with creating a line of varying size and direction on the trading chart based on maximum or minimum prices reached during the trade.
The deviation parameter determines the percentage of price fluctuation needed for the line to change direction. This parameter governs, among other things, how many changes in direction are made on the chart. Usually, this is not modified.
Two important things should be noted: first, you cannot take into account the last line drawn by the chart that is still being calculated as it will likely change numerous times before significantly moving and, second, only the closing price is taken as a reference (or example) since they work like this.


The zig-zag indicator has two main parameters, Deviation and Depth. The zig-zag indicator, along with the Deviation parameter, requires the Depth parameter to be set. The Deviation parameter allows you to determine if it’s a correction, minor fluctuation or movement in general, then select how many periods are necessary for classification.
Deviation refers to the minimum percentage of price movement of an asset that has to be created from the previous swing point before it can be validated. The default setting is 5% (+-), which means that the total percentage change in the price needs to move by at least 5%. Depth specifies what type of transition (a decline, rise, fall transition) it is on the zig zag
The Depth Parameter, which is also referred to as the Zig Zag indicator, determines the minimum amount of periods between for example a new high or low. The Depth parameter has a default setting of 10.
Configuration of Zig Zag Indicator
- login to tradingview.com and click on charts
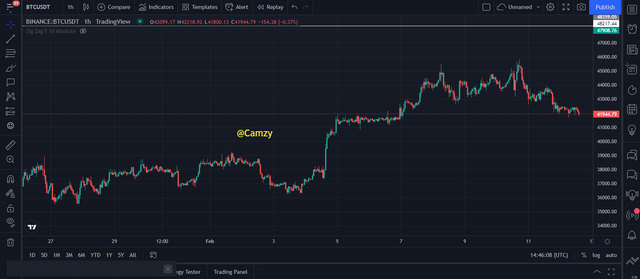
- click on indicators and the home screen will appear as you can see below
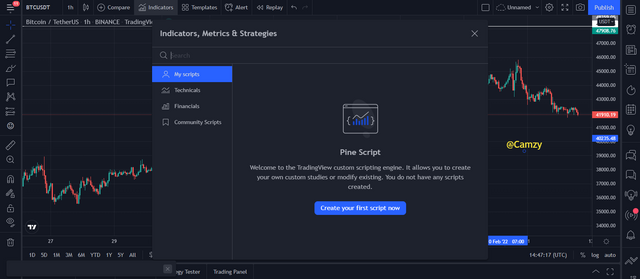
- search for the zig zag indicator and click on it
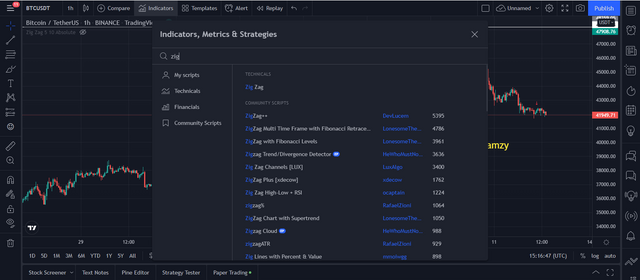
- we can see the zig zag indicator below
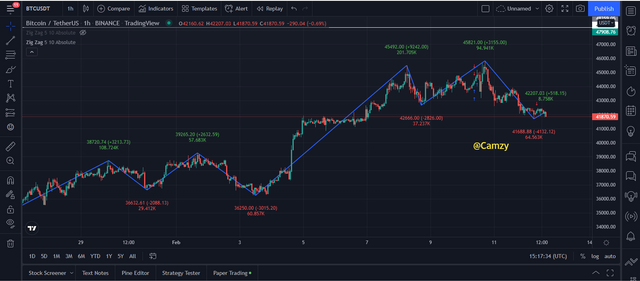
- In order to set the parameters click on settings and the dialog box will appear
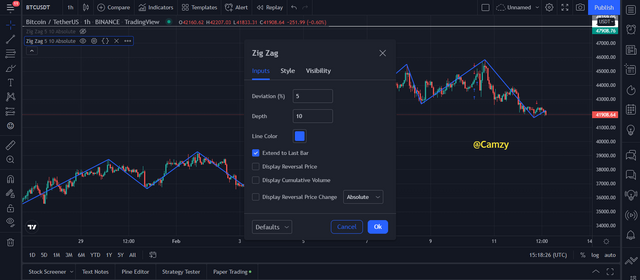
A trader should also know how parameters work to ensure they are correctly set for the trades at hand. For instance, if the depth parameter is too high for a trade on longer timeframes, it can lead to incorrect readings of the crypto chart.


The Zig Zag indicator can be used to identify the current trends of crypto assets in the market. Using it, a diagonal line is generated that joins successive highs and lows and aids in identifying any trends that may be occurring. You can easily figure out this pattern by looking at the general formula we mentioned earlier in the article.
In identifying the beginning of a trend, a zigzag indicator is used to find both highs and lows. In an uptrend, the zigzag indicator aligns with the price is starting up in a trade. In this case, we see that when a low is made above the previous low, it is also higher than the previous high is making a new high. When these two markers occur in correlation with each other then it denotes that there has been a strong upward movement.
Below is a good example
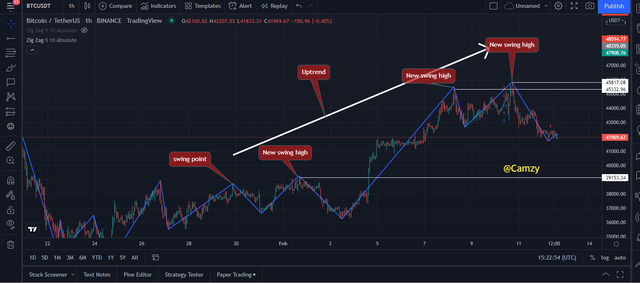
See the chart above. You can see that the new swing high is higher than the previous high going-into the trade, meaning that this is a bullish trend for this asset.
There are key features in the Zig Zag indicator that have proven to have predictive qualities, particularly when identifying a downtrend. When the new low of the down-trending price of an asset is lower than the previous low and that high is also lower than both previous highs then this is confirmation of a downtrend structure. As seen with our chart,
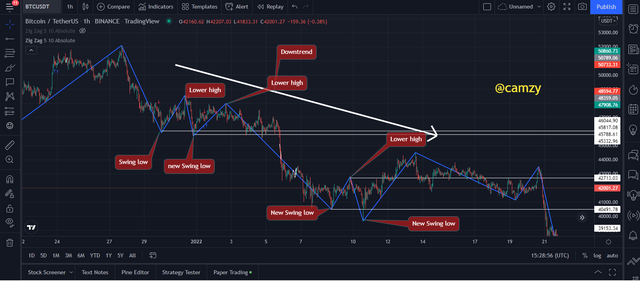
Crypto trading has never been easy, but using the ZigZag Indicator you can better optimize rates and lower your risk. let's dive into the procedures for a buy and sell orde
BUY ORDER
To execute a trade on a crypto using the Zig-Zag indicator, first find a good entry point by reviewing the price of the crypto on a chart before you attempt to buy. Once you find a new low higher than the previous low, place your buy order with your stop-loss below it. Here is an ideal entry example
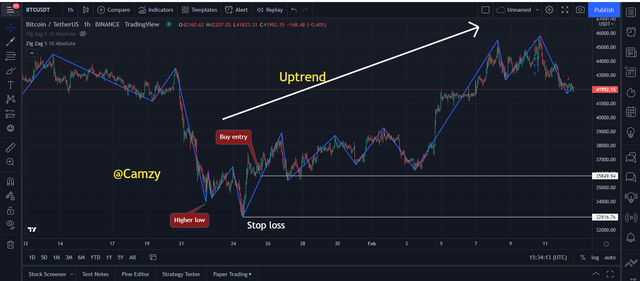
From the above chart, the buy order was placed with in distance of the high following higher lows in relation to the previous low. The stop-loss is also placed below the newly formed higher low.
SELL ORDER
There is an established pattern to use for crypto trading to employ. To execute a sell order, you should unload the crypto after the resistance plays out and the next selloff occurs. The stop-loss can be placed at the new high on the resistance
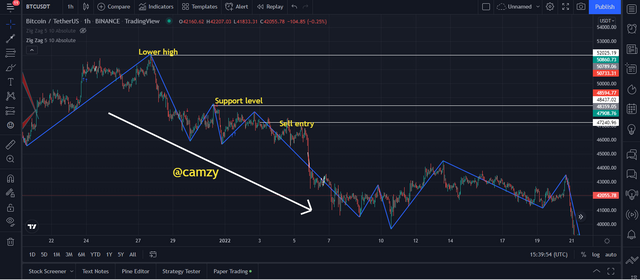
The chart below illustrates an example Zig zag indicator trade. By placing a sell order just after the formation of a high lower than the previous high and a stop-loss just above the new lower high, we reached our desired outcome: avoid losing too much at once.

Explain how the Zig Zag indicator is also used to understand support/resistance levels, by analyzing its different movements.(screenshot required)

Generally, you can spot support and resistance levels on crypto charts by monitoring the zig-zag indicator. These levels are important because they show where buyers and sellers reacted to prices of assets at those points in the past. The general rule of thumb is that if a support or resistance level is consistently met as a strong rally point, then it will stay as a level from that point forward.
With quantitative analysis and an implied buy and sell signal, the Zig Zag indicator is helpful for trading strategies. This strategy uses a series of retests to validate support and resistance levels.
IDENTIFYING SUPPORT
The Zig Zag indicator identifies the support level by plotting a series of horizontal low levels and re-bounces from those levels. A clear example of this is shown below on the chart.
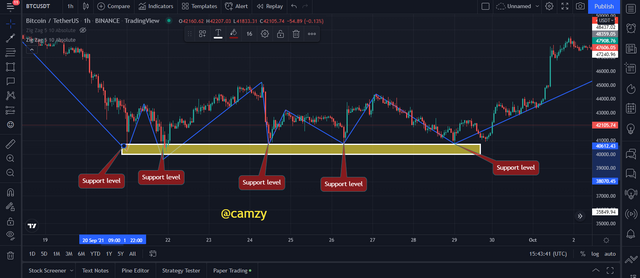
Using a zig zag indicator, the support levels have been identified and acted upon by rejecting the price at that level. These rejections have been followed after by multiple retests of the level before the price comes back to break the support
IDENTIFYING RESISTANCE
Crypto trading has never been easier with the help of effective indicators, such as Zig Zag. With this indicator, erratic market cycles have no effect on your cryptocurrency portfolio. By plotting a multiple or series of horizontal high levels then analyzing the resistance line, you can easily select which assets are leading:
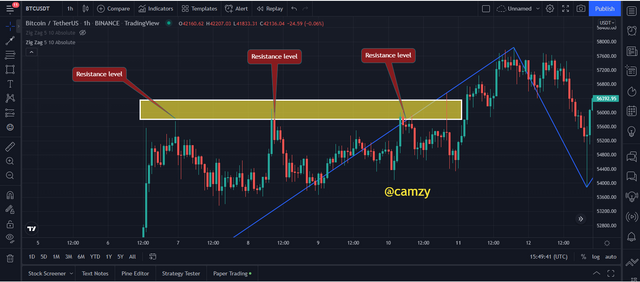
From the chart we can see that resistance levels have been identified by the zigzag indicator via a multiple of retests at that level, and then a rejection of the price of the asset at the resistance level was followed.


Zig Zag indicators can be used with Commodity Channel Index (CCI). To get the most out of using these tools, combine this indicator with other technical analysis methods.
The indicator we will use will be CCI with the zig-zag indicator to track and distinguish conditions while using intraday trades. CCI is an oscillation-based indicator, which illustrates overbought and oversold conditions in the price of a particular asset.
With the combined use of the zig-zag and CCI indicator, there is an easier way to know opportunities for buying and selling. By indicating a price break and CCI mark as well as the asset even matching the previous high or low, we can detect trends. Once we see this, we should remember that we should buy when the CCI also goes over 100 and sell otherwise.
BUY ORDER
This trading strategy is for a trader who wants to make home run trades with high rewards. In an uptrend, the trade only exists if the candle closes over the previous highs and CCI crosses at least above 100.
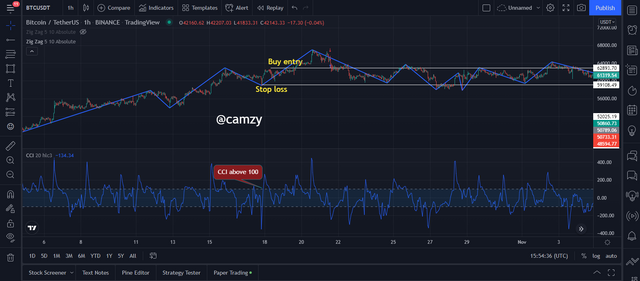
From this chart, we can see that when the asset closes with a higher high, and when CCI is above 100, it indicates a buy signal which is followed up with a buy order after the price has reached the next swing point. A stop-loss is placed below or in-between previous zig-zags on a condition that the distance between the breakout and low is seen to be at least 2x.
SELLING ORDER
As seen in the chart, the trade entry would only be considered if both the candle's closing price is below the previous low of the asset's price, and if the CCI indicator is beneath -100.
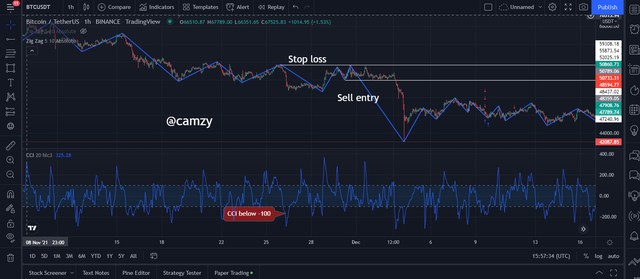
From the chart shown above, we can see that the price of the asset closed below the previous low at the same time CCI indicator is also seen to be below -100. When this occurs, sell signal is indicated and execute sell order whereby Take-Profit is placed closer to swing point, stop-loss position is fixed higher than previous high or fixed in-between recent zig-zag diagonal.


In this section, I will be looking at two different indicators with the zig-zag indicator to prove its usefulness in crypto trading.
Zig Zag & Fibonacci indicator
The Fibonacci retracement tool can help in determining the areas at which reaction occurs in the price of an asset. This is done with the use of the Fibonacci number sequence golden ratio (38.2%, )
When using the zig-zag indicator and Fibonacci levels, traders can identify trend changes, and vice versa. The Zig-Zag indicator should be set to point out the corresponding retracement zone as well as the Fibonacci zone it falls under. Before entering a trade, traders must look for a high or low within this zone, signaling which direction to make their trade. For an example of how this works, take a look at the provided chart.
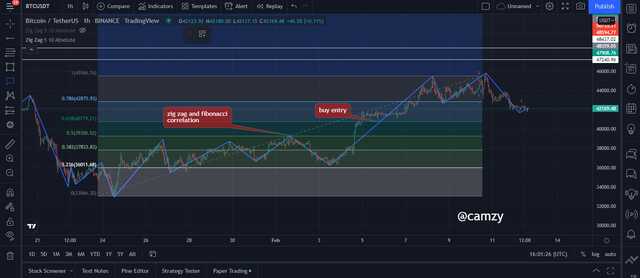
From the chart above the zig-zag indicator signals a bullish trend in the price of a crypto asset. Correlating this with Fibonacci levels, we can see an indication of a possible foray for straightforward increases. We wait for a candlestick formed that is higher than the previous high before initiating a buy order. The stop-loss is set below the low point formed before then adding a take-profit point back to the last higher high.
Zig-Zag indicator and the Moving Average
This is a trading strategy that involves two Moving Averages with one having a higher length/period setting than the other. From my example, the EMA 20 is indicated by the white line whilst the EMA 50 is indicated by the red line. At this point, when the white crosses above the red, it means there's an uptrend whereas when the red crosses above the white then it means there's a downtrend.
With the zig-zag indicator and MA, analyzing volumes of cryptocurrencies is even more accurate. We can use it to find swing high and swings low prices on the cryptocurrency charts, find the most precise buy or sell points, or just increase our overall accuracy on what coins are worth buying.
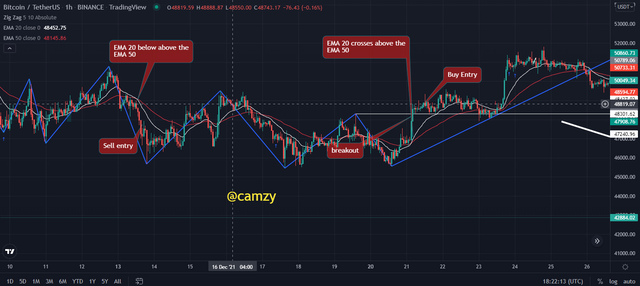
You can use the Zig-Zag indicator with the Moving Average Crossing indicator (20 and 50 EMA) to identify trends and spot out false signals.


ADVANTAGES
with the zig zag indicators, trends are identified faster
it gives a simple and easier identification of support and resistance
When determining prices based on historical data, traders often encounter noise in the market that is due to fluctuations in the asset’s price. However, using a Zig Zag Indicator can help eliminate such noise and benefit traders’ profitability.
The Zig Zag indicator is straightforward for novice traders to use to follow prices. It has remains popular because it enables you to switch between the bullish and bearish waves, signalling potential strength in the market.
DISADVANTAGES
The zig-zag indicator identifies current trends in a marketplace using a specific set of rules, but does not facilitate finding out other indicators such as momentum and regression shifting.
The Zig-Zag indicator is a simple yet powerful trend tool which can redraw the last stretch of an asset trading price with current trading prices. These actions cannot predict the next movement of a trading price without another supporting trend tool.


I would like to brief you on what has been done in this article. First of all, we discussed the concept of Zig Zag indicator and how its calculation is done. We also went on to look at the two main parameters of Zig Zag Indicator. The general idea was to go into detail about how these variables are configured.
The zig-zag indicator is a way to predict bullish and bearish trends in the market. We discussed how to use it with crypto charts for predicting broken trends.
There are additionally many efficient strategies covered in this post with an efficient way to learn these strategies with hands on research, rather than financial software. We also discuss how you can use the CCI indicator for Zig-zag to trade using different types of patterns. Finally, extra clues that you can use to detect signals are Fibonacci, RSI, and MA indicators which have no duration limitations.
All images are gotten from tradingview
best regards
@kouba01
Downvoting a post can decrease pending rewards and make it less visible. Common reasons:
Submit