

Technical indicators are powerful tools used in technical analysis. Examples include the RSI, MACD and ICHIMOKU CLOUDs. Combining technical indicators with other tools, or pairing them with different indicators, is one way they can be helpful in providing more reliable insights into price movements.
In this study, the RSI indicator is combined with the Ichimoku Cloud to form a trading strategy. The strategies signals can be confusing but they are useful in some circumstances. For example, when markets trend upwards and sideways, these types of indicators will not trigger any false positives.
The RSI and Ichimoku Cloud indicators often work together for traders. The Ichimoku Cloud indicactor is trend-based, helping traders to understand direction as well as spot future dynamic support and resistance. The lagging behind price often helps traders make more informed decisions.
Combining the RSI and the Ichimoku indicator forms a powerful trading strategy that can identify two key components of price movement: direction and a pending trend change. This means that traders are able to make an early entry into the market with minimal risk in order to give themselves greater potential profits.


FLAWS of RSI
Learning to trade with relative strength index is crucial. The RSI measures the strength of buyers and sellers and it will stop losing momentum on a certain side this allows you to find trends rather than just gambling. A reading below the 30 threshold indicates that price has gone too far highly oversold, while a reading above 70 indicates that prices have gone too far high overbought.
For instance when the chart is in an overbought region above the 70 mark, it indicates a bearish reversal and when it is in an oversold position, it indicates a bullish reversal limiting the RSI for only detection of the trend but not the strength of the trend.
look at the chart below for a better exam
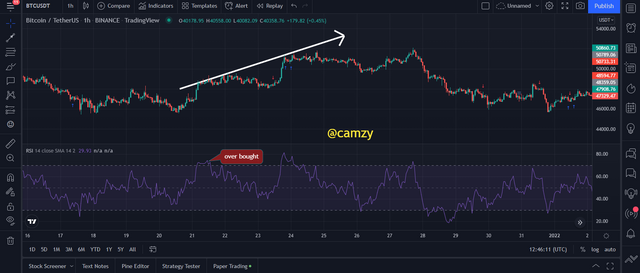
from the chart above, we can see that the RSI could detect the overbought as a high bullish trend in the market but couldn't detect the strength of the trend as it continuous upward.
FLAWS of ICHIMOKU CLOUD
Ichimoku Cloud is a trend-based indicator, developed by Goich Hosoda in 1968. It identifies trends, momentum, support, and resistance, as well as trading signals in the market with its 5 lines of moving averages.
Ichimoku cloud is a trading strategy with future support and resistance levels which helps notify traders of reversals. Break throughs of the clouds mark trends going in a new direction, giving you an opportunity to open up in that direction.
Ichimoku cloud lags behind the price which is not an indication for an early entry just like the moving average, let's look at the image
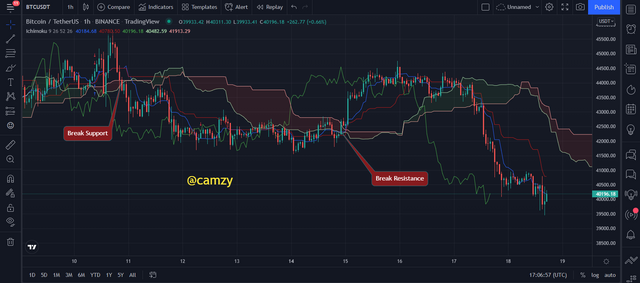
The chart above reveals how only after price has jumped do the Ichimoku signaling a bullish trade to take place. The trend signaled by the Ichimoku is at the end of it’s curb. Sometimes, timing is tricky with both momentum and the Ichimoku and sometimes they coincide too soon while other times they strike on different sides of the market.
You can also, in sideways markets, note Ichimoku Breakouts without an accompanying trend. This is depicted on the chart above.


there are majorly two trends which are the bullish and bearish trends, we will be using this strategy to determine the two types of trends.
BULLISH TREND
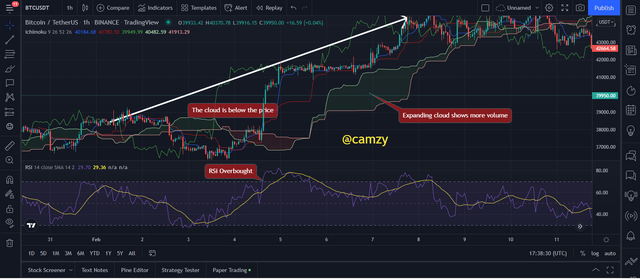
For a bullish trend, the RSI is seen above 70 indicating that the asset is in an overbought region, which can indicate a possible reversal or a strong bullish trend. however, we can detect a bullish trend if the price is trading above the ichimoku cloud and the volume can be gotten by the size of the cloud indicating that the buyers are in full control. look at the image below
BEARISH TREND
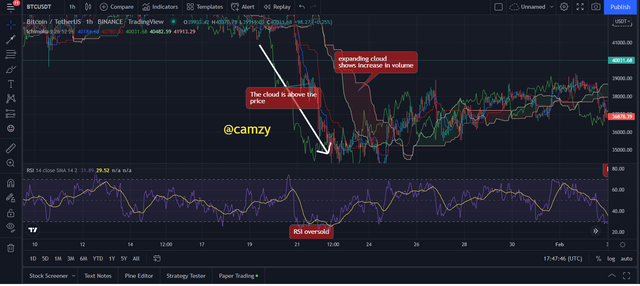
For a bearish trend, the RSI is seen below 30 mark indicating that the asset is in an oversold region, which can indicate a possible reversal or a strong bearish trend. however, we can detect a bearish trend if the price is trading below the ichimoku cloud and the volume can be gotten by the size of the cloud indicating that the sellers are in full control. look at the image below


Using the MA together with the RSI + ICHIMOKU is a great choice of indicator as this helps to increase efficiency and deliver accurate results better. the moving average is a trend based indicator and when the price is trading above the MA it shows a bullish signal vice versa when the asset is trading below the MA it indicates a bearish signal.
for this section we will be using the 85 MA to help filter noise better
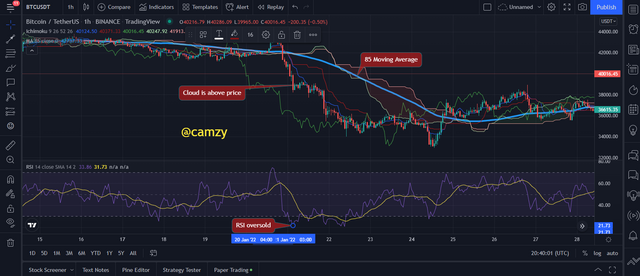
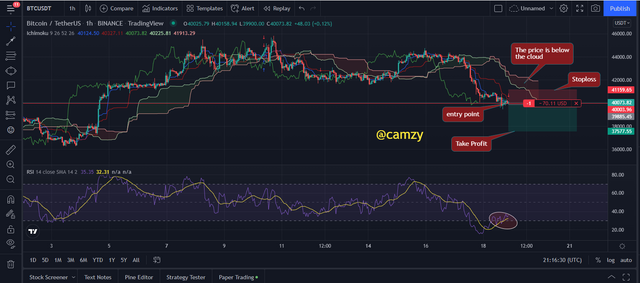
From the chart above we can see that the price is below the MA and the ichimoku cloud and also in confluence with the RSI showing oversold indicating the sellers are in control of the market. working with the 3 indicators creat a better entry environment.


In this strategy, we will see how to identify support and resistance with ICHIMOKU CLOUD & the RSI. A trending market sees support and resistance levels in abundance, making it easy to spot. However, a ranging market has more nuances and requires one to use the RSI for the same success.
LET'S LOOK AT A TRENDING MARKET
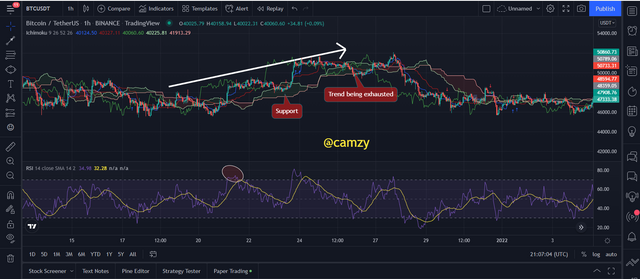
Different attributes of the Ichimoku cloud signal trends. In an uptrend, the trend finds 'support' on the Ichimoku Cloud. Conversely, in a downtrend, the trend finds resistance and we can see resistance in this cloud. Similarly, when price is near the cloud it forecasts a weak or no trend and when prices are not near any part of the cloud, it means that there is a strong trend being followed.
A break of the cloud signals a trend reversal. An example can be seen on the chart below. Trend followers will profit from both the trading-opportunities and reduce downside potential. The ICHIMOKU is used primarily for its trend-following abilities, as well as to identify support and resistance levels.
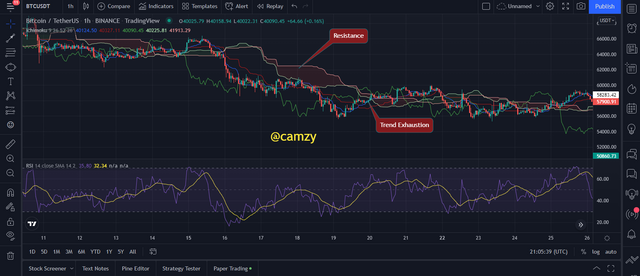
RANGING MARKET
In a ranging market, the Ichimoku does not provide accurate trading signals. To make this strategy more accurate, we will be using the Relative Strength Index (RSI). The RSI overbought and oversold regions allow the trader to spot price reversals. There is a distinct difference between RSI overbought and RSI oversold markets. This allows new investors to make intelligent decisions when purchasing a stock.
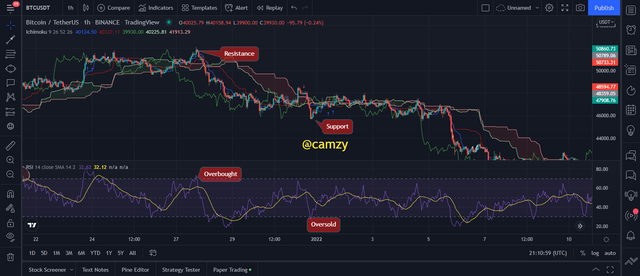
From the chart above, we can see how the RSI served as a support and resistance using the oversold and the overbought region. If you are looking to trade based on supply and demand dynamics then you can modify this range to suit your style.


Every trading strategy is good if used to its full potential. In this article, I discuss one of the best strategies we have. The strategy discussed can be applied to any trading system and is effective in both trending and ranging markets.
Using the RSI and ICHIMOKU CLOUD indicator for intraday trades can be simple because of their use of the MA. Its filtering capabilities help it to detect false signals as well as price manipulation. So definitely it is good for intraday traders.


BUY ORDER
For a buy order as we can see in the chart below, on a SHIB/USDT chart with a 5mins time frame the price broke through the ichimoku cloud, and proceeded upwards, I observed that the RSI was above 50 indicating a bullish movement, I placed my stop loss and take profit at a 1:2 RRR to ensure maximum profit and I placed my trade
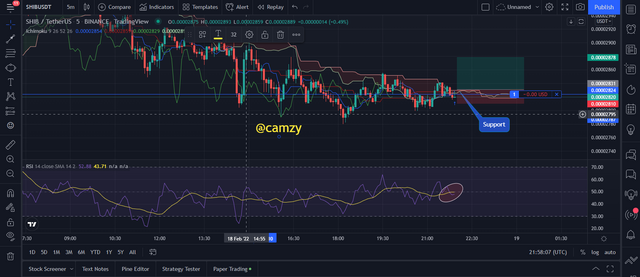
below is my initiated order position for a buy.

SELL ORDER
For a sell order as we can see in the chart below, on a BTC/USDT chart with a 5mins time frame the price broke through the ichimoku cloud downwards, and proceeded downwards, I observed that the RSI was in an oversold region indicating selling pressure on the asset, I placed my stop loss and take profit at a 1:2 RRR to ensure maximum profit and I placed my trade


This trading strategy combines RSI and Ichimoku to help traders filter out false signals. The strategy can generate trade signals in both trending and ranging markets which means the trader might avoid missing a trade because of the reverse context effect.
This strategy relies on the trader's style, as well as their configs of RSI and ICHIMOKU CLOUD. If a trade goes badly, the importance of following proper risk management should be emphasized.

ALL UNSOURCED IMAGES REFERENCE TRADINGVIEW

Best regards
@abdu.navi03
