Hello everyone, I’m very excited to take part of week 8 season 3 of the steemit crypto academy. This week’s lecture was on another practical work which will help us in our daily trading. The on SHARKFIN patterns was delivered by professor @cryptokraze and I decided to try my hands on the given task.
1 What is your understanding of Sharkfin Patterns. Give Examples (Clear Charts Needed)
SHARKFIN PATTERN
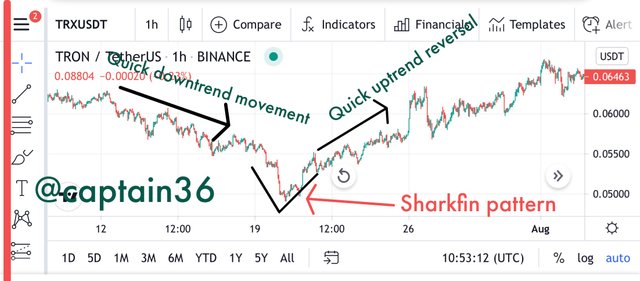
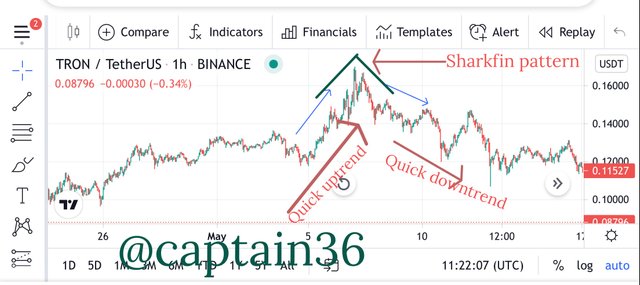
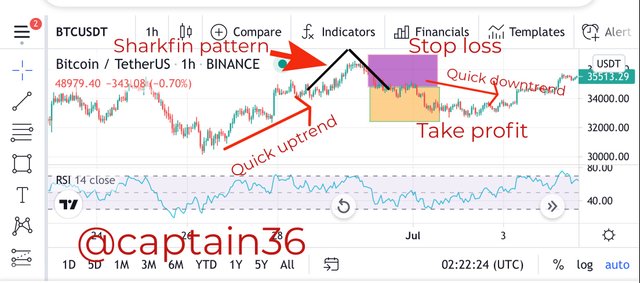
In the normal movement of market prices, we see that the market trend moves upward and downward in quick succession. This means uptrends and downtrends form after one another very quickly. These quick price reversals make us notice V-shape and inverted V-shape patterns after the quick change.
- When a downtrend changes to an uptrend very quickly, we notice a V shape pattern.
- on the other hand, when there is a quick change from an uptrend to a downtrend, an inverted V shape is noticed.
2 Implement RSI indicator to spot sharkfin patterns. (Clear Charts Needed)
Spotting the sharkfin patterns is one thing, but knowing as to whether they are strong enough for us to either enter the market or exit the market is not easy. We need to add some indicators to make it much easier for us to determine the strength.
As professor has recommended, we will be using the Relative Strength Index (RSI) for this experiment.
We will set up the RSI indicator with a length of 14 and band region of 30 and 70.
Downtrend reversal
In the case of the downtrend reversal, we wait for the the RSI to move below 30 level and then be reversed quickly again to come above the 30 level again. When this happens we can clearly see the V shape in the indicator. This shows that the strength of the sharkfin pattern is confirmed.
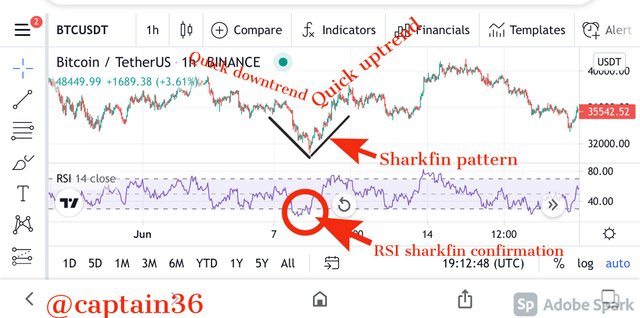
Looking at the chart above, the price moved below 30 but reversed very sharply and go above 30 again. This shows that the RSI has confirmed the sharkfin pattern.
Uptrend reversal
In the case of the uptrend reversal, the RSI must move above 70 and then make a quick reversal downward then move below 70 again. An inverted V shape will be formed which confirms the sharkfin pattern. The pattern will be formed on both the chart and on the RSI indicator.
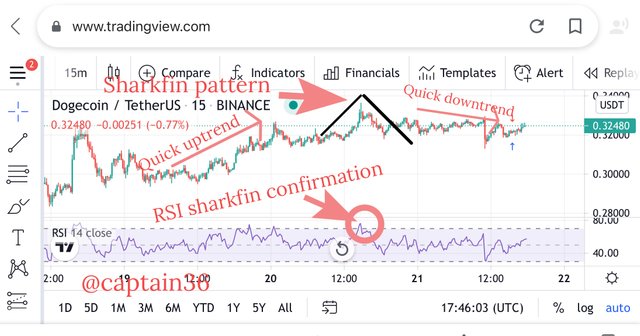
Looking at the chart above, the price moved above 70 and made a quick reversal again. This means the RSI has confirmed the sharkfin pattern.
3 Write the trade entry and exit criteria to trade sharkfin pattern (Clear Charts Needed
Trade entry criteria
Entry criteria is very relevant for every trader to know before entering a market. In this lesson we will talk about the trade entry criteria for sharkfin patterns. Sell positions and buy positions will both be considered.
Buy position entry
Steps involved
we start by adding the RSI indicator and leaving it at default settings.
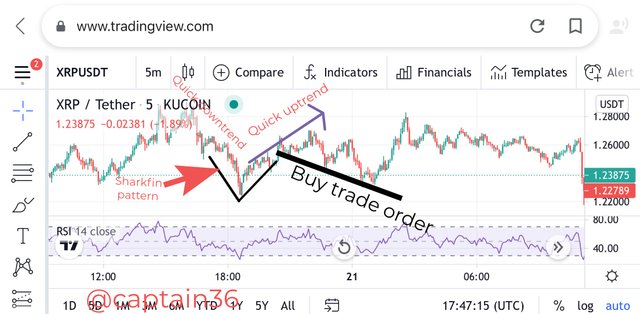
we observe the trend to see when the market makes a move and then reverses very quickly to form a V shape pattern.
For us to confirm this pattern, we have to read the RSI indicator. We have to be sure that the RSI went below 30 and then quickly rised above 30 again. And then the V shape is formed.
Then you can place your order after ensuring that the RSI has moved above 30 convincingly.
We must note that we have to allow the RSI to move clearly above 30 before we enter the market. This because the the RSI could move well below 30 again in order to set off properly to rise above 30. We must be careful.
Sell trade entry criteria
Steps involved
Again we start by adding the RSI indicator and leaving it at default settings.
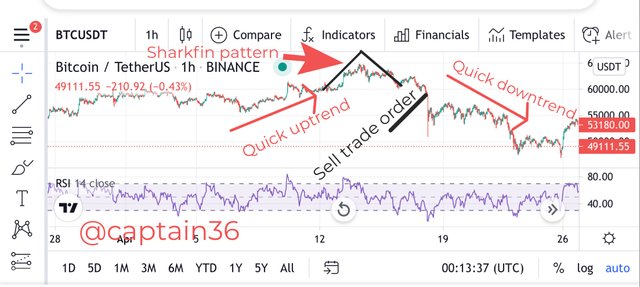
we observe the trend to see when the market makes a move and then reverses very quickly to form an inverted V shape pattern.
For us to confirm this pattern, we have to read the RSI indicator. We have to be sure that the RSI went above 70 and then quickly fall below 70 again. And then the Inverted V shape is formed.
Then you can place your sell order after ensuring that the RSI has moved below 70 convincingly.
We must note that we have to allow the RSI to move clearly below 70 before we place the sell order. This because the the RSI could move well above 70 again in order to be in proper position to fall below 70. We must be careful.
Trade exit criteria
We place stop loss and take profit levels when we are dealing with trade exit criteria.
Buy trade exit criteria
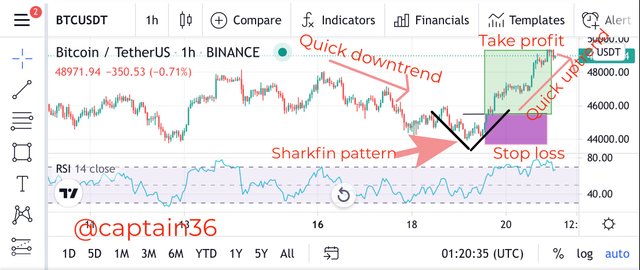
To prevent the trade setup from going totally wayward, we set a stop loss below the swing low point of the sharkfin pattern. This is to prevent loss. The setup is invalidated in case the price cross the stop loss level.
We also anticipate that the market can go in a direction that favors us. Because of this we set a take profit level. The take profit ratio should be 1:1 RR. It can also be 1:2 or 1:3.
Then we can decide to remove our profit and exit the market when the price touches the take profit level.
Sell trade exit criteria
Because the trade setup can go wrong, we will set a stop loss above the the swing low point of the sharkfin pattern. The whole setup will be made invalid if the prices crosses the stop loss level set above.
Then we’ll also set a take profit level. The take profit level will have a ratio of 1:1 RR. 1:2 and 1:3 are also good ratios. We can exit the market when the price touches the take profit level. It means we will leave the market at this point after gaining profit.
4 Place at least 2 trades based on sharkfin pattern strategy (Need to actually place trades along with Clear Charts)
TRX/USDT
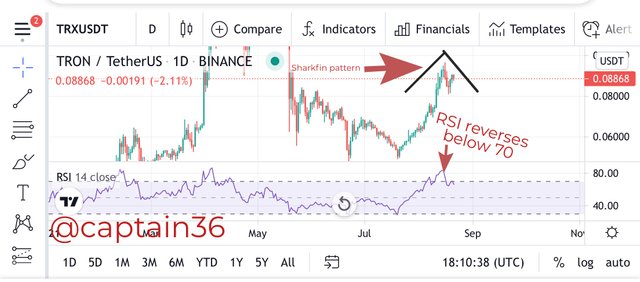
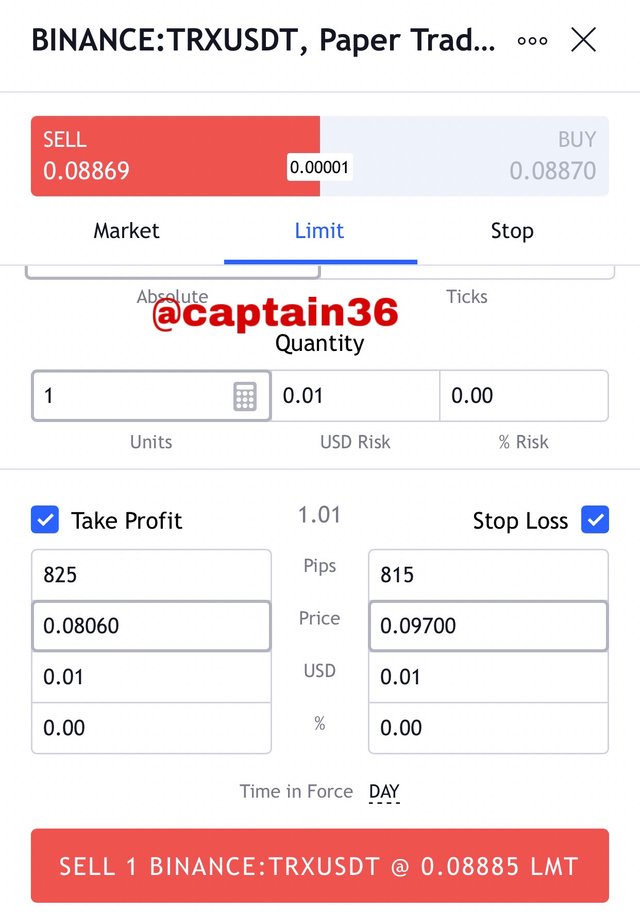
The above is an example of a TRX/USDT. We observed an upward movement and the presence of a sharkfin pattern as well. The RSI indicator confirmed it. I then decided to place my trade at the point of the bearish candle with a take profit of 1:2 RR.
TEL/USDT
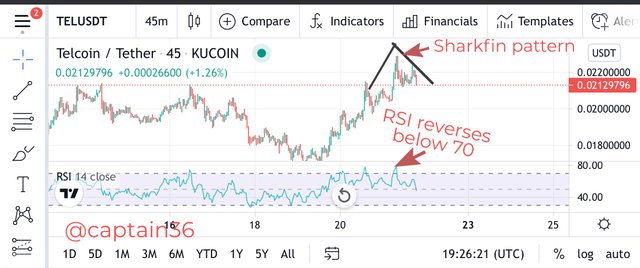
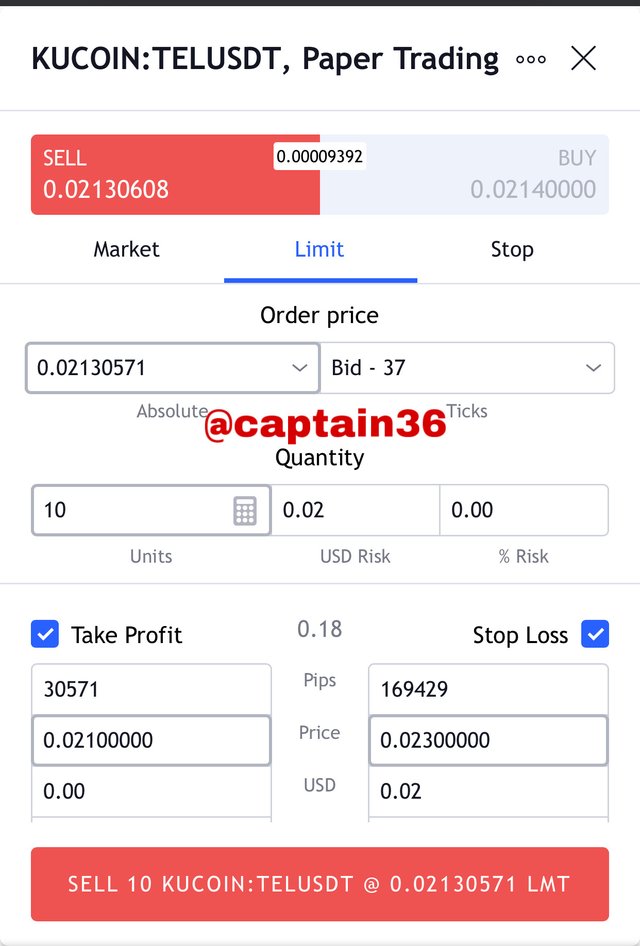
The above chart is a TEL/USDT chart. I noticed a sharkfin pattern and confirmed it with the RSI indicator . The sharkfin pattern happened immediately after a bullish trend. I then decided to place my trade at the point on a bearish candle at a take profit of 1:2 RR.
Conclusion
The sharkfin pattern is basically a trend reversal pattern. It depends on the quick change in the direction of trends to come up with its trade setup. The sharkfin pattern is best used with indicators such as the RSI indicator to its operation much easier.
To avoid any calamity in the market, it is proper that we set a stop loss and take profit level so we exit the market when it’s not moving in our favor or when we make profit. It is advisable to use a stop loss ratio of 1:1. However we can also use 1:2 or 1:3.
Thank you professor @cryptokraze for the detailed lecture you delivered.