Hello everyone, this is week 6 of this season’s crypto academy. This week’s lecture was on trading liquidity level delivered by professor @cryptokraze. The lecture was very detailed and understandable and I’ve decided to try my hands on the given task.


1 - What is your understanding of the Liquidity Level. Give Examples (Clear Charts Needed)
Liquidity levels in trading are the major points on a chart where there is a quick reversal of the movement of prices of assets from a particular direction to the opposite direction to reflect the actions of buyers and sellers around that point. Resistance and support areas often gives an indication of liquidity levels. These liquidity levels are either captured immediately above the resistance level or immediately below a support level. These liquidity levels are the consequences of stop loss, take-profit levels or pending orders established around the affected points.
Top investors such as banks use liquidity levels to influence the direction at which prices move. These investors do this due to the concentration of the volume of prices of assets around these points of liquidity levels.
XRP/USD chart
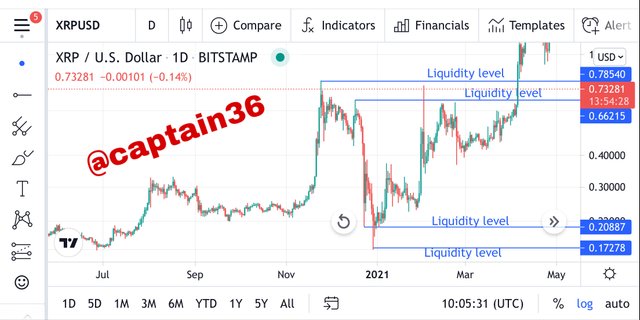
Screenshot: Tradingview
In the chart above, the areas where the sharp changes of the trend occurs are pointed, these areas are where liquidity levels occur. Top investors usually initiate this liquidity levels movement in order to catch the attention of small investors. The small investors could join at the time the large investors are also withdrawing their profits which will change the trend of the market quickly again living the small investors with the possibility of a loss. This kind of action is called fakeout of the movement of prices of assets.
Liquidity levels are grouped into high liquidity levels and low liquidity levels. Whether a liquidity level is high or low, is determined by the quantity of assets traded within that point on the chart.
At the point of high liquidity level, there are large-bodied candles that indicates the quantity of trades make at that point whilst in the area of low liquidity level, the candles they form at that point are small-bodied indicating small quantity of trade made at that point.

2 - Explain the reasons why traders got trapped in Fakeouts. Provide at least 2 charts showing clear fakeout.
Traders are usually caught in fakeouts because they rush into the market when they realize that there is a break in liquidity levels of the prices. They don’t actually know that large investors are responsible for the sharp rise of prices by investing largely into the market to break the liquidity mark. When these small investors join the market, the big investors will reverse their trend of investment and gain high profits as a result. The market will then return to it’s normal direction of movement creating a dilemma for the small investors. When this happens it is called a fakeout.
BCH/ USDT 1D chart
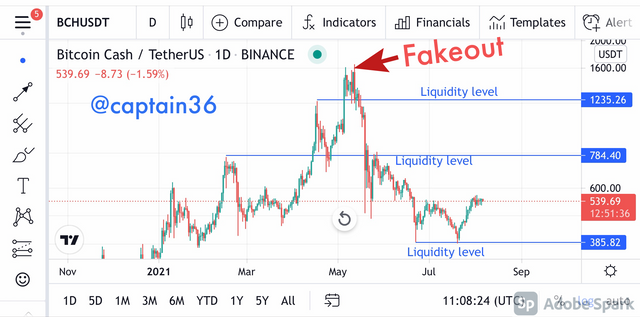
Screenshot: Tradingview
XRPUSDT 1 Day chart
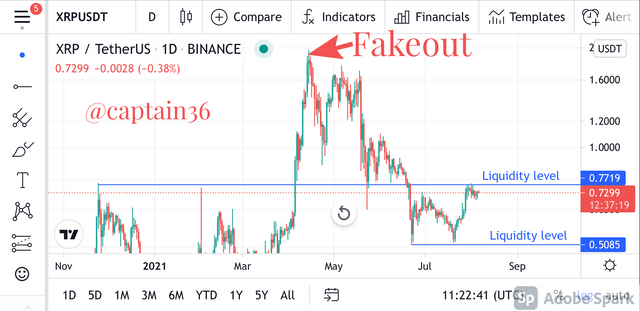
Screenshot : Tradingview
From the two charts above, it is clear that the fakeout happened after there was a break in a very high liquidity level. Traders who joined the market at this high point do not realize that the large investors will sell large amounts of their assets at that point to earn more profit hence the small investors will be caught by the fakeout when the market resumes to it’s normal movement.
So small investors should wait to confirm whether a breakout is genuine before they can enter the market else they will always be caught in a fakeout.

3 - How you can trade the Liquidity Levels the right way? Write the trade criteria for Liquidity Levels Trading (Clear Charts Needed)
Good traders use trend confirmation to trade liquidity levels the right way.
These trend confirmations exist in two forms namely;
Trend Reversal (MSB)
Trend continuation (BRB)
Each of these two also have two different procedures. These are the confirmation procedure and the exit and entry process.
In this scenario, the trend of the price of the asset is expected to change and move in the opposite direction when it touches the area of the liquidity level. After reaching the liquidity level, the trend reverses and go back to follow its old trend.
Confirmation criteria
The price of the asset must move towards the liquidity level. If it touches the liquidity level, there will be a fakeout or a change in the direction of the price.
After the price has reversed, a downtrend or an uptrend will be formed. The downtrend or uptrend will depend on the new direction of the price after the fakeout.
After this a neckline of market structure will be drawn. The extent of the neckline will indicate the trend change confirmation.
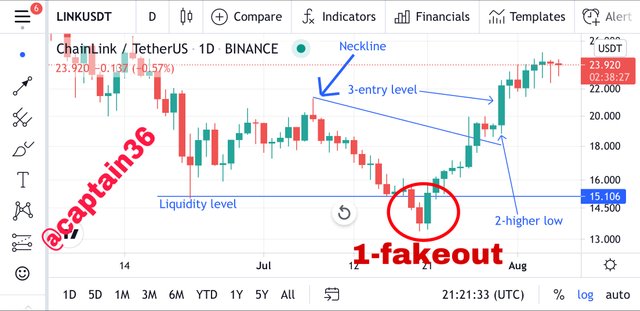
Screenshot: Tradingview
Entry and exit criteria
When the price is able to break the market structure neckline, that’s the time we have to enter the market.
looking at the diagram above, there will be two points of exit.
The points immediately below or above the liquidity level is where the stop loss will be put depending on the direction of the trend. It is placed opposite to the direction of the trend.
Then lastly, we follow the direction of the trend and remove our take profit. We do this by following the ratio 1:1 RR (Risk:Reward)
Trend continuation (BRB)
In BRB, we are looking forward to a break in the liquidity level and hence the continuation of the original trend.
Confirmation criteria
The price of the asset will break the liquidity level. Then there will be a swing level and price retracement.
Then it should reach the liquidity level, retest and follow the old trend again.
There is a line called the swing level. The price must break this line.
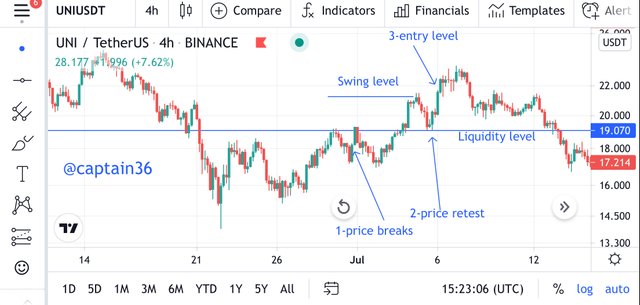
Screenshot: Tradingview
Exit and entry criteria
when the price breaks the swing level, then that’s the point to enter the trade.
Stop loss and take profit are the two exit points.
we then check the direction of the trend and place the stop loss in the opposite direction of the trend. The stop loss is place immediately below or above the liquidity level.
Then we follow the ratio 1:1 RR to remove a Take profit.
We ensure that it is in the same direction as the trend.

4 - Draw Liquidity levels trade setups on 4 Crypto Assets (Clear Charts Needed).
Chart: LTC/ USD 1H
BRB 1:2 RR
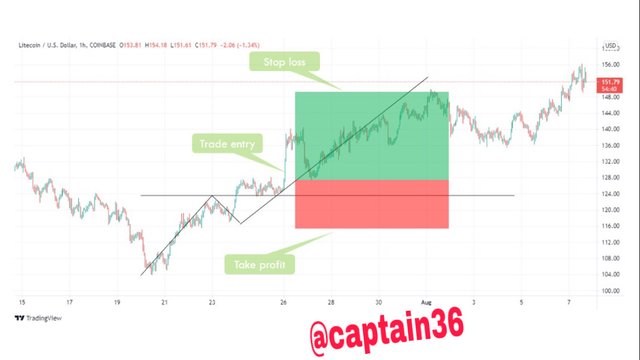
Screenshot : Tradingview
Chart: BCH/USDT 1H
BRB: 1:2 RR
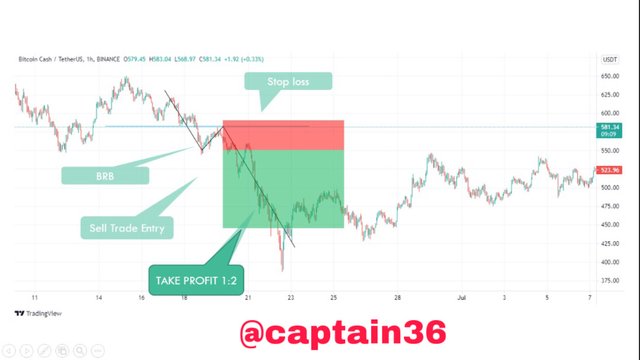
Screenshot: Tradingview
Chart: BNB/USDT 1H
MSB 1:1 RR
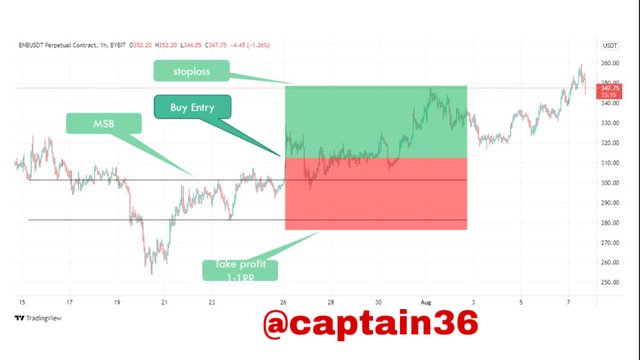
Screenshot: Tradingview
Chart: Steem/USDT 1H
MSB 1:1 RR
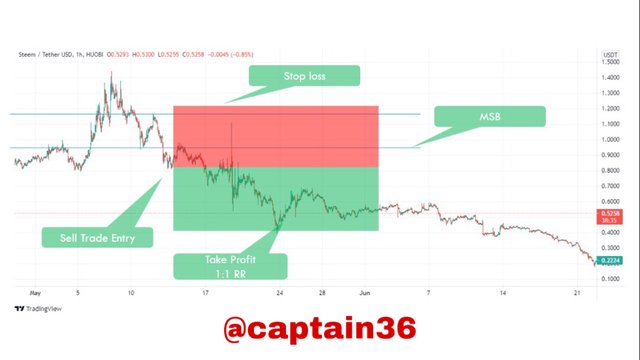
Screenshot: Tradingview

Thank you professor @cryptokraze for this detailed lecture.
Thank you professor...I’ll improve in the subsequent tasks
Downvoting a post can decrease pending rewards and make it less visible. Common reasons:
Submit