Hello, this is week 7 season 3 of the steemit crypto academy. Today’s lecture was on the ADX indicator and the lecture was delivered by professor @kouba01. The class was very detailed and after my good understanding, I want to try my hands on the given task.
1. Discuss your understanding of the ADX indicator and how it is calculated? Give an example of a calculation. (Screenshot required)
ADX is an acronym for Average Directional Index. This is an indicator which was introduced in 1978 by J. Welles Wilder. The purpose of introducing this indicator was to check the strength of a trend. After identifying a trend with other indicators, the ADX indicator is then used to check whether the trend is strong enough for one to trade in that direction.
The ADX indicator helps us to avoid entering a market on a weak trend. Every trader wants to enter a market after identifying a certain trend, but the ADX will let us know whether the trend is good enough for us to enter the market. This makes it a very relevant indicator because when a trend starts, it determines the strength of the trend for us.
ADX Structure
The ADX indicator is made by combining two different indicators to get one single ADX indicator. The outcome of the two combined indicators is then processed to obtain the ADX indicator. The formed ADX indicator becomes a single line with a color that the user chooses. The positive directional indicator(+di) and the negative directional indicator(-di) are the two indicators that are combined to form the ADX indicator. The directional system movement indicator emanates from these two indicators used with the ADX.
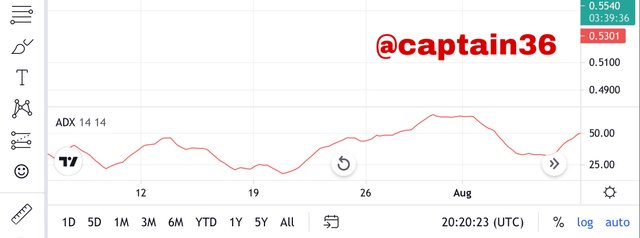
Screenshot: Tradingview
When the DI+ and DI- indicators are added to the ADX, this is how the structure looks like:
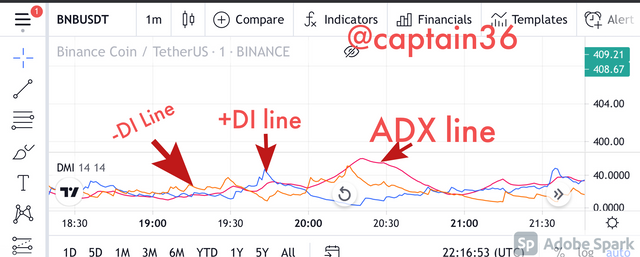
The total width of the ADX indicator ranges from 0 to 100. There is also a sub division of different ranges within this given range. These ranges are as follows:
0-25 = weak trend in the market or no trend at all.
25-50 = there is a trend present in the market
50-75 = a relatively strong trend
75-100 = a very strong trend and the trend is at its peak level.
25 is the benchmark for the ADX indicator. When a trend is below 25 it means that it is so weak that a trader is not supposed to enter the market.
How ADX is calculated
For us to be able to calculate the ADX, we need the +DI and -DI values. And for us to obtain these values, we also need the +DMI and -DMI values too.
Obtaining +DMI and -DMI values
+DMI = Current High - Previous High = CH - PH
-DMI = Previous Low - Current Low = PL - CL
After obtaining the +DMI and -DMI values, we then need the True Range value(TR) to be able to find the +DI and -DI values.
The true range calculation requires three different arithmetics. These are :
Current High (CH) - Current Low (CL)
Current High (CH) - Previous Close (PC)
Current Low (CL)- Previous Close (PC)
True Range (TR) = MAX (|CH - CL|; |CH - PC|; |CL - PC|)
We can now proceed to calculate DI+ and DI- values. The DMI and TR values are needed to obtain these values.
+DI = DMI+/TR
-DI = DMI-/TR
After the +DI and -DI values have been found successfully, we can now calculate our ADX which is obtained when +DI and -DI are blended. After they are blended, the data smoothes with the moving average in order to know the strength of the trend. We need the DX value for n periods that smoothes the result.
Calculating DX
DX =[(|+DI−|DI-|)/[(|+DI+|DI-|)×100
Now let’s look at the formula for calculating the ADX.
ADX = Sum of n [((DI +) - (DI-)) / ((DI +) + (DI-))] / n
This is one of the easy formulas for calculating an ADX value.
Example of calculating ADX
We have now known the formula to calculate the ADX. Now we have to apply it by solving it with a practical example. Now let’s go .
Current High = 6.3
Current Low = 5.9
Previous High = 5.7
Previous Low = 6.0
Previous Close = 5.5
Period = 16
First of all let’s calculate the +DMI and -DMI.
+DMI = Current High - Previous High = CH - PH
= 6.3-5.7= 0.6
-DMI = Previous Low - Current Low = PL - CL
= 6.0-5.9 = 0.1
Now let’s calculate the true range.
True Range (TR) = MAX (|CH - CL|; |CH - PC|; |CL - PC|)
TR = MAX(|6.3-5.9|; |6.3-5.5|; |5.9-5.5|)
TR= 0.4 ; 0.8 ; 0.4
TR= 0.8, the maximum value of the TR values.
We can now calculate the +DI and -DI values.
DI+ = DMI+/TR = 0.6/0.8 = 0.75
DI- = DMI-/TR = 0.1/0.8 = 0.125
We can now calculate the DX
DX =[(|+DI−|DI-|)/[(|+DI+|DI-|)×100
DX =(0.75-0.125)/(0.75+0.125) ×100
DX= 0.625/0.875 ×100
DX= 71.42
Finally we can now go on to calculate the ADX.
ADX = Sum of n [((DI +) - (DI-)) / ((DI +) + (DI-))] / n
ADX = 16[((0.75) - (0.125)) / ((0.75) + (0.125))] / 3
ADX = 3.8
Since the ADX value is between 0 to 25, it indicates that the trend is weak.

2. How to add ADX, DI+ and DI- indicators to the chart, what are its best settings? And why? (Screenshot required)
To be able to add the indicator to a chart, we have to follow this steps listed below.
- First of all visit Tradingview and open charts.
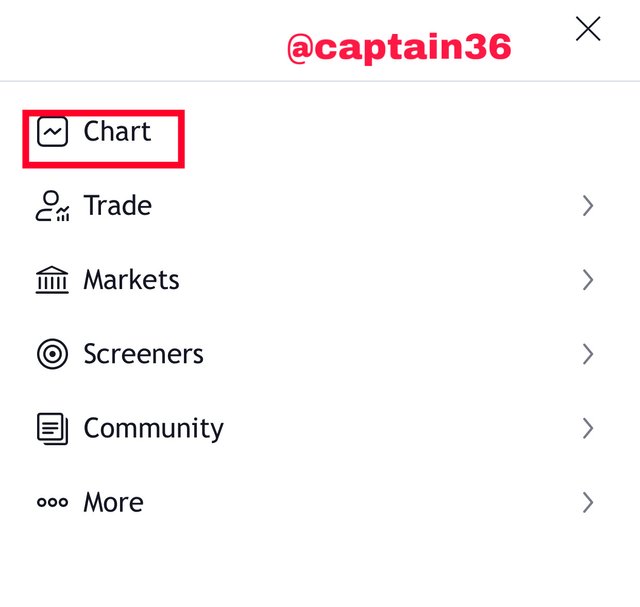
Screenshot from Tradingview
Then choose the indicator symbol which is located at the top of the chart
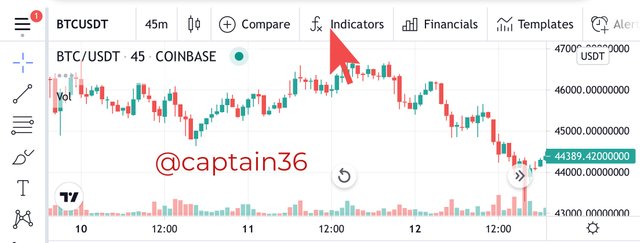
We will see a drop box where we will type directional movement index so that we can get the ADX, -DI and +DI.
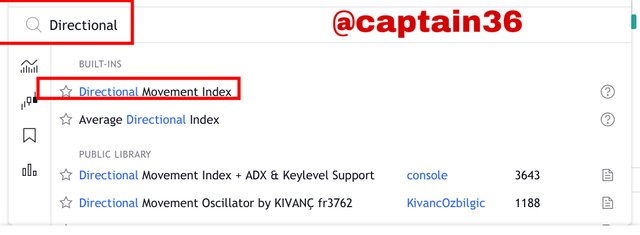
- The indicator can now be seen below
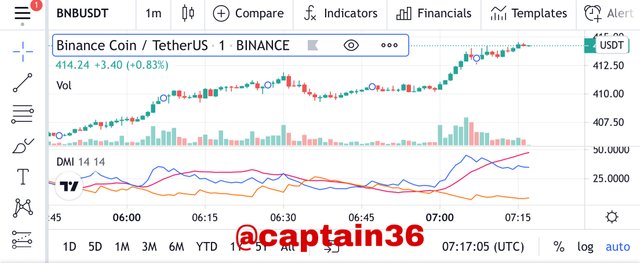
How to configure the Indicator
- We can make changes to the indicator. We click on the indicator then click on the settings symbol that appears. Then we can configure the Indicator. Let’s get started with the color of the indicator. As seen in the screenshot below we can change the color of the indicator but I prefer to maintain the original color.
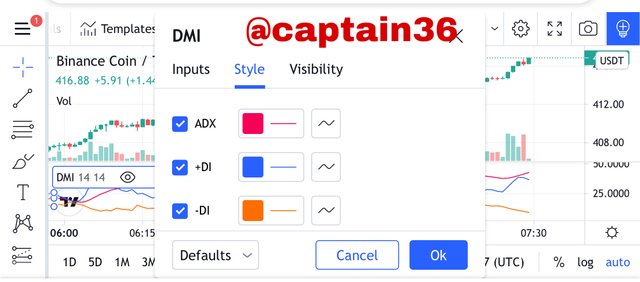
- From there we move to inputs to set our periods for the ADX and the DI lines. I’ve set mine to 30
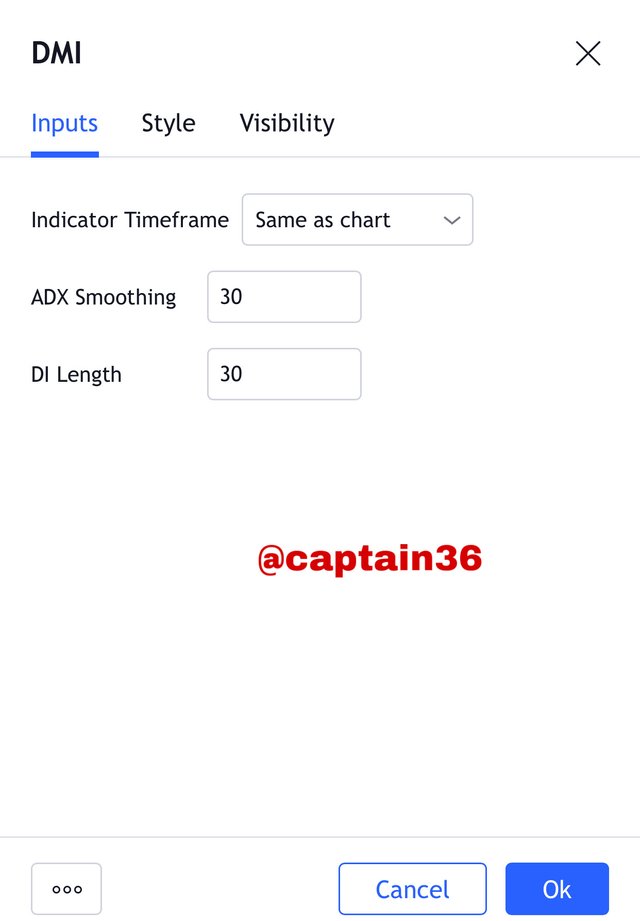
- we then move to visibility settings. Here we can set the time frames we want to see the indicators.
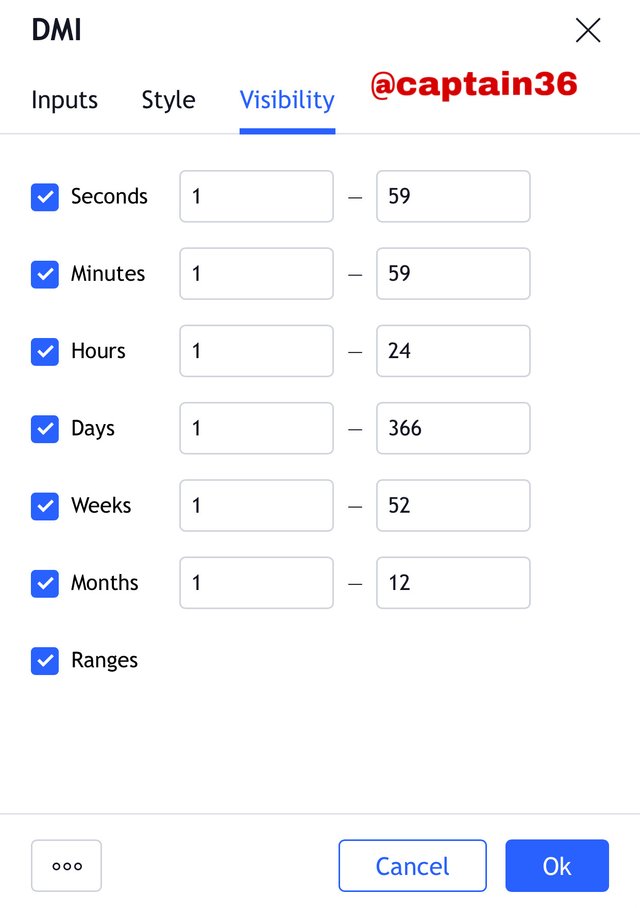
When we set the range of the indicator, we are setting the range at which the indicator should concentrate on. The period determines where the indicator will lay emphasis on. For instance when we set the period to 30, the outcome of the indicator will depend on the last 30 periods.
Using higher time frame period is advisable when using this indicator. When small periods are used, a lot of errors occur which the indicator doesn’t get much time to rectify. But when a larger time frame period is used, the errors are corrected by the indicator and the quantity of wrong signals are minimized. These wrong signals occur as a result of small noises picked up by the indicator. A larger period will make sure that these small noises are eradicated from the trade.
Small periods
Let’s use a period of 8 and see how the chart looks like.
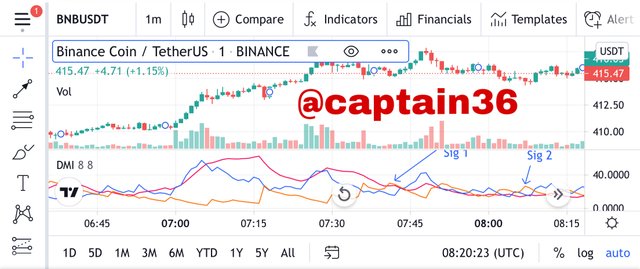
It can be seen clearly that it picks the small noises. The higher time frame doesn’t stop that . We can see it gives different signals which makes it unclear.
Higher Periods
Let’s try this with a period of 30.
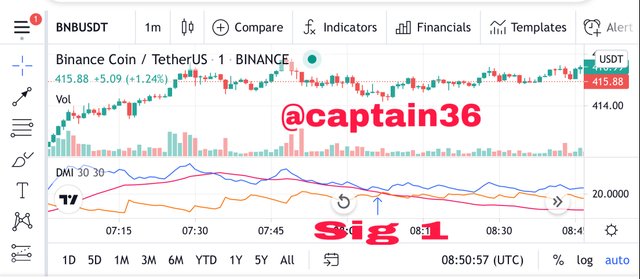
When we use a larger period, we can see the signal for a good market trend is only one, which gives us a clearer view.

3.Do you need to add DI+ and DI- indicators to be able to trade with ADX? How can we take advantage of this indicator? (Screenshot required)
It is not compulsory to add the DI+ and DI- indicators before you can trade with ADX. However adding them helps you to make the right decisions when using the ADX indicator. The DI+ indicates the strength of a rising trend whilst the DI- shows the strength of a falling trend. This is the reason why
we conclude that the market is rising when the DI+ is above and the same way we say the market is falling when the DI- is above. The reason why it is good to add these indicators is that, the DI+ and DI- indicators can operate independently, hence they react very fast to give results more than the ADX because the ADX is derived from the combination of two separate indicators.
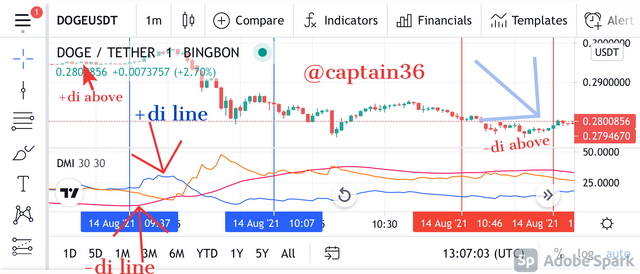
From the chart above, it is clear that the position of DI+ and DI- gives us a more clearer picture about the strength of the trend. This is only an indication of the strength of the trend, it doesn’t guarantee traders to rush into the market when they see either +di or -di crossing to the top. The space between the lines indicates the strength of the trend as well. The bigger the space, the bigger the ADX line.
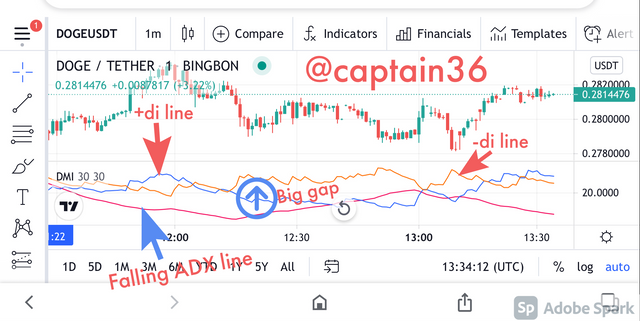
The chart above shows the influence of gaps on the ADX line.

4.What are the different trends detected using the ADX? And how do you filter out the false signals? (Screenshot required)
The ADX is used in detecting different trends in the market. These trends are as follows;
Weak trend or neutral trend
Strong trend
Very strong trend
Extremely strong trend
Weak trend
In this type of trend, the ADX ranges between 0 to 25.
This type of trend indicates that the number of buyers and sellers in the market at that particular time are almost the same. The market is not pushed in one direction hence a trend in one direction is not strong enough. When ADX shows this trend, it means the market is less predictable. It is not advisable for traders to enter the market with this trend. Traders who are also in the market already are advised to quit because the strength that was pushing the market in a particular direction has weakened or doesn’t exist any longer. So we wait for new trends to form before entering market.
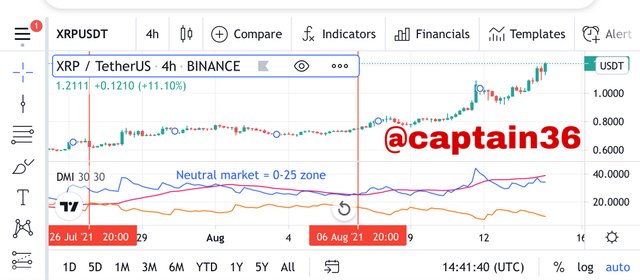
As seen in the chart above, the zone of the ADX was neutral and there was basically no trend showing.
Strong trend
This trend has an ADX range of 25-50. At this point it has just entered from the neutral zone and it is indicating that there is a trend. It doesn’t show the direction of the trend because that’s not the function of the ADX. It only points out that there is a trend.
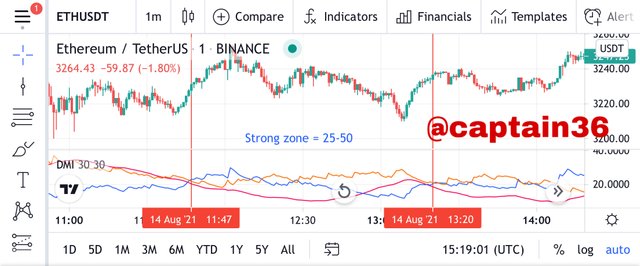
From the chart above, the ADX line moved to 25-50 range, this indicates to us that there is a trend and the trend is becoming clearer.
Very strong trend
At this point, it shows that the market is very strong pushing a trend in a particular direction. It has an ADX range of 50-75. This is a good point to enter a market as it clearly indicates that there is a strong trend. Support and resistance levels continue to be broken because this trend is very strong. The market is also volatile at this point.
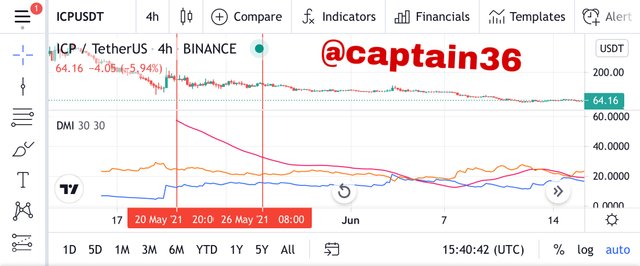
In the chart above, we can see that in this ADX zone the market was very strong.
Extremely strong trend
Here is where there is some huge abnormal strength in the trend. This might be because traders have heard some news somewhere and are rushing to enter the market to cause a very strong push in one direction. This not a good time to enter the market because the news or information spreading around might be deceptive. This scenario is not all that common and it’s hard to find them on charts.
How do you filter out the false signals?
The use of correct signals is one of the factors that can filter out false signals. The use of large periods help in picking up noises by the ADX which prevents bad signals. Using small periods on the other hand results in so many errors.
The formation of trends such as higher highs or lows can be applied on the ADX to predict the happenings in the market. For instance when a market is forming a bullish trend or a bearish trend and the ADX is also on the rise, we have to notice that a strong trend might be about to form. Conversely, if we observe a market forming trends for a long period and then the ADX is decreasing, we should observe that it might be time to quit the market. Let’s be reminded that the ADX doesn’t identify reversal of trend but it only shows the presence of the trend or not.

5.Explain what a breakout is. And How do you use the ADX filter to determine a valid breakout? (Screenshot required)
When a market moves away from it’s normal phase suddenly, it is called a breakout. The normal phase in which it moves is called the consolidation phase. When a breakout happens, the market breaks support or resistance levels and move in either the same direction of the original trend or in a different direction. A breakout can either by downward or upward depending on the situation.
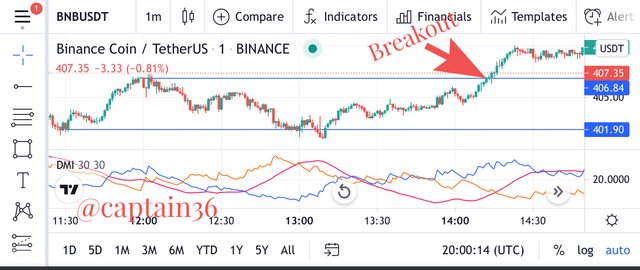
From the above chart we can observe that there was a breakout that went upward from the normal phase. A strong upward candle broke the phase and made the market to move upward.
How do you use the ADX filter to determine a valid breakout?
ADX indicator is used to determine the strength of a trend. The strength of these trends depend on the buyers and sellers in the market at a particular time. Based on this when we recognize the ADX to be above the range of 0-25 whilst there’s a breakout, we’ll conclude that the breakout is a strong one. On the other hand when a breakout happens and the ADX is below 25, it shows a downward breakout and it’s not advisable to enter the market at that time.
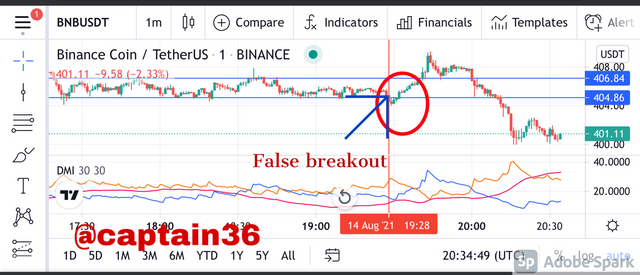
Looking at the chart above, it’s clear that the breakout was fake and the ADX will help every trader to identify that. The market actually experienced a breakout but at that point the ADX was below 25 which means it was not strong enough and eventually the market returned to its normal trend within a short time.
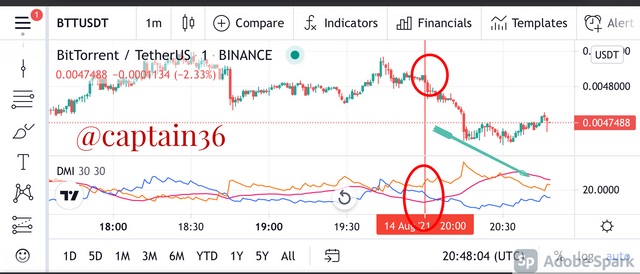
Looking at the chart above, at the point the was a breakout in trend and the trend started moving downward, the ADX was greater than 25. Due to this reason, we can see that the trend continued going downward after the breakout and this justifies that the breakout was a strong one .

6.What is the difference between using the ADX indicator for scalping and swing trading? What do you prefer between them? And why?
| Scalping | Swing trading |
|---|---|
| Support and resistance points are identified and use ADX for trading | Identify changes in prices of assets and take a position |
| Trade is made within a short time | Relatively long trading time |
| Usually the period is set to 100 to determine strong trends. | Best period is 30. However it can still be set to any period and still get results |
| Different variety of indicators are added to it to function | It uses only two specific indicators. These indicators are called Ichimoku and pivot point indicator. |
What do you prefer between them? And why?
I prefer the swing trading method. I don’t like scalping trading method because any mistake in calculation within a short time can ruin your whole investment. Remember profits can be obtained within a short time in this method but the small time frame could also lead to errors that destroys the whole trading investment.
The swing trading on the other hand is my favorite because it gives more time to operate. After doing some analysis for some days I can take my profit when they meet my target I set before entering the market. In this method too I can add any other indicator to the ADX indicator and that will help me study the market properly.

Conclusion
In this lecture, we learnt that the ADX indicator helps us to determine the strength of a trend. This indicator operates within the range of 0-100 with other subdivisions within this range which we discussed earlier. A trend can be said to be strong if the ADX exceeds 25, anything below 25 means there’s no trend or the trend is very weak. The purpose of the ADX is to determine the presence or strength of the trend. If we want to predict the direction of the trend, we add DI+ and DI- indicators to the ADX so that we can get some signals of the directional movement.
Thank you professor @kouba01 for this detailed lecture. This class has been beneficial to me and I’ve learnt how to use the ADX indicator very well
Hello @captain36,
Thank you for participating in the 7th Week Crypto Course in its third season and for your efforts to complete the suggested tasks, you deserve a 4.5/10 rating, according to the following scale:
My review :
An article with under average content due to the absence of analysis for several aspects of the topic, and here are the details.
A simplified explanation of the indicator and its use.
The final operation is ADX = Sum of n [((DI +) - (DI-)) / ((DI +) + (DI-))] / n, So to get the correct ADX result, you need to calculate DX values for at least n periods then smooth the results.
Determining the best settings mainly depends on the trading strategy that the trader is willing to use.
You did not well explain how it is possible to extract the false signals based on ADX indicator.
The rest of the questions did not go into depth analysis.
Thanks again for your effort, and we look forward to reading your next work.
Sincerely,@kouba01
Downvoting a post can decrease pending rewards and make it less visible. Common reasons:
Submit